

Abstract
Although interferon-gamma (IFN-γ) plays a critical role in the noncytolytic elimination of many neurotropic viral infections, the signaling response to this cytokine has not been extensively characterized in primary CNS neurons. We previously demonstrated that the IFN-γ response at the signaling and gene expression levels is temporally extended in primary mouse hippocampal neurons, as compared to the transient response of primary mouse embryonic fibroblasts (MEF). We hypothesize that the protracted kinetics of STAT1 phosphorylation in IFN-γ-treated neurons are due to extended receptor activation and/or delayed STAT1 dephosphorylation in the nucleus. Here, we show that in response to IFN-γ, the Janus kinases (JAK1/JAK2) associated with the neuronal IFN-γ receptor complex remain active for an extended period as compared to MEF. Experimental inactivation of JAK1/JAK2 in neurons after IFN-γ treatment did not reverse the extended STAT1 phosphorylation phenotype. These results suggest that the extended kinetics of neuronal IFN-γ signaling are a product of distinct negative feedback mechanisms operating at both the receptor and within the nucleus.
Keywords: Interferon-gamma, CNS neurons, signal transduction, JAK, STAT
1. Introduction
Interferon-gamma (IFN-γ), a key player in both the innate and adaptive arms of the immune response, induces the expression of antiviral and antibacterial response genes, and modulates the expression of genes governing immune function. Within the brain, IFN-γ plays an integral role in the clearance of neurotropic viruses (such as vesicular stomatitis virus (Komatsu et al., 1996), measles virus (Patterson et al., 2002), Theiler’s murine encephalomyelitis virus (Rodriguez et al., 2003), Sindbis virus (Burdeinick-Kerr and Griffin, 2005), and West Nile virus (Shrestha et al., 2006)), without necessitating neuronal loss. IFN-γ is also crucial for the elimination of certain intracellular bacterial infections within the brain (Jin et al., 2004).
A canonical view of the cellular response to IFN-γ receptor engagement has emerged (reviewed in Darnell, 1997; Stark et al., 1998) in which IFN-γ binding and subsequent assembly of its receptor complex (consisting of a heterotetramer of IFNGR1 and R2 subunits), stimulates the phosphorylation and activation of two receptor-associated kinases, Janus kinase (JAK)-1 and JAK2. This, in turn, results in the phosphorylation of multiple tyrosine residues in the cytoplasmic tail of the IFNGR1 subunits. Upon docking to the phosphorylated IFNGR1 subunit, Signal Transducer and Activator of Transcription (STAT)-1 is phosphorylated on tyrosine 701 (pY701), resulting in its homodimerization. The phospho-STAT1 homodimer is then translocated to the nucleus and binds to Gamma Activated Sequence (GAS) elements within the promoters of IFN-γ-responsive genes, thus influencing their expression. While other signal transduction factors can respond to IFN-γ (such as STAT3), STAT1 is the primary mediator of the IFN-γ signal in most cells studied to date.
Chronic activation of the IFN-γ pathway can be cytotoxic, and therefore the cellular response is negatively regulated at two primary locations: i) at the cell membrane, via deactivation of IFN-γ receptor-associated JAK1 and JAK2; and ii) in the nucleus, via dephosphorylation of activated STAT1 (reviewed in Wormald et al., 2006). These mechanisms typically involve the expression and activity of both IFN-γ-responsive proteins as well as constitutively-expressed phosphatases. For example, the expression of Suppressor Of Cytokine Signaling (SOCS)-1 is induced in response to IFN-γ; it binds to IFN-γ receptor-associated JAKs and thereby prevents continued phosphorylation of the IFNGR1 subunits (Endo et al., 1997; Giordanetto and Kroemer, 2003; Wormald et al., 2006; Yasukawa et al., 1999), effectively suppressing the response to IFN-γ at the level of the receptor. In the nucleus, the IFN-γ response is modulated by the dephosphorylation of STAT1. When dephosphorylated, the STAT1 homodimer disassembles and loses its ability to act as a transcription factor. Nuclear STAT1 phosphatase activity has been attributed to a splice isoform of TC-PTP, known as TC45 (ten Hoeve et al., 2002). Previous studies have demonstrated that the IFN-γ response in non-neuronal cells is typically attenuated by these negative feedback mechanisms within 4-20 hours of IFN-γ exposure (Wormald et al., 2006).
Although the neuronal functional response to type I and type II interferons has been studied (Burdeinick-Kerr et al., 2009; Chesler et al., 2004; Delhaye et al., 2006; Goody et al., 2007; Massa et al., 1999; Samuel et al., 2006; Trottier et al., 2005; Wang and Campbell, 2005; Yang et al., 2006), an understanding of IFN-γ signaling kinetics and their significance in governing cellular responses is lacking. To address this gap, our lab quantitatively compared the responses of primary hippocampal neurons and primary fibroblasts to IFN-γ, and found that the responses of these two cell types were markedly distinct. STAT1 phosphorylation in IFN-γ-treated neurons was delayed and decreased in intensity as compared to the more widely-studied fibroblasts, which resulted in parallel effects on IFN-γ-responsive gene expression. These data underscored the importance of both the timing and magnitude of STAT signaling pathways in orchestrating the cell-specific response to exogenous IFN-γ. Moreover, the duration of the response of primary CNS neurons at the level of signal transduction and IFN-γ- responsive gene expression was significantly longer that that of primary fibroblasts. Specifically, after a 30-minute exposure to IFN-γ, phosphorylated STAT1 was detectable for over 48 hours in neurons, whereas it was undetectable by 24 hours post-exposure in MEF. Consistent with this observation, IFN-γ-driven gene expression in neurons followed similar kinetics (Rose et al., 2007).
These observations suggested that the negative feedback mechanisms described for non-neuronal cells may not be operative in neurons. Here, we test the hypothesis that extended neuronal STAT1 phosphorylation in response to IFN-γ stimulation is attributable to a combination of extended receptor activation and delayed STAT1 dephosphorylation.
2. Materials and Methods
Cells and culture conditions
Primary hippocampal neurons were isolated from embryonic (E14-15) inbred, c57Bl/6 mice (Rall et al., 1997) as previously described (Banker and Goslin, 1991; Pasick et al., 1994; Rall et al., 1995), with the exception that neurons were maintained in serum-free neurobasal medium (Life Technologies, Grand Island, NY) supplemented with B27 supplement (Life Technologies), glutamate (4 μg/ml), penicillin (100 U/ml), streptomycin (100 ng/ml), and glutamine (2 mM) in the absence of an astrocyte feeder layer. These cultures are routinely >95% pure, as assessed by MAP-2 immunostaining (not shown). Primary mouse embryonic fibroblasts (MEF) were isolated from the same embryos and maintained in complete DMEM medium (DMEM supplemented with 10% fetal calf serum, 2 mM L-glutamine, 100 U/ml penicillin, and 100 ng/ml streptomycin) as described (Rose et al., 2007). All cells were maintained at 37°C, 5% CO2 in a humidified incubator.
IFN-γtreatment
At the time of isolation, neurons were plated on poly-L-lysine (Sigma, St. Louis, MO) coated tissue culture plastic at a density of 560 cells/mm2, and were allowed to differentiate for 5 days. MEF were maintained in culture without passaging for 4 days, and were plated at a density of 280 cells/mm2 one day prior to experimentation. On the day of treatment, the culture medium was supplemented with either recombinant mouse IFN-γ (BD Biosciences Pharmingen, San Jose, CA; 100 U/ml in Dulbecco’s phosphate buffered saline (DPBS)), or with an equal volume of DPBS alone, and incubated for 30 min. After incubation, cells were washed 5 times with DPBS, to ensure complete removal of exogenously-added IFN-γ. Unsupplemented conditioned culture medium was then added back to the cells, which were incubated for the indicated times (Figure 1). At each timepoint, whole cell lysates were collected for immunoblot analysis (described below).
Figure 1. IFN-γ exposure and sample collection.
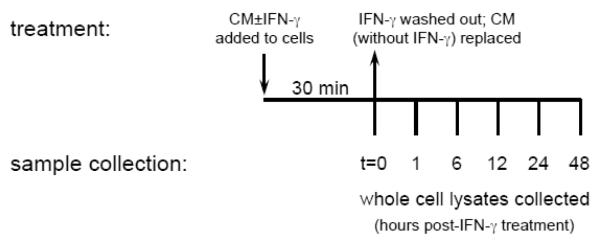
Schematic for the experimental setup used to establish IFN-γ-stimulated JAK1 and JAK2 activation kinetics in neurons and MEF. CM: conditioned medium.
JAK inhibitor I experiments
To confirm the activity of JAK inhibitor I, neurons and MEF were plated as described above and were treated with IFN-γ (100U/ml) in the presence of JAK inhibitor I (Calbiochem; 10μM), or vehicle only (DMSO). Cells were incubated for the indicated times (Figure 4a), and whole cell lysates were collected for immunoblot analysis (described below).
Figure 4. JAK inhibitor I effectively prevents IFN-γ-stimulated STAT1 activation in neurons.

a) Neurons and MEF were treated with IFN-γ (100U/ml) or without IFN-γ (Ø) in the presence or absence of JAK inhibitor I (10μM). Cell lysates were collected at the indicated timepoints post-treatment. b) Equal volumes of lysates were examined by immunoblotting for phospho-STAT1 (pY701) and GAPDH signals.
To examine the duration of STAT1 phosphorylation after artificial shutdown of the IFN-γ receptor, neurons and MEF were treated with IFN-γ for 30 min. and washed as described above. The cells were then incubated in conditioned culture medium supplemented with 10μM JAK inhibitor I or DMSO. Cell lysates were collected at the indicated timepoints post-treatment (Figure 5a) for immunoblot analysis (described below).
Figure 5. STAT1 dephosphorylation is delayed in IFN-γ-treated neurons as compared to MEF.

a) Neurons and MEF were treated with IFN-γ (100U/ml) or without IFN-γ (Ø) for 30 min, washed, and then incubated with CM supplemented with or without JAK inhibitor I (10μM) for the indicated timepoints. b) Equal volumes of whole cell lysates were examined by immunoblotting for phospho-STAT1 (pY701) and GAPDH signals. c) Blot signals were quantified using densitometry, and phospho-STAT1 signals were normalized for loading. Values are expressed as a percent of maximum phospho-STAT1 signal. Data shown are from a representative experiment.
Immunoblots
Untreated and IFN-γ-treated cells were lysed directly with protein solubilization buffer (106 mM Tris HCl, 141 mM Tris Base, 0.51 mM EDTA, 2% SDS). Equal volumes of whole cell lysate per treatment were separated on a NuPAGE 7% Tris-Acetate gel (Invitrogen), and transferred (semi-dry) to PVDF (Bio-Rad). Within an experiment, corresponding samples from neurons and MEF were run on the same gel, to allow for direct comparisons. The blots were blocked overnight in TBS containing 0.1% Tween-20 (PBS-T) and 5% BSA.
For analysis of JAK1 and JAK2 phosphorylation, the blots were incubated overnight at 4°C in primary antibodies (either anti-JAK1 (1:1000), anti-JAK1p (pY1022/1023; 1:1000), anti-JAK2 (1:1000), or anti-JAK2p (pY1007/1008; 1:1000); Cell Signaling Technology) diluted in TBS-T containing 3% BSA. After three washes in TBS-T (5 min each), the blots were incubated in secondary antibody solution (goat anti-rabbit horseradish peroxidase (HRP); 1:1000; Santa Cruz Biotechnology Inc.) for 1 hr at room temperature. The blots were washed as described above, incubated in ECL detection solution (Santa Cruz Biotechnology Inc.), and exposed to autoradiography film.
For analysis of STAT1 phosphorylation, the blots were incubated for 1 hr at room temperature in primary antibody (anti-STAT1p (1:1000); BD Biosciences Pharmingen) diluted in PBS-T containing 3% BSA. After three washes in PBS-T (5 min each), the blots were incubated in secondary antibody solution (goat anti-mouse horseradish peroxidase (HRP); 1:2000; Santa Cruz Biotechnology Inc.) for 1 hr at room temperature, and visualized as described above.
For analysis of glyceraldehyde-3-phosphate dehydrogenase (GAPDH) expression (as a loading control), the blots were incubated in primary antibody solution (anti-GAPDH (1:1000); Chemicon International Inc.), washed, then incubated in secondary antibody solution (goat anti-mouse horseradish peroxidase (HRP); 1:2000; Santa Cruz Biotechnology Inc.). The blots were then washed and visualized as described above.
Densitometric analysis of autoradiography films was performed using ImageJ64 (v.1.45d) software. Densitometry window size was consistent within each blot analyzed.
3. Results
IFN-γ receptor activation kinetics
To examine the activation kinetics of the IFN-γ receptor complex in response to IFN-γ treatment, we utilized the experimental design shown in Figure 1. We first examined the phosphorylation of the receptor-associated Janus kinases, JAK1 and JAK2, as these kinases are required for initiating the signal transduction pathway upon IFN-γ binding (Neubauer et al., 1998; Rodig et al., 1998). Basal levels of JAK1 expression were lower in neurons as compared to MEF (Figure 2b). In both cell types, maximal JAK1 phosphorylation occurred within one hour post-treatment, with neurons demonstrating a slight delay (Figure 2c). Between one and six hours post treatment, JAK1 phosphorylation returned to baseline levels in both cell types. These levels continued to gradually decline in MEF to approximately 50% of the untreated control value, whereas in neurons JAK1 phosphorylation remained above baseline throughout the 48 hr timecourse (Figure 2).
Figure 2. JAK1 phosphorylation is extended in IFN-γ-treated neurons as compared to MEF.

Neurons and MEF were treated as described (Figure 1), and equal volumes of cell lysates were examined by immunoblotting for a) phospho-JAK1 (pY1022/1023); b) total JAK1; and GAPDH signals. The double bands in the phospho-JAK1 blot are due to hyperphosphorylation of JAK1 (Irie-Sasaki et al., 2001); both bands were included in the densitometry. c) Blot signals were quantified using densitometry, and phospho-JAK1 signals were normalized to total JAK1 expression and GAPDH for loading. Values are expressed as a percent of control. Data shown are from a representative experiment. Ø: cells not exposed to IFN-γ.
In contrast to the subtle cell type differences seen for JAK1, the activation kinetics of JAK2 in response to IFN-γ treatment were more dramatic (Figure 3). First, basal levels of JAK2 expression were higher in neurons as compared to MEF (Figure 3b). In both cell types, a low background level of JAK2 phosphorylation was observed, with untreated MEF having a slightly higher level than untreated neurons. In IFN-γ-treated neurons, JAK2 demonstrated a rapid, 3-fold higher level of activation as compared to untreated control levels, which decreased by approximately 30% between 0-12 hrs post-treatment (Figure 3). These levels increased sharply between 12-48 hrs post-IFN-γ treatment (Figure 3). In contrast, only transient, almost undetectable fluctuations in JAK2 phosphorylation were observed in MEF over the 48-hr time period post-IFN-γtreatment (Figure 3).
Figure 3. JAK2 phosphorylation in IFN-γ-treated neurons is significantly extended as compared to MEF.

Neurons and MEF were treated as described (Figure 1), and equal volumes of cell lysates were examined by immunoblotting for a) phospho-JAK2 (pY1007/1008); b) total JAK2; and GAPDH signals. c) Blot signals were quantified using densitometry, and phospho-JAK2 signals were normalized to total JAK2 expression and to GAPDH for loading. Values are expressed as a percent of control. Data shown are from a representative experiment. Ø: cells not exposed to IFN-γ.
Interestingly, for both JAK1 and JAK2, we observed a transient decline in the phosphorylation levels followed by an increase in phosphorylation after 12 hrs (Figures 2 and 3). This was unique to neurons, since phosphorylation of these kinases in MEFs demonstrated a rapid decline beginning 1 hr post-IFN-γ removal (Figure 2).
Taken together, these data indicate that phosphorylation of JAK1 and JAK2 is prolonged in IFN-γ-treated neurons, perhaps contributing to the extended gene expression profiles we observe following IFN-γ treatment.
STAT1 deactivation kinetics
To assess the role that JAK activation plays in sustained neuronal STAT1 phosphorylation, we employed JAK inhibitor I, which selectively inactivates JAK1 and JAK2. It was first necessary to confirm that the use of JAK inhibitor I would result in inhibition of STAT1 activation, using the experimental design shown in Figure 4a. Figure 4b demonstrates that neurons treated with IFN-γ in the absence of JAK inhibitor I showed a muted and delayed profile of STAT1 activation. However, neurons exposed to IFN-γ in the presence of 10μM JAK inhibitor I demonstrated no detectable STAT1 phosphorylation, and MEF demonstrated a severely muted STAT1 response (Figure 4b).
Next, in order to assess whether STAT1 dephosphorylation was delayed in neurons as compared to MEF, we employed a strategy whereby cells were stimulated with IFN-γ for 30 min, the IFN-γ was removed, and then 10μM JAK inhibitor I was added (Figure 5a). Using this approach, any phospho-STAT1 detected after the addition of the inhibitor would represent STAT1 that was activated during the 30 min IFN-γ treatment, and that had not yet been dephosphorylated. Therefore, a decline in phospho-STAT1 levels post-inhibitor addition would indicate a rapid deactivation of STAT1 (as no additional neuronal STAT1 is phosphorylated de novo upon inhibitor treatment; Figure 4b). Figures 5b and 5c demonstrate that without JAK inhibitor I treatment, STAT1 phosphorylation was detectable (~60% of maximal activation) in neurons 48 hrs post-IFN-γ treatment, whereas it was only weakly detectable (~10% of maximal activation) in MEF at the same timepoint (Fig. 5b and 5c; “no inhibitor” 48 hr lanes). When JAK inhibitor I was added after the IFN-γ was removed, both cell types demonstrated an overall drop in STAT1 activation (Figure 5b). However, in the presence of JAK inhibitor I, STAT1 phosphorylation was still detectable in neuron lysates 48 hrs post-IFN-γ treatment (~12% of maximal activation), whereas it was barely detectable in MEF only 24 hrs post-IFN-γ treatment (~2% of maximal activation), and undetectable at 48 hrs (Figures 5b and 5c).
Taken together, these results indicate that in primary neurons, IFN-γ stimulation results in extended activity of the IFN-γ receptor at the membrane and a delay in STAT1 dephosphorylation in the nucleus, both of which likely contribute to the extended kinetics of STAT1 phosphorylation in IFN-γ-treated neurons.
4. Discussion
Our study suggests that extended JAK activation and delayed STAT1 dephosphorylation contribute to the previously-observed extended kinetics of STAT1 phosphorylation in neurons exposed to IFN-γ.
We chose to examine the activation kinetics of the associated kinases JAK1 and JAK2, for several reasons. First, these kinases are required for the initiation of IFN-γ signaling (Neubauer et al., 1998; Rodig et al., 1998). Second, not only do they phosphorylate the R1 subunit of the IFNGR complex (providing docking sites for STAT1 recruitment), they also phosphorylate and activate the recruited STAT1 molecules, which then translocate to the nucleus and initiate transcription of IFN-γ-responsive genes. The activation of JAK2, and to a lesser extent, JAK1, was prolonged in neurons after a 30 min exposure to IFN-γ. This would allow for an extended duration of STAT1 activation in two ways: 1) continued phosphorylation of the receptor complex provides continuous docking sites to recruit STAT1; and 2) the recruited STAT1 continues to be phosphorylated by the active kinases. These observations suggest that the neuronal IFNGR complex subunits remain stably associated in the absence of exogenously-added IFN-γ. The receptor complex may remain bound to IFN-γ, or there may be differences in the internalization and/or degradation of the neuronal IFN-γ receptor.
The extended activation kinetics of the IFNGR-associated JAKs also suggest an alteration in the negative feedback mechanisms that control their activity. We originally considered that neurons may express reduced levels of SOCS-1 (the major negative regulator of IFN-γ signaling at the receptor complex); however, we found no appreciable deficiency in the expression of SOCS-1 in neurons as compared to MEF (Supplemental Figure S1a). Even so, SOCS-1 requires direct interaction with the JAKs to inhibit their activity (Giordanetto and Kroemer, 2003; Yasukawa et al., 1999); thus, an impairment in their interaction (for example, absence of SOCS-1 shuttling to the cell membrane), could prevent its activity despite normal expression levels.
The transient decrease in JAK1 and JAK2 phosphorylation observed in IFN-γ-treated neurons (but not in MEF) warrants comment. In MEF, IFN-γ-stimulated JAK1 phosphorylation is rapidly attenuated via the previously-described activity of SOCS-1 and phosphatases (reviewed in Wormald and Hilton, 2004). However, the transient nature of this attenuation in neurons, followed by an increase in JAK phosphorylation, further points to cell-specific differences in the negative feedback mechanisms that control the IFN-γ response.
A separate, yet not mutually-exclusive explanation for the extended duration of STAT1 phosphorylation in IFN-γ-treated neurons, invokes a lack of STAT1 dephosphorylation in the nucleus. Using JAK inhibitor I, we dissected the contribution of an active receptor from phospho-STAT1 longevity: addition of the drug inhibits de novo STAT1 phosphorylation; thus, phospho-STAT1 detected after inhibitor addition was phosphorylated during the IFN-γ treatment period. If the extended STAT1 phoshorylation in neurons was due solely to a delay in the dephosphorylation of STAT1, we would expect to observe the phospho-STAT1 signal for longer durations after the addition of the inhibitor. Alternatively, if the extended STAT1 phoshorylation in neurons was due solely to prolonged receptor activity, we would expect to see a lack of phospho-STAT1 signal at later time-points post-inhibitor addition. We observed a prolonged neuronal STAT1 signal post-inhibitor addition as compared to MEF; however, the signal was not as strong as observed in inhibitor-untreated cells. This suggests that a delay in neuronal STAT1 dephosphorylation is not the sole mechanism. Taken together, these results suggest that both extended receptor activation and a delay in STAT1 dephosphorylation contribute to the prolonged STAT1 phosphorylation observed in IFN-γ-treated neurons.
The observed delay in neuronal STAT1 dephosphorylation suggests a deficiency in STAT1 phosphatase expression. We thus examined the expression of TC45, the proposed nuclear STAT1 phosphatase (ten Hoeve et al., 2002); however, no appreciable cell-specific deficiencies were observed (Supplemental Figure S1b). Ongoing studies are addressing whether neuronal TC45 is properly localized to the nucleus.
Collectively, our results contribute to a growing literature that indicates that cellular responses to extracellular mediators such as cytokines can vary dramatically based on cell type. One could argue that the unique nature of the neuron (a typically non-renewable cell population that is “protected” from damage by myriad methods) might display altered responses to key antiviral cytokines such as interferons. How these differences ultimately manifest in neuronal responsiveness to infection and immune-mediated clearance are a current area of focus.
The results of the present study represent a significant divergence from much of the commonly accepted understanding of the mechanics of the IFN-γ response and the way it is inactivated. An enhanced understanding of how cell-type specific differences influence the response to a common cytokine trigger will not only deepen our understanding of how cell type-specific differences can shape responses to cytokines, but may also be informative in the consideration and design of cytokine-based therapies for chronic CNS diseases.
Supplementary Material
Acknowledgements
The current study was supported by funds from the Stacy Anne Vitetta ’82 Professorship (to RWR), and grants from the NIH (RO1 NS40500 to GFR; P30CA006927 to Fox Chase) as well as a gift from the F.M. Kirby Foundation. The authors would like to thank Marissa Dennis for her contribution to this study.
Footnotes
Publisher's Disclaimer: This is a PDF file of an unedited manuscript that has been accepted for publication. As a service to our customers we are providing this early version of the manuscript. The manuscript will undergo copyediting, typesetting, and review of the resulting proof before it is published in its final citable form. Please note that during the production process errors may be discovered which could affect the content, and all legal disclaimers that apply to the journal pertain.
Contributor Information
Lisa C. Durso, Department of Biology Arcadia University 450 South Easton Road Glenside, PA 19038
Stephanie M. Evans, Department of Biology Arcadia University 450 South Easton Road Glenside, PA 19038
References
- Banker G, Goslin K. Culturing Nerve Cells. MIT Press; Cambridge: 1991. [Google Scholar]
- Burdeinick-Kerr R, Govindarajan D, Griffin DE. Noncytolytic clearance of Sindbis virus infection from neurons by gamma interferon is dependent on Jak/STAT signaling. J Virol. 2009;83:3429–3435. doi: 10.1128/JVI.02381-08. [DOI] [PMC free article] [PubMed] [Google Scholar]
- Burdeinick-Kerr R, Griffin DE. Gamma interferon-dependent, noncytolytic clearance of Sindbis virus infection from neurons in vitro. J Virol. 2005;79:5374–5385. doi: 10.1128/JVI.79.9.5374-5385.2005. [DOI] [PMC free article] [PubMed] [Google Scholar]
- Chesler DA, Dodard C, Lee GY, Levy DE, Reiss CS. Interferon-gamma-induced inhibition of neuronal vesicular stomatitis virus infection is STAT1 dependent. J Neurovirol. 2004;10:57–63. doi: 10.1080/13550280490261707. [DOI] [PubMed] [Google Scholar]
- Darnell JE., Jr. STATs and gene regulation. Science. 1997;277:1630–1635. doi: 10.1126/science.277.5332.1630. [DOI] [PubMed] [Google Scholar]
- Delhaye S, Paul S, Blakqori G, Minet M, Weber F, Staeheli P, Michiels T. Neurons produce type I interferon during viral encephalitis. Proc Natl Acad Sci U S A. 2006;103:7835–7840. doi: 10.1073/pnas.0602460103. [DOI] [PMC free article] [PubMed] [Google Scholar]
- Endo TA, Masuhara M, Yokouchi M, Suzuki R, Sakamoto H, Mitsui K, Matsumoto A, Tanimura S, Ohtsubo M, Misawa H, Miyazaki T, Leonor N, Taniguchi T, Fujita T, Kanakura Y, Komiya S, Yoshimura A. A new protein containing an SH2 domain that inhibits JAK kinases. Nature. 1997;387:921–924. doi: 10.1038/43213. [DOI] [PubMed] [Google Scholar]
- Giordanetto F, Kroemer RT. A three-dimensional model of Suppressor Of Cytokine Signalling 1 (SOCS-1) Protein Eng. 2003;16:115–124. doi: 10.1093/proeng/gzg015. [DOI] [PubMed] [Google Scholar]
- Goody RJ, Beckham JD, Rubtsova K, Tyler KL. JAK-STAT signaling pathways are activated in the brain following reovirus infection. J Neurovirol. 2007;13:373–383. doi: 10.1080/13550280701344983. [DOI] [PMC free article] [PubMed] [Google Scholar]
- Irie-Sasaki J, Sasaki T, Matsumoto W, Opavsky A, Cheng M, Welstead G, Griffiths E, Krawczyk C, Richardson CD, Aitken K, Iscove N, Koretzky G, Johnson P, Liu P, Rothstein DM, Penninger JM. CD45 is a JAK phosphatase and negatively regulates cytokine receptor signalling. Nature. 2001;409:349–354. doi: 10.1038/35053086. [DOI] [PubMed] [Google Scholar]
- Jin Y, Lundkvist G, Dons L, Kristensson K, Rottenberg ME. Interferon-gamma mediates neuronal killing of intracellular bacteria. Scand J Immunol. 2004;60:437–448. doi: 10.1111/j.0300-9475.2004.01500.x. [DOI] [PubMed] [Google Scholar]
- Komatsu T, Bi Z, Reiss CS. Interferon-gamma induced type I nitric oxide synthase activity inhibits viral replication in neurons. J Neuroimmunol. 1996;68:101–108. doi: 10.1016/0165-5728(96)00083-5. [DOI] [PubMed] [Google Scholar]
- Massa PT, Whitney LW, Wu C, Ropka SL, Jarosinski KW. A mechanism for selective induction of 2′-5′ oligoadenylate synthetase, anti-viral state, but not MHC class I genes by interferon-beta in neurons. J Neurovirol. 1999;5:161–171. doi: 10.3109/13550289909021998. [DOI] [PubMed] [Google Scholar]
- Neubauer H, Cumano A, Muller M, Wu H, Huffstadt U, Pfeffer K. Jak2 deficiency defines an essential developmental checkpoint in definitive hematopoiesis. Cell. 1998;93:397–409. doi: 10.1016/s0092-8674(00)81168-x. [DOI] [PubMed] [Google Scholar]
- Pasick JM, Kalicharran K, Dales S. Distribution and trafficking of JHM coronavirus structural proteins and virions in primary neurons and the OBL-21 neuronal cell line. J Virol. 1994;68:2915–2928. doi: 10.1128/jvi.68.5.2915-2928.1994. [DOI] [PMC free article] [PubMed] [Google Scholar]
- Patterson CE, Lawrence DM, Echols LA, Rall GF. Immune-mediated protection from measles virus-induced central nervous system disease is noncytolytic and gamma interferon dependent. J Virol. 2002;76:4497–4506. doi: 10.1128/JVI.76.9.4497-4506.2002. [DOI] [PMC free article] [PubMed] [Google Scholar]
- Rall GF, Manchester M, Daniels LR, Callahan EM, Belman AR, Oldstone MB. A transgenic mouse model for measles virus infection of the brain. Proc Natl Acad Sci U S A. 1997;94:4659–4663. doi: 10.1073/pnas.94.9.4659. [DOI] [PMC free article] [PubMed] [Google Scholar]
- Rall GF, Mucke L, Oldstone MB. Consequences of cytotoxic T lymphocyte interaction with major histocompatibility complex class I-expressing neurons in vivo. J Exp Med. 1995;182:1201–1212. doi: 10.1084/jem.182.5.1201. [DOI] [PMC free article] [PubMed] [Google Scholar]
- Rodig SJ, Meraz MA, White JM, Lampe PA, Riley JK, Arthur CD, King KL, Sheehan KC, Yin L, Pennica D, Johnson EM, Jr., Schreiber RD. Disruption of the Jak1 gene demonstrates obligatory and nonredundant roles of the Jaks in cytokine-induced biologic responses. Cell. 1998;93:373–383. doi: 10.1016/s0092-8674(00)81166-6. [DOI] [PubMed] [Google Scholar]
- Rodriguez M, Zoecklein LJ, Howe CL, Pavelko KD, Gamez JD, Nakane S, Papke LM. Gamma interferon is critical for neuronal viral clearance and protection in a susceptible mouse strain following early intracranial Theiler’s murine encephalomyelitis virus infection. J Virol. 2003;77:12252–12265. doi: 10.1128/JVI.77.22.12252-12265.2003. [DOI] [PMC free article] [PubMed] [Google Scholar]
- Rose RW, Vorobyeva AG, Skipworth JD, Nicolas E, Rall GF. Altered levels of STAT1 and STAT3 influence the neuronal response to interferon gamma. J Neuroimmunol. 2007;192:145–156. doi: 10.1016/j.jneuroim.2007.10.007. [DOI] [PMC free article] [PubMed] [Google Scholar]
- Samuel MA, Whitby K, Keller BC, Marri A, Barchet W, Williams BR, Silverman RH, Gale M, Jr., Diamond MS. PKR and RNase L contribute to protection against lethal West Nile Virus infection by controlling early viral spread in the periphery and replication in neurons. J Virol. 2006;80:7009–7019. doi: 10.1128/JVI.00489-06. [DOI] [PMC free article] [PubMed] [Google Scholar]
- Shrestha B, Wang T, Samuel MA, Whitby K, Craft J, Fikrig E, Diamond MS. Gamma interferon plays a crucial early antiviral role in protection against West Nile virus infection. J Virol. 2006;80:5338–5348. doi: 10.1128/JVI.00274-06. [DOI] [PMC free article] [PubMed] [Google Scholar]
- Stark GR, Kerr IM, Williams BR, Silverman RH, Schreiber RD. How cells respond to interferons. Annu Rev Biochem. 1998;67:227–264. doi: 10.1146/annurev.biochem.67.1.227. [DOI] [PubMed] [Google Scholar]
- ten Hoeve J, de Jesus Ibarra-Sanchez M, Fu Y, Zhu W, Tremblay M, David M, Shuai K. Identification of a nuclear Stat1 protein tyrosine phosphatase. Mol Cell Biol. 2002;22:5662–5668. doi: 10.1128/MCB.22.16.5662-5668.2002. [DOI] [PMC free article] [PubMed] [Google Scholar]
- Trottier MD, Jr., Palian BM, Shoshkes Reiss C. VSV replication in neurons is inhibited by type I IFN at multiple stages of infection. Virology. 2005;333:215–225. doi: 10.1016/j.virol.2005.01.009. [DOI] [PubMed] [Google Scholar]
- Wang J, Campbell IL. Innate STAT1-dependent genomic response of neurons to the antiviral cytokine alpha interferon. J Virol. 2005;79:8295–8302. doi: 10.1128/JVI.79.13.8295-8302.2005. [DOI] [PMC free article] [PubMed] [Google Scholar]
- Wormald S, Hilton DJ. Inhibitors of cytokine signal transduction. J Biol Chem. 2004;279:821–824. doi: 10.1074/jbc.R300030200. [DOI] [PubMed] [Google Scholar]
- Wormald S, Zhang JG, Krebs DL, Mielke LA, Silver J, Alexander WS, Speed TP, Nicola NA, Hilton DJ. The comparative roles of suppressor of cytokine signaling-1 and -3 in the inhibition and desensitization of cytokine signaling. J Biol Chem. 2006;281:11135–11143. doi: 10.1074/jbc.M509595200. [DOI] [PubMed] [Google Scholar]
- Yang J, Tugal D, Reiss CS. The role of the proteasome-ubiquitin pathway in regulation of the IFN-gamma mediated anti-VSV response in neurons. J Neuroimmunol. 2006;181:34–45. doi: 10.1016/j.jneuroim.2006.07.018. [DOI] [PMC free article] [PubMed] [Google Scholar]
- Yasukawa H, Misawa H, Sakamoto H, Masuhara M, Sasaki A, Wakioka T, Ohtsuka S, Imaizumi T, Matsuda T, Ihle JN, Yoshimura A. The JAK-binding protein JAB inhibits Janus tyrosine kinase activity through binding in the activation loop. Embo J. 1999;18:1309–1320. doi: 10.1093/emboj/18.5.1309. [DOI] [PMC free article] [PubMed] [Google Scholar]
Associated Data
This section collects any data citations, data availability statements, or supplementary materials included in this article.