

Abstract
Copy Number Variation (CNV) is increasingly implicated in disease pathogenesis. CNVs are often identified by statistical models applied to data from single nucleotide polymorphism (SNP) panels. Family information for samples provides additional information for CNV inference. Two modes of PennCNV (the Joint-call and Posterior-call), which are some of the most well-developed family-based CNV calling methods, use a “Joint-model” as a main component. This models all family members’ CNV states together with Mendelian inheritance. Methods based on the Joint-model are used to infer CNV calls of cases and controls in a pedigree, which may be compared to each other to test an association. Although benefits from the Joint-model have been shown elsewhere, equality of call rates in parents and offspring has not been evaluated previously. This can affect downstream analyses in studies that compare CNV rates in cases versus controls in pedigrees. In this paper, we show that the Joint-model can introduce different CNV call rates among family members in the absence of a true difference. First, we show that the Joint-model may analytically introduce differential CNV calls because of asymmetry of the model. We demonstrate these differential call rates using single-marker simulations. We show that call rates using the two modes of PennCNV also differ between parents-offspring in one multi-marker simulated dataset and two real datasets. Our results advise need for caution in use of the Joint-model calls in CNV association studies with family-based datasets.
Keywords: Schizophrenia, Calling Algorithm, Family-Based Study, CNV burden
INTRODUCTION
Copy Number Variation (CNV) is increasingly implicated in disease pathogenesis [Morrow 2010; Zhang, et al. 2009b]. Recent work has implicated CNVs in neuropsychiatric disorders such as schizophrenia [Stone, et al. 2008; Xu, et al. 2008] and autism [Glessner, et al. 2009]. Some large CNVs replicate across multiple samples and with multiple technologies. Examples include CNVs on 1q21.1 and 15q13.3 in schizophrenia, and on 2p16.3 and 3p26.3-4 in autism [Glessner, et al. 2009; Stefansson, et al. 2008; Stone, et al. 2008]. However, other published CNV associations are not region-specific, but have been reported to represent a global burden genome-wide, or enrichment in specific pathways [Craddock, et al. 2010a; Pinto, et al. 2010; Sebat, et al. 2007; Stone, et al. 2008; Zhang, et al. 2009a].
CNVs are often assayed by Single Nucleotide Polymorphism (SNP) arrays. There are many different methods to infer CNVs, including traditional cytogenetic methods, and newer array Comparative Genomic Hybridization (array-CGH), SNP arrays and next-generation sequencing [Carter 2007; Korbel, et al. 2007; Peiffer, et al. 2006]. Among these methods, SNP arrays are relatively inexpensive to genotype and have an ability to detect allele-specific CNVs. Thus, SNP arrays are one of the most popular platforms for genomewide CNV inference and are likely to retain this popularity [Morozova and Marra 2008]. CNVs are called from raw measurement of SNP arrays by statistical calling algorithms.
CNV calling from raw SNP data is challenging [Wineinger, et al. 2008]. This can be explained, in part, because fluorescence measurements are not differentiated well quantitatively for each CNV state, and a CNV has more possible states than a diallelic SNP. Consequently, even though many CNV calling methods make use of all the information from SNP arrays, these methods can result in different CNV calls that are inconsistent across methods [Eckel-Passow, et al. 2011; Marenne, et al. 2011; Pinto, et al. 2011; Tsuang, et al. 2010; Winchester, et al. 2009]. Several investigators have noted that when samples are from related subjects, this relatedness provides additional information for calling CNVs [Kohler and Cutler 2007; Kosta, et al. 2007; Marioni, et al. 2008; Wang, et al. 2008; Wang, et al. 2007].
The most well-developed CNV calling methods are implemented in the widely used PennCNV program [Pinto, et al. 2010; Wang, et al. 2008; Wang, et al. 2007]. PennCNV has three modes. The Individual-call mode is based on the “Individual-model”, which assumes all individuals are unrelated, as is the case in many other CNV calling methods. The other two modes, the Posterior-call and Joint-call, use family information and are based on the “Joint-model”, which models all family members’ raw measurements and CNV states together using information from Mendelian inheritance. These two modes utilize the Joint-model to varying degrees. The Posterior-call mode uses the Joint-model only in a limited way based on both the Joint-model and Individual-model. In the first stage, CNVs are called by the Individual-call. In the second stage, the called CNV regions are first aligned in parents and offspring and partitioned into segments. Then the Joint-model is applied to this specific called region. In contrast, the Joint-call mode applies the Joint-model directly to an entire region in a single step. Comparison of the properties of the Joint-call, Posterior-call and Individual-call have shown that the Joint-model has greater sensitivity and smoothes inconsistent borders between CNV calls in parent and offspring [Wang, et al. 2008], which can be preferable in comparisons of unrelated cases and controls when both are from, e.g., parent-offspring trio samples.
The possibility of systematic differential CNV call rates between affected and unaffected subjects may be a critical issue in some association studies with related subjects. Inference about different CNV frequencies depends on the relative call rates both in the presence and in the absence of true underlying CNVs. In addition to use of unrelated cases and controls, published association studies of CNVs span designs ranging from use of cases from trio samples or small multiplex families compared to unrelated controls [Bucan, et al. 2009; Pinto, et al. 2010; Salyakina, et al. 2011], through to designs where cases and controls are from the same families [Bae, et al. 2010; Pamphlett, et al. 2011; Walsh, et al. 2008; Yang, et al. 2009]. In all these designs, CNV calls are compared between cases and controls for finding an association. However, family-based designs that carry out the comparison within the families tend to be unbalanced between generations with respect to affection status. A comparison of CNV calls in an unbalanced design requires a calling method that results in similar call rates in parents versus offspring in the absence of true differences because any difference could be inferred as association of CNVs and disease. However, despite use of calling algorithms for such comparisons within family samples [Bae, et al. 2010; Yang, et al. 2009], possible differences in relative call rates in this context has not yet been discussed nor evaluated.
In this paper, we show that the Joint-model introduces differential CNV call rates between parents and offspring, which can then affect some family-based association studies. We describe an observation of possible global excess CNV burden in offspring compared to parents in a trio sample that motivated this study. We investigate the source of the differential call rates theoretically in the single-marker case. We show that the Joint-model introduces the difference, and that this difference can be bi-directional, counter to naïve intuition. Finally, we show that this difference is consistent with results obtained by using PennCNV to analyze one multi-marker simulated dataset and two real datasets.
MOTIVATING EXAMPLE
Our study was motivated by the observation of possible systematic difference in the CNV call rates between parents and offspring in a dataset consisting of 95 parent-offspring trios that had been sampled through an offspring affected with schizophrenia. All subjects had DNA extracted from blood samples and were genotyped using the Illumina HumanOmni1-Quad BeadChip. DNA from blood samples was used to avoid potential problems with cell-line artifacts. While most markers in the SNP panel are polymorphic, this array includes monomorphic markers in regions with low variability. These monomorphic markers were added to the SNP panel, amounting to 8.0% of total markers primarily for CNV detection in regions with few polymorphic markers since the CNV calling algorithms make use of measures of DNA quantity in addition to zygosity.
Our initial analyses suggested the possibility of differential CNV call rates between parents versus offspring. After validating samples’ relationships using genome-wide SNP data and adjusting for batch effects and genomic wave [Diskin, et al. 2008], CNVs in this dataset were inferred using the PennCNV Joint-call mode. Panel A in Figure 1 shows the distribution of CNV calls as a function of CNV size, and suggests an excess of CNV calls in the offspring compared to the parents. This excess is restricted to CNV calls shorter than ~17 markers. We compared these results to those obtained from the PennCNV Individual-call mode, which does not take into account the relationship of the subjects. With this latter approach, there was no evidence for excess CNVs in the offspring relative to the parents (Figure 1-B). Thus the conclusion of total CNV burden in the offspring compared to the parents in this sample depends entirely on which call mode is used in analysis. Although one possible explanation is differences in power for detecting parent-offspring differences between the two call modes, these differences lead us to investigate the issue further.
Figure 1.
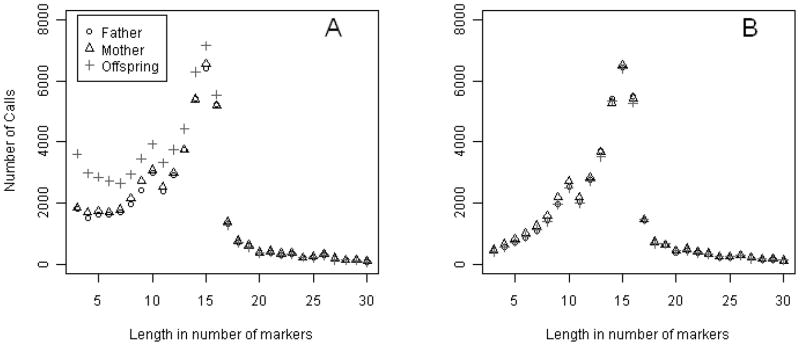
CNV calls in 95 trios from the PennCNV Joint-call (A) and PennCNV Individual-call (B) for Schizophrenia Data. PennCNV was set to call CNVs that were at least three markers long. The figure shows call rates for windows of 3 to 20 marker-long CNV calls, with longer calls not shown. Note that PennCNV truncates calls shorter than 3 markers by default.
METHODS AND RESULTS
JOINT-MODEL IN A TRIO
We start by outlining key elements of a Joint-model, to introduce notation, with a focus on the Joint-model of PennCNV [Wang, et al. 2008; Wang, et al. 2007]. We stress that this is a simplification that captures only the basic elements and does not perfectly describe more complicated specific implementations used in programs that make use of the Joint-model [Kosta, et al. 2007; Wang, et al. 2008; Wang, et al. 2007]. We denote “CNV-allele” to represent a copy number on a haplotype. We also denote the combination of CNV-alleles on a pair of autosomes by “CNV-state”. Let Z and z = (zf, zm, zo) denote a variable for a CNV state of a trio and its specification, respectively. Subscripts, f, m and o denote father, mother and offspring, respectively. Let r = (rf, rm, ro) denote the observed data measured for a SNP on a trio. For the Illumina panel, raw fluorescent measurements are often converted into Log-R-Ratio (LRR) and B-Allele-Frequency (BAF), which reflect total copy number and the proportion of one of the alleles in a total copy number state, respectively [Peiffer, et al. 2006]. Since LRRs and BAFs provide direct and indirect information about copy number, respectively, the LRR alone or with the BAF can be represented by r. Here, let “CNV-call” denote CNV-state estimates, Ẑ, from observed raw measurements, r. CNV-calling involves computation of the posterior probability, P(z|r), which is related to the emission probability, P(r|z), and the prior probability, P(z), as
| (1) |
From here on, we will refer to this model as the “Joint-model”. Model (1) represents either a model for a single marker, or for multiple markers. For multiple markers, a Hidden Markov Model (HMM) that models dependencies among markers provides another representation of model (1) with prior probability specified with the initial probability and the transmission probability. Then, CNV genotypes, given the obtained data, r, of a trio, can be estimated by maximizing the posterior probability (1) (i.e. Ẑ = argmaxzP(z|r)). The usual estimation in a HMM also attempts to find this same maximum.
DIFFERENTIAL BIAS FROM THE JOINT-MODEL
To discuss differential call rates from the Joint-model (1), we specify two components of the model: the emission probability, P(r|z), and the prior probability, P(z). We initially provide a simple model for ease of description. We consider a Joint-model for a single marker and then discuss the multi-marker model. We use only LRRs for r rather than using both of LRRs and BAFs. Lastly, we assume that a chromosome can have 1 or 2 copies; therefore, the true and inferred copy number states of an individual can be 2, 3 and 4, i.e., normal, 1 or 2 gains. Note that there is no uncertainty in chromosome-specific copy numbers under our assumption. None of the simplification above changes the validity of our argument below, which will be evaluated by using PennCNV in the subsequent section.
First, we code zi(i ∈{f, m, o}) as
The emission probability for three individuals in a trio can be written by assuming independence across individuals as:
We assume that each additional copy gained leads to the same amount of gains in the observed data (μ0 = 0, μ1 = μ, μ2 = 2μ)and that the three states have equal variances ( ), which we assume to be 1 (σ2= 1). Given this framework, the parameter μ, given fixed variance, represents the separation of underlying states and therefore the difficulty in inferring CNV genotypes. Under this assumption, the emission probability is
| (2) |
where φ(·) is the density function of the standard normal distribution.
The prior probability on the copy number state is P(z) = P(zf)P(zm)P(zo|zf, zm). To further specify this prior probability, let p denote the CNV-allele frequency in the population. Then, applying the Mendelian Inheritance model, the prior probability is given in Table I. Note that the prior probability models the random transmission property of Mendelian inheritance. For example, given parental state (1,0), the prior probabilities of the offspring’s two states are each 1/2. Now, this completes specification of two components: the emission probability and the prior probability. Note that this model does not consider de novo CNVs of offspring (z = (0,0,1)), which we will discuss later.
TABLE I.
Prior probability P(z). Fifteen possible states of z are given in 10 categories. The prior probabilities for 15 possible states, z are presented in 10 categories. The prior probability for each state is constructed using the Laws of Mendelian Inheritance. p denotes the CNV-allele frequency in the population. Note that we define z = (copy number − 2). The three states that we will discuss primarily are marked in bold.
| z
|
P(z) | |
|---|---|---|
| Parents | Offspring | |
|
| ||
| (0 0) | 0 | (1–p)4 |
|
| ||
| (1 0) or (0 1)* | 0 | p(1–p)3 |
| 1 | p(1–p)3 | |
|
| ||
| (1 1) | 0 | p2(1–p)2 |
| 1 | 2p2(1–p)2 | |
| 2 | p2(1–p)2 | |
|
| ||
| (2 0) or (0 2)* | 1 | p2(1–p)2 |
|
| ||
| (2 1) or (1 2)* | 1 | p3(1–p) |
| 2 | p3(1–p) | |
|
| ||
| (2 2) | 2 | p4 |
Each probability, P(z), represents only one of the two parents-offspring configurations.
Let us consider CNV calling using the Joint-model (1) specified above. We define bias in CNV calls between parents and offspring as the case when the method generates the unequal marginal means of Ẑ given the same true CNV states between a parent and offspring. The bias by this definition translates into non-zero statistical bias if we consider the difference in the average of CNV call rates in the parents and rates in the offspring as an estimator for the difference in the underlying CNV rates. The call rate for a joint state (zf, zm, zo) under a true state, zT is computed as the average emission probability over the area for which the maximum likelihood estimate is (zf, zm, zo). More formally under the true CNV state, zT, the call rate for a joint state (zf, zm, zo) is written as
where 1(·) denotes an indicator function. Thus,
| (3) |
where A(zf, zm, zo) = {r|(zf, zm, zo) = argmaxzP(z|r)}. Recall that the integrant which is the emission probability (2) follows a multivariate normal distribution. Then, the call rate for each family member of a marginal CNV state is written as the following, for example, for the father’s state, zf: P(Ẑf = zf|zT) = ∫A(zf)P(r|zT)dr, where A(zf) = Uzm,zo A(zf, zm, zo). Thus, the marginal mean is written as E(Ẑf|zT) = Σzfzf P(Ẑf = zf|zT) Similar expressions hold for the mother and the offspring. The marginal mean cannot be determined in closed form, which makes it impossible to analytically evaluate the bias. However, the unbiased CNV estimator between the two parents is shown by the symmetry in (3) between the two parents, which comes from the symmetries in P(r|z)and the integral region, or equivalently the two components of the Joint-model. The call rate (3) is not symmetrical between a parent-offspring pair. This implies possible bias between call rates for these two subjects.
There are different intuitions that predict an unbiased estimator from the Joint-model. For example, the first intuition focuses on the prior probabilities modeling equal transmission. Therefore, the intuition predicts no bias in call rates between parents and offspring by the inference that calls parents’ CNVs first, and then calls the offspring’s CNV conditional on the parents’ calls. However, because estimation for the Joint-model that we have discussed is carried out simultaneously for all parameters, this sequential inference is not applicable. Alternatively, a second source of intuition comes from the Joint-model having identical marginal distributions between any two individuals in a trio, similarly suggesting no differential call rates among trio members. The formal marginal distribution is . However, to get an unbiased CNV estimator, the joint distribution should be symmetrical, which is a stricter condition than having identical marginal distributions. Therefore, both these intuitions fail to take into account the more complicated joint estimation, and therefore do not correctly predict resulting differential call rates. For example, Table II illustrates the bias of an estimator for an asymmetric distribution. The joint distribution in the table has identical marginal distributions. Based on this property, one may expect that a joint estimator results in identical estimates for zo and zf (i.e. one of (0,0), (1,1) or (2,2)). However, this distribution has maximum joint probability at the point, (zo, zf) = (1, 0), which has different estimates between the two variables, zo and zf. This example shows that the joint estimation can have a potential bias between a parent and offspring. We will show the bias from the Joint-model between CNV calls in parents and offspring, which resembles this situation, by simulation in a subsequent section.
TABLE II.
Example of an asymmetric distribution. The marginal distributions are identical but the joint distribution has its maximum at (Zo, Zf) = (1, 0).
| Zf | |||||
|---|---|---|---|---|---|
| 0 | 1 | 2 | |||
| Zo | 0 | 0 | 0.1 | 0.2 | 0.3 |
| 1 | 0.3 | 0.1 | 0 | 0.4 | |
| 2 | 0 | 0.2 | 0.1 | 0.3 | |
|
| |||||
| 0.3 | 0.4 | 0.3 | 1 | ||
A bias in the CNV call rate that can subsequently lead to false association is illustrated with the following example. Let us consider a scenario where there is no true CNV in any member of a parent-child trio. Here, we consider only the following three groups of inferred CNV-genotype combinations of the trio: 1) no CNVs: z =(0,0,0); 2) inherited CNVs: z =(1,0,1), (0,1,1); and 3) non-inherited CNVs: z =(1,0,0), (0,1,0). These three group have by far the highest prior probabilities when the CNV allele frequency, p, is small. The source of false association introduced by including information from relatives is most easily understood by considering these three predominant types of calls. In this example, both CNV calls inferred as inherited and non-inherited are miscalls (Figure 2). Equal numbers of the two categories in the figure results in equal numbers of CNV calls in parents and offspring. That is, as long as the expected numbers of inherited and non-inherited miscalls are the same, neither bias nor spurious association will occur. Note that this case results in equal inferred frequencies of CNVs between sample populations of parents and offspring. However, if the miscall rates between the two categories differ, false association may result since then the CNV frequency in the parents’ population differs from that in the offspring’s population. This example will be further illustrated with simulated data.
Figure 2.

Illustration of two miscalls: inherited and non-inherited CNV calls.
DIFFERENTIAL CALL RATES IN SIMULATIONS
We investigate the bias with several simulated datasets in this section. In the first two subsections, we begin with the simple single-marker Joint-model described above, to avoid complications in inference that are added in multi-marker Joint-models. Following this step, the impact of the bias on analysis is considered with more realistic settings that include multi-marker data and a multi-marker model.
Differential Call Rates Given No True CNVs
The first simulation illustrates the existence of systematic difference from the Joint-model for a given set of parameter values. The dataset was composed of 1,000,000 replicates of a trio in the absence of CNVs by generating the “observed” LRR data for all individuals from a N(0, 1) distribution. For calling, we applied the Joint-model that was specified above with fixed parameters: difference μ = 1 and CNV-allele frequency p = 0.02. We used R 2.10 [R Development Core Team 2010] for generating data and computing posterior probabilities in these single-marker simulations. In this simulation, 524 inherited CNVs were called whereas 11 non-inherited CNVs were called, which confirms the differential call rates from the Joint-model (Figure 3). The figure illustrates relative values of the posterior probabilities for three categories of inferred genotypes: no CNV, inherited CNV and non-inherited CNV. Each point in Figure 3 represents a single trio with the associated posterior probability for the three genotypes. In the absence of bias, the points should be evenly distributed from the leftmost vertex (no CNVs) toward the other two vertexes (inherited and non-inherited CNVs). However, it is clear that given the prior distributions used in this example with their assumed parameter values, erroneous CNV calls are biased toward inherited CNVs, which in turn leads to preferential calling of CNVs in the offspring. To quantify the difference in CNV call rates, we define a Log-Call-Ratio, , where nf,nm and no are each the sum of the copy number gains in each of the father, mother and offspring, respectively. If there is no bias, this measure should be 0. Positive values imply an excess of CNVs called in offspring, and negative values imply an excess in the parents. Note that since no≤ nf+nm, this measure has a maximum of 1 for model (1). The estimated Log-Call-Ratio for the data was 0.983. We obtained 95% confidence interval of (0.978, 0.990) that was estimated empirically using a multinomial distribution of call rates.
Figure 3.

Posterior probabilities for the three types of CNV calls (no CNV, inherited CNVs, and non-inherited CNVs) from the simulated data with no true CNVs. A point in a particular enclosed area was called according to the associated vertex of the triangle. The numbers in each of the three partitions represent the number of points in the partition.
We also investigated how choice of different parameter values (i.e., difference, μ, and allele frequency, p) affects the call rate difference, in order to simulate various situations where the method may be applied. For each parameter combination (0.6 ≤ μ ≤ 2.0, 0.03 ≤ p ≤ 0.10), we generated 1,000,000 replicates of a new dataset in the absence of CNVs as described above instead of using a single dataset for all analyses in order to avoid the specificity in conclusions that could arise from using only a single dataset. Then, the Joint-model was used to infer CNV states for a particular assumed parameter values.
Figure 4 shows that in all scenarios, the Log-Call-Ratio deviates from 0. Further investigation with the estimated 95% confidence interval show this deviation is strongly significant (Supplementary Fig. 1). This confirms the systematic difference across different parameter values and simulations for the Joint-model. Under most scenarios, the Log-Call-Ratio is positive, which means that offspring have more CNV calls than parents. In a few scenarios, the Log-Call-Ratio is negative, in which an inheritance model theoretically would result in parents with more CNV calls than their offspring. Both cases of positive and negative bias could lead to an incorrect conclusion about the relative frequency and role of CNVs in disease. Figure 4 also shows that as both the difference between states, μ, and the allele-frequency, p, get smaller, the bias toward excess CNVs called in the offspring increases.
Figure 4.

Bias in CNV calls from various simulated scenarios. The two horizontal axes represent μ and p, and the vertical axis represents the Log-Call-Ratio defined in the text. The zero-plane where there is no bias is represented by a transparent plane.
Differential Call Rates in Unassociated CNVs
We also evaluated call rate differences from data simulated with true, but neutral CNVs that have no association with disease. We assume all offspring are affected and parents are unaffected. We constructed a single marker dataset of 4,000 trios that consisted of 1/2 inherited CNVs and 1/2 non-inherited CNVs and generated data by the Joint-model with μ = 1. The dataset simulates the situation where CNVs are not associated with the disease. CNVs were called by the model with μ = 1 and one of the two settings for p: (1) a low allele frequency p = 0.05 and (2) a high allele frequency, p = 0.50, and the Log-Call-Ratio was computed. From 1,000 replicate datasets for each setting, the estimated Log-Call-Ratio (95% empirical confidence interval) was 0.92 (0.88, 0.96), and −0.37 (−0.47, −0.27), for settings 1 and 2, respectively. The Log-Call-Ratio for both settings deviated significantly from 0, but in opposite directions. This demonstrates the relative excess in CNV calls in one generation vs. the other in the existence of unassociated CNVs, and also demonstrates that the direction of the effect is dependent on allele frequency.
Differential Call Rates from a Multi-Marker Joint-Model
We investigated whether the multi-marker Joint-model also introduces biased calls. A bias in real multi-marker data, if it exists, may take complex forms. For example, in the presence of a true inherited CNV, a parent may have a CNV call that is shorter than the real CNV whereas the offspring may have multiple short split CNV calls spanning a longer region, resulting in “more” CNV calls in the offspring than the parents. To evaluate the differential call rates in a multi-marker Joint-model, we used three modes of PennCNV which are based on a multi-marker Joint-model to different degrees: the Joint-call that is based fully on the Joint-model; the Posterior-call that partly uses the Joint-model; and the Individual-call that only uses the Individual-model. Any difference in distribution of CNV calls under true no-CNV scenarios provides evidence for the bias from the multi-marker Joint-model. To avoid confusion, we remind the readers that in this paper, the terminology “mode” refers to an option in PennCNV that is an implementation based on one (or two, for the Posterior-call mode) underlying “model”.
We simulated data in order to investigate the differential call rates from PennCNV used in the multi-marker model. A single replicate with one hundred trios’ LRR and BAF data was simulated for the HumanOmni1-Quad BeadChip under the scenario of no true CNVs as follows. First, SNP genotypes (i.e. 0, 1 or 2) in parents were generated using SNP allele frequencies of markers from a single human chromosome (chromosome 11, chosen arbitrarily) ignoring linkage disequilibrium between markers. Given parents’ genotypes, SNP genotypes for the offspring were generated using Mendelian inheritance. Then, LRRs were generated from a N(0,σ12) distribution regardless of SNP genotypes. BAFs given SNP genotype, s, were generated using a truncated normal distribution, within the range of (0,1). We set both parameters, Σ1and Σ2 to 0.15 based on observations from the real schizophrenia data in the motivating example. Given the simulated data, the PennCNV Joint-call, Posterior-call and Individual-call modes were used for inferring CNVs.
Both the Joint-call and Posterior-call modes resulted in differential CNV calls between parents and offspring (Figure 5). The figure also shows quite different results for CNV calls among the three modes, especially for short calls. For the Joint-call mode, the offspring had more CNVs called that are shorter than ~8 markers, while the parents had more CNVs called that are longer than ~8 markers (Figure 5-A). These short CNV calls account for 74.1% of the total CNV calls. The Posterior-call mode introduced a slight excess of CNV calls in the parents (Figure 5-B). Note that two modes used for the same data resulted in opposite directions of differential call rates. In contrast to the difference seen with the Joint-call and Posterior-call, the Individual-call showed no difference in the CNV call rates between parents and offspring (Figure 5-C).
Figure 5.

Analysis of simulated multi-marker data in the absence of true CNVs with the PennCNV Joint-call (Panel A), Posterior-call (Panel B) and Individual-call (Panel C), for windows of 3–15 markers.
The PennCNV Joint-call and Posterior-call modes include a component for allowing de novo CNVs in offspring along with the Joint-model, which does not allow de novo CNVs by itself [Wang, et al. 2008]. We investigated the possibility that this component is responsible for the excess of CNV calls in the offspring rather than the Joint-model. We found that there is a small fraction of de novo calls (at most, 0.7–10.1%) among total CNV calls of size less than 8 markers in offspring. This number can explain only small fraction of excess CNVs. Therefore, we can exclude the de novo calls as the main source of different call rates between parents and offspring.
DIFFERENTIAL CALL RATES IN REAL DATA
Two real datasets were considered to illustrate the different properties of the calling modes. The first one is our motivating dataset: the sample of trios with an offspring with schizophrenia. We previously demonstrated that CNVs in this dataset were inferred with different frequencies between parents and offspring with the Joint-call mode (Figure 1). Among all calls in the offspring, only 9.4% were de novo CNV calls, whereas 90.6% were inherited CNV calls. Therefore, excess calls in offspring are explained mainly by the Joint-model, because the offspring would still have an excess calls even without the de novo calls (Supplementary Fig. 2). The Posterior-call mode introduced a small excess of overall CNV calls in the parents, just as we observed with the multi-marker simulated data (Supplementary Fig. 3). In addition, Figure 1 shows that the rate of increase of CNV calls as a function of the number of markers was more rapid up to the maximum of 16 markers than it was in the simulated data. We further investigated this pattern and found that by eliminating monomorphic markers, the call rates then decreased monotonically with the number of markers (Supplementary Fig. 4).
The results obtained on the schizophrenia sample with the two calling modes are consistent with the biases we identified previously. The pattern of excess CNVs in the parents versus offspring and the difference seen between the two calling modes match those in the simulated data with the same calling modes. However, this dataset could still have true differential CNV calls between parents and offspring because of true association with schizophrenia, so that interpretation of the results in this setting can be problematic.
We therefore also examined a second real dataset: the HapMap CEU trios [Frazer, et al. 2007]. Since these data are not sampled through trait status, there is no expectation of a differential CNV rate in parents versus offspring. From the HapMap website (http://hapmap.ncbi.nlm.nih.gov) we downloaded genotypes as obtained from the Affymetrix 500K GeneChip for 30 HapMap CEU trios. Again, after adjusting for batch effects and genomic wave, CNVs were inferred using the three modes in the PennCNV as we did for the schizophrenia and multi-marker simulated datasets. Similar to the results obtained for both the simulated data and the real schizophrenia data, we observed the same excess of CNV calls in the offspring in the HapMap sample for segments that were shorter than 10 markers long when we used the Joint-call mode for CNV calling, but not from the Individual-call mode (Figure 6). Similar to the schizophrenia dataset, the de novo call rate in offspring was only 2.6%, so again the excess calls are mainly explained by the Joint-model. However, this time, the Posterior-call mode did not result in a significant call rate difference (Supplementary Fig. 5). Since PennCNV was originally developed for the Illumina panel, it applies a slightly different algorithm for the Affymetrix 500K panel. Therefore, differences in results for the HapMap data from the Posterior-call may be partly explained by different algorithms, marker sets or sample sizes.
Figure 6.
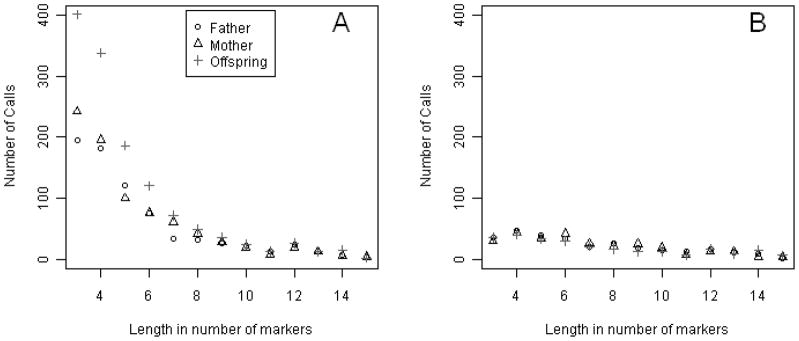
PennCNV Joint-call (A) and Individual-call (B) of the HapMap CEU trios for windows of 3–11 markers.
DISCUSSION
We have shown that CNV inference based on the Joint-model, which includes information about Mendelian inheritance, can introduce a differential bias in CNV calls between parents and offspring. We considered the bias theoretically and showed its effect in both simulated and real datasets. The analytical results show that CNV calling with the Joint-model is expected to introduce a bias because of the asymmetry of estimators for CNVs in parents versus offspring. The bias was confirmed with conceptual single-marker simulation both in the absence of CNVs and in the presence of CNVs that were not associated with disease. The biases were seen in both directions depending on settings. The bias from the calling model is unique and separate from other reported biases from biological artifacts such as DNA quantities, DNA extraction methods, DNA sources and array batch [Craddock, et al. 2010b; Scharpf, et al. 2011].
We conclude that observed differences in our original motivating example between parents and offspring from use of the PennCNV Joint-call or Posterior-call are consistent with the bias from the Joint-model. The two modes of PennCNV resulted in different call rates, more obviously in short calls, between parents and offspring in one simulated dataset and two real datasets. The severity of the differences from the two modes corresponds to the degree to which the two modes rely on the Joint-model. Both directions of differential call rates by PennCNV were shown, which is consistent with the results by our simple model. We also excluded the possibility that the de novo CNV component of the PennCNV is responsible for the differential call rates. It should be noted that the differential call rates are not only the results of use of compromises in implementations of PennCNV, but are intrinsic components of the Joint-model. Therefore, the bias should apply to any calling method using a similar Joint-model, e.g., [Kosta, et al. 2007].
The bias from the Joint-model can affect conclusions in disease association studies. In particular, studies that compare global CNV burden between parents and offspring are the most vulnerable to this bias since conclusions about association depend only on CNV calls without, typically, further direct independent molecular validation. In addition, testing of associations will need to be carried out in a fashion that accommodates this bias, which may require developing new methods for within family testing. We note that the bias could also affect studies where CNV calling is followed by direct validation because in this case only called samples and regions, which already could be biased, are further investigated by a direct method, creating an ascertainment problem.
To our knowledge, it has not previously been recognized that use of a Mendelian inheritance model can introduce bias in parent versus offspring CNV call rates in the context of CNV detection. Previous studies that have used the Joint-model have not paid attention to this possible bias in their association tests [Bae, et al. 2010; Yang, et al. 2009]. Our results here show that none of possible intuitive predictions for relative CNV call rates in parents versus offspring is always correct. One intuitive prediction would be that the transmission equilibrium model in prior probability or equal marginal distributions implies unbiased CNV calls, both of which we show are incorrect. The second is that the potentially increased sensitivity of the Joint-model should lead to more calls in the offspring, which also is not always the case. In any case, considering published studies which do not take this bias into account, it is apparent that the bias has not been either discussed or recognized among practitioners [Bae, et al. 2010; Yang, et al. 2009].
In conclusion, our results documenting the CNV calling bias suggest that the Joint-model should be used with caution. The Joint-model may still be preferred to the Individual-model for the purpose of enhancing CNV detection sensitivity or smoothing call boundaries. Correction for the bias in order to more widely use the Joint-model is not straightforward, and thus is deferred for future work. Therefore, our findings raise concerns about the Joint-model’s current role in association tests in two different situations. First, our results suggest that CNV calls in affected offspring from the Joint-model should not be compared with such calls in their parents. Second, we also note that CNV calls of affected offspring based on the Joint-model should not be compared with CNV calls in unrelated controls with their CNV calls based on the Individual-model as has sometimes been done [Bucan, et al. 2009; Pinto, et al. 2010]. This follows because use of different algorithms also introduces inhomogeneous results, as we showed them in our study. A situation where this might occur would involve using an existing database of called CNVs in controls as a reference data set. Further work must focus on finding a standard method for family-based CNV study while recognizing the possible bias from the Joint-model.
Supplementary Material
Acknowledgments
Supported by NIH: R01MH065558 and R01MH065554; the US Department of Veterans Affairs, Office of Research Development Biomedical Laboratory Research: Merit Review; and VISN-20 MIRECC. We thank Jeremy Silverman and Larry Siever for contributing schizophrenia trios, and the NIMH Genetics Initiative on schizophrenia for providing DNA sample. The funding agencies did not play a role in study design, data collection and analysis, decision to publish, or preparation of the manuscript.
References
- Bae JS, Cheong HS, Chun JY, Park TJ, Kim JO, Kim EM, Park M, Kim DJ, Lee EJ, Kim EK, Lee JY, Shin HD. Identification of Genome-wide Copy Number Variations and a Family-based Association Study of Avellino Corneal Dystrophy. Ophthalmology. 2010;117(7):1306–1312. doi: 10.1016/j.ophtha.2009.11.021. [DOI] [PubMed] [Google Scholar]
- Bucan M, Abrahams BS, Wang K, Glessner JT, Herman EI, Sonnenblick LI, Retuerto AIA, Imielinski M, Hadley D, Bradfield JP, Kim C, Gidaya NB, Lindquist I, Hutman T, Sigman M, Kustanovich V, Lajonchere CM, Singleton A, Kim J, Wassink TH, McMahon WM, Owley T, Sweeney JA, Coon H, Nurnberger JI, Li MY, Cantor RM, Minshew NJ, Sutcliffe JS, Cook EH, Dawson G, Buxbaum JD, Grant SFA, Schellenberg GD, Geschwind DH, Hakonarson H. Genome-Wide Analyses of Exonic Copy Number Variants in a Family-Based Study Point to Novel Autism Susceptibility Genes. PLoS Genetics. 2009;5(6):e1000536. doi: 10.1371/journal.pgen.1000536. [DOI] [PMC free article] [PubMed] [Google Scholar]
- Carter NP. Methods and strategies for analyzing copy number variation using DNA microarrays. Nature Genetics. 2007;39:S16–S21. doi: 10.1038/ng2028. [DOI] [PMC free article] [PubMed] [Google Scholar]
- Craddock N, Grozeva D, Kirov G, Ivanov D, Jones IR, Jones L, Green EK, St Clair DM, Young AH, Ferrier N, Farmer AE, McGuffin P, Holmans PA, Owen MJ, O’Donovan MC, Control WTC. Rare Copy Number Variants A Point of Rarity in Genetic Risk for Bipolar Disorder and Schizophrenia. Archives of General Psychiatry. 2010a;67(4):318–327. doi: 10.1001/archgenpsychiatry.2010.25. [DOI] [PMC free article] [PubMed] [Google Scholar]
- Craddock N, Hurles ME, Cardin N, Pearson RD, Plagnol V, Robson S, Vukcevic D, Barnes C, Conrad DF, Giannoulatou E, Holmes C, Marchini JL, Stirrups K, Tobin MD, Wain LV, Yau C, Aerts J, Ahmad T, Andrews TD, Arbury H, Attwood A, Auton A, Ball SG, Balmforth AJ, Barrett JC, Barroso I, Barton A, Bennett AJ, Bhaskar S, Blaszczyk K, Bowes J, Brand OJ, Braund PS, Bredin F, Breen G, Brown MJ, Bruce IN, Bull J, Burren OS, Burton J, Byrnes J, Caesar S, Clee CM, Coffey AJ, Connell JMC, Cooper JD, Dominiczak AF, Downes K, Drummond HE, Dudakia D, Dunham A, Ebbs B, Eccles D, Edkins S, Edwards C, Elliot A, Emery P, Evans DM, Evans G, Eyre S, Farmer A, Ferrier IN, Feuk L, Fitzgerald T, Flynn E, Forbes A, Forty L, Franklyn JA, Freathy RM, Gibbs P, Gilbert P, Gokumen O, Gordon-Smith K, Gray E, Green E, Groves CJ, Grozeva D, Gwilliam R, Hall A, Hammond N, Hardy M, Harrison P, Hassanali N, Hebaishi H, Hines S, Hinks A, Hitman GA, Hocking L, Howard E, Howard P, Howson JMM, Hughes D, Hunt S, Isaacs JD, Jain M, Jewell DP, Johnson T, Jolley JD, Jones IR, Jones LA, Kirov G, Langford CF, Lango-Allen H, Lathrop GM, Lee J, Lee KL, Lees C, Lewis K, Lindgren CM, Maisuria-Armer M, Maller J, Mansfield J, Martin P, Massey DCO, McArdle WL, McGuffin P, McLay KE, Mentzer A, Mimmack ML, Morgan AE, Morris AP, Mowat C, Myers S, Newman W, Nimmo ER, O’Donovan MC, Onipinla A, Onyiah I, Ovington NR, Owen MJ, Palin K, Parnell K, Pernet D, Perry JRB, Phillips A, Pinto D, Prescott NJ, Prokopenko I, Quail MA, Rafelt S, Rayner NW, Redon R, Reid DM, Renwick A, Ring SM, Robertson N, Russell E, St Clair D, Sambrook JG, Sanderson JD, Schuilenburg H, Scott CE, Scott R, Seal S, Shaw-Hawkins S, Shields BM, Simmonds MJ, Smyth DJ, Somaskantharajah E, Spanova K, Steer S, Stephens J, Stevens HE, Stone MA, Su Z, Symmons DPM, Thompson JR, Thomson W, Travers ME, Turnbull C, Valsesia A, Walker M, Walker NM, Wallace C, Warren-Perry M, Watkins NA, Webster J, Weedon MN, Wilson AG, Woodburn M, Wordsworth BP, Young AH, Zeggini E, Carter NP, Frayling TM, Lee C, McVean G, Munroe PB, Palotie A, Sawcer SJ, Scherer SW, Strachan DP, Tyler-Smith C, Brown MA, Burton PR, Caulfield MJ, Compston A, Farrall M, Gough SCL, Hall AS, Hattersley AT, Hill AVS, Mathew CG, Pembrey M, Satsangi J, Stratton MR, Worthington J, Deloukas P, Duncanson A, Kwiatkowski DP, McCarthy MI, Ouwehand WH, Parkes M, Rahman N, Todd JA, Samani NJ, Donnelly P. Genome-wide association study of CNVs in 16,000 cases of eight common diseases and 3,000 shared controls. Nature. 2010b;464(7289):713–720. doi: 10.1038/nature08979. [DOI] [PMC free article] [PubMed] [Google Scholar]
- Diskin SJ, Li MY, Hou CP, Yang SZ, Glessner J, Hakonarson H, Bucan M, Maris JM, Wang K. Adjustment of genomic waves in signal intensities from whole-genome SNP genotyping platforms. Nucleic Acids Research. 2008;36(19):e126. doi: 10.1093/nar/gkn556. [DOI] [PMC free article] [PubMed] [Google Scholar]
- Eckel-Passow JE, Atkinson EJ, Maharjan S, Kardia SLR, de Andrade M. Software comparison for evaluating genomic copy number variation for Affymetrix 6.0 SNP array platform. BMC Bioinformatics. 2011;12:220. doi: 10.1186/1471-2105-12-220. [DOI] [PMC free article] [PubMed] [Google Scholar]
- Frazer KA, Ballinger DG, Cox DR, Hinds DA, Stuve LL, Gibbs RA, Belmont JW, Boudreau A, Hardenbol P, Leal SM, Pasternak S, Wheeler DA, Willis TD, Yu FL, Yang HM, Zeng CQ, Gao Y, Hu HR, Hu WT, Li CH, Lin W, Liu SQ, Pan H, Tang XL, Wang J, Wang W, Yu J, Zhang B, Zhang QR, Zhao HB, Zhao H, Zhou J, Gabriel SB, Barry R, Blumenstiel B, Camargo A, Defelice M, Faggart M, Goyette M, Gupta S, Moore J, Nguyen H, Onofrio RC, Parkin M, Roy J, Stahl E, Winchester E, Ziaugra L, Altshuler D, Shen Y, Yao ZJ, Huang W, Chu X, He YG, Jin L, Liu YF, Shen YY, Sun WW, Wang HF, Wang Y, Xiong XY, Xu L, Waye MMY, Tsui SKW, Wong JTF, Galver LM, Fan JB, Gunderson K, Murray SS, Oliphant AR, Chee MS, Montpetit A, Chagnon F, Ferretti V, Leboeuf M, Olivier JF, Phillips MS, Roumy S, Sallee C, Verner A, Hudson TJ, Kwok PY, Cai DM, Koboldt DC, Miller RD, Pawlikowska L, Taillon-Miller P, Xiao M, Tsui LC, Mak W, Song YQ, Tam PKH, Nakamura Y, Kawaguchi T, Kitamoto T, Morizono T, Nagashima A, Ohnishi Y, Sekine A, Tanaka T, Tsunoda T, Deloukas P, Bird CP, Delgado M, Dermitzakis ET, Gwilliam R, Hunt S, Morrison J, Powell D, Stranger BE, Whittaker P, Bentley DR, Daly MJ, de Bakker PIW, Barrett J, Chretien YR, Maller J, McCarroll S, Patterson N, Pe’er I, Price A, Purcell S, Richter DJ, Sabeti P, Saxena R, Schaffner SF, Sham PC, Varilly P, Stein LD, Krishnan L, Smith AV, Tello-Ruiz MK, Thorisson GA, Chakravarti A, Chen PE, Cutler DJ, Kashuk CS, Lin S, Abecasis GR, Guan WH, Li Y, Munro HM, Qin ZHS, Thomas DJ, McVean G, Auton A, Bottolo L, Cardin N, Eyheramendy S, Freeman C, Marchini J, Myers S, Spencer C, Stephens M, Donnelly P, Cardon LR, Clarke G, Evans DM, Morris AP, Weir BS, Johnson TA, Mullikin JC, Sherry ST, Feolo M, Skol A, Int HapMap C. A second generation human haplotype map of over 3.1 million SNPs. Nature. 2007;449(7164):851–856. doi: 10.1038/nature06258. [DOI] [PMC free article] [PubMed] [Google Scholar]
- Glessner JT, Wang K, Cai GQ, Korvatska O, Kim CE, Wood S, Zhang HT, Estes A, Brune CW, Bradfield JP, Imielinski M, Frackelton EC, Reichert J, Crawford EL, Munson J, Sleiman PMA, Chiavacci R, Annaiah K, Thomas K, Hou CP, Glaberson W, Flory J, Otieno F, Garris M, Soorya L, Klei L, Piven J, Meyer KJ, Anagnostou E, Sakurai T, Game RM, Rudd DS, Zurawiecki D, McDougle CJ, Davis LK, Miller J, Posey DJ, Michaels S, Kolevzon A, Silverman JM, Bernier R, Levy SE, Schultz RT, Dawson G, Owley T, McMahon WM, Wassink TH, Sweeney JA, Nurnberger JI, Coon H, Sutcliffe JS, Minshew NJ, Grant SFA, Bucan M, Cook EH, Buxbaum JD, Devlin B, Schellenberg GD, Hakonarson H. Autism genome-wide copy number variation reveals ubiquitin and neuronal genes. Nature. 2009;459(7246):569–573. doi: 10.1038/nature07953. [DOI] [PMC free article] [PubMed] [Google Scholar]
- Kohler JR, Cutler DJ. Simultaneous discovery and testing of deletions for disease association in SNP genotyping studies. American Journal of Human Genetics. 2007;81(4):684–699. doi: 10.1086/520823. [DOI] [PMC free article] [PubMed] [Google Scholar]
- Korbel JO, Urban AE, Affourtit JP, Godwin B, Grubert F, Simons JF, Kim PM, Palejev D, Carriero NJ, Du L, Taillon BE, Chen ZT, Tanzer A, Saunders ACE, Chi JX, Yang FT, Carter NP, Hurles ME, Weissman SM, Harkins TT, Gerstein MB, Egholm M, Snyder M. Paired-end mapping reveals extensive structural variation in the human genome. Science. 2007;318(5849):420–426. doi: 10.1126/science.1149504. [DOI] [PMC free article] [PubMed] [Google Scholar]
- Kosta K, Sabroe I, Goke J, Nibbs RJ, Tsanakas J, Whyte MK, Teare MD. A Bayesian approach to copy-number-polymorphism analysis in nuclear pedigrees. American Journal of Human Genetics. 2007;81(4):808–812. doi: 10.1086/520096. [DOI] [PMC free article] [PubMed] [Google Scholar]
- Marenne G, Rodriguez-Santiago B, Closas MG, Perez-Jurado L, Rothman N, Rico D, Pita G, Pisano DG, Kogevinas M, Silverman DT, Valencia A, Real FX, Chanock SJ, Genin E, Malats N. Assessment of Copy Number Variation Using the Illumina Infinium 1M SNP-Array: A Comparison of Methodological Approaches in the Spanish Bladder Cancer/EPICURO Study. Human Mutation. 2011;32(2):240–248. doi: 10.1002/humu.21398. [DOI] [PMC free article] [PubMed] [Google Scholar]
- Marioni JC, White M, Tavare S, Lynch AG. Hidden copy number variation in the HapMap population. Proceedings of the National Academy of Sciences of the United States of America. 2008;105(29):10067–10072. doi: 10.1073/pnas.0711252105. [DOI] [PMC free article] [PubMed] [Google Scholar]
- Morozova O, Marra MA. From cytogenetics to next-generation sequencing technologies: advances in the detection of genome rearrangements in tumors. Biochemistry and Cell Biology-Biochimie Et Biologie Cellulaire. 2008;86(2):81–91. doi: 10.1139/O08-003. [DOI] [PubMed] [Google Scholar]
- Morrow EM. Genomic Copy Number Variation in Disorders of Cognitive Development. Journal of the American Academy of Child and Adolescent Psychiatry. 2010;49(11):1091–1104. doi: 10.1016/j.jaac.2010.08.009. [DOI] [PMC free article] [PubMed] [Google Scholar]
- Pamphlett R, Morahan JM, Yu B. Using case-parent trios to look for rare de novo genetic variants in adult-onset neurodegenerative diseases. Journal of Neuroscience Methods. 2011;197(2):297–301. doi: 10.1016/j.jneumeth.2011.02.028. [DOI] [PubMed] [Google Scholar]
- Peiffer DA, Le JM, Steemers FJ, Chang WH, Jenniges T, Garcia F, Haden K, Li JZ, Shaw CA, Belmont J, Cheung SW, Shen RM, Barker DL, Gunderson KL. High-resolution genomic profiling of chromosomal aberrations using Infinium whole-genome genotyping. Genome Research. 2006;16(9):1136–1148. doi: 10.1101/gr.5402306. [DOI] [PMC free article] [PubMed] [Google Scholar]
- Pinto D, Darvishi K, Shi XH, Rajan D, Rigler D, Fitzgerald T, Lionel AC, Thiruvahindrapuram B, MacDonald JR, Mills R, Prasad A, Noonan K, Gribble S, Prigmore E, Donahoe PK, Smith RS, Park JH, Hurles ME, Carter NP, Lee C, Scherer SW, Feuk L. Comprehensive assessment of array-based platforms and calling algorithms for detection of copy number variants. Nature biotechnology. 2011;29(6):512–520. doi: 10.1038/nbt.1852. [DOI] [PMC free article] [PubMed] [Google Scholar]
- Pinto D, Pagnamenta AT, Klei L, Anney R, Merico D, Regan R, Conroy J, Magalhaes TR, Correia C, Abrahams BS, Almeida J, Bacchelli E, Bader GD, Bailey AJ, Baird G, Battaglia A, Berney T, Bolshakova N, Bolte S, Bolton PF, Bourgeron T, Brennan S, Brian J, Bryson SE, Carson AR, Casallo G, Casey J, Chung BHY, Cochrane L, Corsello C, Crawford EL, Crossett A, Cytrynbaum C, Dawson G, de Jonge M, Delorme R, Drmic I, Duketis E, Duque F, Estes A, Farrar P, Fernandez BA, Folstein SE, Fombonne E, Freitag CM, Gilbert J, Gillberg C, Glessner JT, Goldberg J, Green A, Green J, Guter SJ, Hakonarson H, Heron EA, Hill M, Holt R, Howe JL, Hughes G, Hus V, Igliozzi R, Kim C, Klauck SM, Kolevzon A, Korvatska O, Kustanovich V, Lajonchere CM, Lamb JA, Laskawiec M, Leboyer M, Le Couteur A, Leventhal BL, Lionel AC, Liu XQ, Lord C, Lotspeich L, Lund SC, Maestrini E, Mahoney W, Mantoulan C, Marshall CR, McConachie H, McDougle CJ, McGrath J, McMahon WM, Merikangas A, Migita O, Minshew NJ, Mirza GK, Munson J, Nelson SF, Noakes C, Noor A, Nygren G, Oliveira G, Papanikolaou K, Parr JR, Parrini B, Paton T, Pickles A, Pilorge M, Piven J, Ponting CP, Posey DJ, Poustka A, Poustka F, Prasad A, Ragoussis J, Renshaw K, Rickaby J, Roberts W, Roeder K, Roge B, Rutter ML, Bierut LJ, Rice JP, Salt J, Sansom K, Sato D, Segurado R, Sequeira AF, Senman L, Shah N, Sheffield VC, Soorya L, Sousa I, Stein O, Sykes N, Stoppioni V, Strawbridge C, Tancredi R, Tansey K, Thiruvahindrapduram B, Thompson AP, Thomson S, Tryfon A, Tsiantis J, Van Engeland H, Vincent JB, Volkmar F, Wallace S, Wang K, Wang ZZ, Wassink TH, Webber C, Weksberg R, Wing K, Wittemeyer K, Wood S, Wu J, Yaspan BL, Zurawiecki D, Zwaigenbaum L, Buxbaum JD, Cantor RM, Cook EH, Coon H, Cuccaro ML, Devlin B, Ennis S, Gallagher L, Geschwind DH, Gill M, Haines JL, Hallmayer J, Miller J, Monaco AP, Nurnberger JI, Paterson AD, Pericak-Vance MA, Schellenberg GD, Szatmari P, Vicente AM, Vieland VJ, Wijsman EM, Scherer SW, Sutcliffe JS, Betancur C. Functional impact of global rare copy number variation in autism spectrum disorders. Nature. 2010;466(7304):368–372. doi: 10.1038/nature09146. [DOI] [PMC free article] [PubMed] [Google Scholar]
- R Development Core Team. R: A language and environment for statistical computing. Vienna, Austria: 2010. [Google Scholar]
- Salyakina D, Cukier HN, Lee JM, Sacharow S, Nations LD, Ma DQ, Jaworski JM, Konidari I, Whitehead PL, Wright HH, Abramson RK, Williams SM, Menon R, Haines JL, Gilbert JR, Cuccaro ML, Pericak-Vance MA. Copy Number Variants in Extended Autism Spectrum Disorder Families Reveal Candidates Potentially Involved in Autism Risk. Plos One. 2011;6(10):e26049. doi: 10.1371/journal.pone.0026049. [DOI] [PMC free article] [PubMed] [Google Scholar]
- Scharpf RB, Ruczinski I, Carvalho B, Doan B, Chakravarti A, Irizarry RA. A multilevel model to address batch effects in copy number estimation using SNP arrays. Biostatistics. 2011;12(1):33–50. doi: 10.1093/biostatistics/kxq043. [DOI] [PMC free article] [PubMed] [Google Scholar]
- Sebat J, Lakshmi B, Malhotra D, Troge J, Lese-Martin C, Walsh T, Yamrom B, Yoon S, Krasnitz A, Kendall J, Leotta A, Pai D, Zhang R, Lee YH, Hicks J, Spence SJ, Lee AT, Puura K, Lehtimaki T, Ledbetter D, Gregersen PK, Bregman J, Sutcliffe JS, Jobanputra V, Chung W, Warburton D, King MC, Skuse D, Geschwind DH, Gilliam TC, Ye K, Wigler M. Strong association of de novo copy number mutations with autism. Science. 2007;316(5823):445–449. doi: 10.1126/science.1138659. [DOI] [PMC free article] [PubMed] [Google Scholar]
- Stefansson H, Rujescu D, Cichon S, Pietilainen OPH, Ingason A, Steinberg S, Fossdal R, Sigurdsson E, Sigmundsson T, Buizer-Voskamp JE, Hansen T, Jakobsen KD, Muglia P, Francks C, Matthews PM, Gylfason A, Halldorsson BV, Gudbjartsson D, Thorgeirsson TE, Sigurdsson A, Jonasdottir A, Jonasdottir A, Bjornsson A, Mattiasdottir S, Blondal T, Haraldsson M, Magnusdottir BB, Giegling I, Moller HJ, Hartmann A, Shianna KV, Ge DL, Need AC, Crombie C, Fraser G, Walker N, Lonnqvist J, Suvisaari J, Tuulio-Henriksson A, Paunio T, Toulopoulou T, Bramon E, Di Forti M, Murray R, Ruggeri M, Vassos E, Tosato S, Walshe M, Li T, Vasilescu C, Muhleisen TW, Wang AG, Ullum H, Djurovic S, Melle I, Olesen J, Kiemeney LA, Franke B, Sabatti C, Freimer NB, Gulcher JR, Thorsteinsdottir U, Kong A, Andreassen OA, Ophoff RA, Georgi A, Rietschel M, Werge T, Petursson H, Goldstein DB, Nothen MM, Peltonen L, Collier DA, St Clair D, Stefansson K. Large recurrent microdeletions associated with schizophrenia. Nature. 2008;455(7210):232–236. doi: 10.1038/nature07229. [DOI] [PMC free article] [PubMed] [Google Scholar]
- Stone JL, O’Donovan MC, Gurling H, Kirov GK, Blackwood DHR, Corvin A, Craddock NJ, Gill M, Hultman CM, Lichtenstein P, McQuillin A, Pato CN, Ruderfer DM, Owen MJ, St Clair D, Sullivan PF, Sklar P, Purcell SM, Scolnick EM, Holmans PA, Georgieva L, Nikolov I, Norton N, Williams H, Williams NM, Toncheva D, Milanova V, Thelander EF, Morris DW, O’Dushlaine CT, Kenny E, Waddington JL, Choudhury K, Datta S, Pimm J, Thirumalai S, Puri V, Krasucki R, Lawrence J, Quested D, Bass N, Curtis D, Crombie C, Fraser G, Kwan SL, Muir WJ, McGhee KA, Pickard B, Malloy P, Maclean AW, Van Beck M, Visscher PM, Macgregor S, Pato MT, Medeiros H, Middleton F, Carvalho C, Morley C, Fanous A, Conti D, Knowles JA, Ferreira CP, Azevedo MH, McCarroll SA, Gates C, Daly MJ, Sklar P. Rare chromosomal deletions and duplications increase risk of schizophrenia. Nature. 2008;455(7210):237–241. doi: 10.1038/nature07239. [DOI] [PMC free article] [PubMed] [Google Scholar]
- Tsuang DW, Millard SP, Ely B, Chi P, Wang KN, Raskind WH, Kim S, Brkanac Z, Yu CE. The Effect of Algorithms on Copy Number Variant Detection. Plos One. 2010;5(12):e14456. doi: 10.1371/journal.pone.0014456. [DOI] [PMC free article] [PubMed] [Google Scholar]
- Walsh T, McClellan JM, McCarthy SE, Addington AM, Pierce SB, Cooper GM, Nord AS, Kusenda M, Malhotra D, Bhandari A, Stray SM, Rippey CF, Roccanova P, Makarov V, Lakshmi B, Findling RL, Sikich L, Stromberg T, Merriman B, Gogtay N, Butler P, Eckstrand K, Noory L, Gochman P, Long R, Chen ZG, Davis S, Baker C, Eichler EE, Meltzer PS, Nelson SF, Singleton AB, Lee MK, Rapoport JL, King MC, Sebat J. Rare structural variants disrupt multiple genes in neurodevelopmental pathways in schizophrenia. Science. 2008;320(5875):539–543. doi: 10.1126/science.1155174. [DOI] [PubMed] [Google Scholar]
- Wang K, Chen Z, Tadesse MG, Glessner J, Grant SFA, Hakonarson H, Bucan M, Li MY. Modeling genetic inheritance of copy number variations. Nucleic Acids Research. 2008;36(21):e138. doi: 10.1093/nar/gkn641. [DOI] [PMC free article] [PubMed] [Google Scholar]
- Wang K, Li M, Hadley D, Liu R, Glessner J, Grant SF, Hakonarson H, Bucan M. PennCNV: an integrated hidden Markov model designed for high-resolution copy number variation detection in whole-genome SNP genotyping data. Genome Res. 2007;17(11):1665–74. doi: 10.1101/gr.6861907. [DOI] [PMC free article] [PubMed] [Google Scholar]
- Winchester L, Yau C, Ragoussis J. Comparing CNV detection methods for SNP arrays. Brief Funct Genomic Proteomic. 2009;8(5):353–66. doi: 10.1093/bfgp/elp017. [DOI] [PubMed] [Google Scholar]
- Wineinger NE, Kennedy RE, Erickson SW, Wojczynski MK, Bruder CE, Tiwari HK. Statistical issues in the analysis of DNA Copy Number Variations. Int J Comput Biol Drug Des. 2008;1(4):368–95. doi: 10.1504/IJCBDD.2008.022208. [DOI] [PMC free article] [PubMed] [Google Scholar]
- Xu B, Roos JL, Levy S, Van Rensburg EJ, Gogos JA, Karayiorgou M. Strong association of de novo copy number mutations with sporadic schizophrenia. Nature Genetics. 2008;40(7):880–885. doi: 10.1038/ng.162. [DOI] [PubMed] [Google Scholar]
- Yang SZ, Wang K, Gregory B, Berrettini W, Wang LS, Hakonarson H, Bucan M. Genomic Landscape of a Three-Generation Pedigree Segregating Affective Disorder. Plos One. 2009;4(2):e4474. doi: 10.1371/journal.pone.0004474. [DOI] [PMC free article] [PubMed] [Google Scholar]
- Zhang D, Cheng L, Qian Y, Alliey-Rodriguez N, Kelsoe JR, Greenwood T, Nievergelt C, Barrett TB, McKinney R, Schork N, Smith EN, Bloss C, Nurnberger J, Edenberg HJ, Foroud T, Sheftner W, Lawson WB, Nwulia EA, Hipolito M, Coryell W, Rice J, Byerley W, McMahon F, Schulze TG, Berrettini W, Potash JB, Belmonte PL, Zandi PP, McInnis MG, Zollner S, Craig D, Szelinger S, Koller D, Christian SL, Liu C, Gershon ES. Singleton deletions throughout the genome increase risk of bipolar disorder. Molecular Psychiatry. 2009a;14(4):376–380. doi: 10.1038/mp.2008.144. [DOI] [PMC free article] [PubMed] [Google Scholar]
- Zhang F, Gu WL, Hurles ME, Lupski JR. Copy Number Variation in Human Health, Disease, and Evolution. Annual Review of Genomics and Human Genetics. 2009b;10:451–481. doi: 10.1146/annurev.genom.9.081307.164217. [DOI] [PMC free article] [PubMed] [Google Scholar]
Associated Data
This section collects any data citations, data availability statements, or supplementary materials included in this article.