

Abstract
The frequency and pattern of activity in the reciprocally connected GABAergic external globus pallidus (GPe) and glutamatergic subthalamic nucleus (STN) are closely related to motor function. Although phasic, unitary GPe–STN inputs powerfully pattern STN activity ex vivo, correlated GPe–STN activity is not normally observed in vivo. To test the hypothesis that the GPe's influence is constrained by short-term synaptic depression, unitary GPe–STN inputs were stimulated in rat and mouse brain slices at rates and in patterns that mimicked GPe activity in vivo. Together with connectivity estimates these data were then used to simulate GPe–STN transmission. Unitary GPe–STN synaptic connections initially generated large conductances and transmitted reliably. However, the amplitude and reliability of transmission declined rapidly (τ = 0.6 ± 0.5 s) to <10% of their initial values when connections were stimulated at the mean rate of GPe activity in vivo (33 Hz). Recovery from depression (τ = 17.3 ± 18.9 s) was also longer than pauses in tonic GPe activity in vivo. Depression was the result of the limited supply of release-ready vesicles and was in sharp contrast to Calyx of Held transmission, which exhibited 100% reliability. Injection of simulated GPe–STN conductances revealed that synaptic depression caused tonic, nonsynchronized GPe–STN activity to disrupt rather than abolish autonomous STN activity. Furthermore, synchronous inhibition of tonically active GPe–STN neurons or phasic activity of GPe–STN neurons reliably patterned STN activity through disinhibition and inhibition, respectively. Together, these data argue that the frequency and pattern of GPe activity profoundly influence its transmission to the STN.
Introduction
The reciprocally connected GABAergic external globus pallidus (GPe) and glutamatergic subthalamic nucleus (STN) are components of the basal ganglia, a group of subcortical brain nuclei thought to be critical for action selection. The frequency and pattern of GPe–STN activity are closely related to motor function and dysfunction (Crossman, 2000; Bevan et al., 2006; Jenkinson and Brown, 2011; Wichmann et al., 2011). The uncorrelated nature of GPe–STN activity and the tonic firing of STN neurons under normal conditions (Wichmann et al., 1994; Raz et al., 2000; Urbain et al., 2000, 2002; Loucif et al., 2005; Mallet et al., 2008) are somewhat unexpected: unitary GPe–STN synaptic connections are mediated through multiple axon terminals, which generate large postsynaptic GABAA receptor-mediated conductances, and STN neurons receive inputs from ∼50–60 GPe neurons (Bevan et al., 2002; Hallworth and Bevan, 2005; Baufreton et al., 2009), many of which exhibit tonic high-frequency firing in vivo (∼33 Hz in rats; Urbain et al., 2000). One factor that may contribute to decorrelated GPe–STN activity is the anatomical organization of GPe–STN inputs (Baufreton et al., 2009). Single GPe neurons innervate a tiny fraction of sparsely distributed STN neurons, and each STN neuron receives input from a similarly limited and distinct set of GPe neurons (Baufreton et al., 2009). Another possibility is short-term depression of GPe–STN synaptic transmission (Baufreton and Bevan, 2008). The strength of GPe–STN synaptic transmission may therefore be heavily dependent on the recent firing history of GPe neurons.
The GPe and STN do exhibit correlated activity under certain conditions. Neurons in both nuclei respond to widespread cortical stimulation with stereotyped sequences of excitation and inhibition (Kita, 1992; Fujimoto and Kita, 1993; Maurice et al., 1998; Nambu et al., 2000; Kolomiets et al., 2001). During cortical spike-wave discharges in genetic absence epilepsy rats, tonically active GPe neurons exhibit pauses in firing and phasically active GPe neurons exhibit bursts that are correlated in temporally distinct manners with STN activity (Paz et al., 2005). In idiopathic and experimental Parkinson's disease (PD), motor symptoms are associated with the emergence of correlated, rhythmic, bursting activity in the GPe and STN, with GPe–STN neurons in antiphase to STN neurons (Raz et al., 2000; Galvan and Wichmann, 2008; Mallet et al., 2008, 2012; Tachibana et al., 2011). Furthermore, GPe and STN neurons are relatively hypoactive and hyperactive, respectively. These data imply an intimate link between the frequency and pattern of GPe activity and its impact on the STN. Thus, our objective was to study the activity dependence of GPe–STN synaptic transmission and integration during in vivo-like frequencies and patterns of presynaptic activity. The activity dependence of unitary GPe–STN synaptic transmission was first probed in rodent brain slices. Transmission properties and connectivity estimates were then used to inform simulations of GPe–STN transmission with varying degrees of GPe activity and synchrony. Finally, conductance waveforms derived from these models were applied using dynamic-clamp (Robinson and Kawai, 1993; Sharp et al., 1993) to determine their impact on the frequency and pattern of STN activity.
Materials and Methods
All procedures involving animals were performed in accordance with the policies of the Society for Neuroscience, the National Institutes of Health, and the Institutional Animal Care and Use Committee of Northwestern University. Tissue for electrophysiological recording was prepared from 41 male 16- to 38-day-old Sprague Dawley rats and 3 male 17- to 19-day-old C57BL/6 mice.
Drugs.
All drugs except for N-(2,6-dimethylphenylcarbamoylmethyl)triethylammonium bromide (QX 314) and tetraethylammonium chloride (TEA-Cl), which were applied through the recording pipette, were diluted to working concentration in modified artificial CSF (ACSF) and bath applied. NMDA receptors were blocked with 50 μm d-(−)-2-amino-5-phosphonopentanoic acid (APV) and AMPA receptors were blocked with 20 μm 6,7-dinitroquinoxaline-2,3-dione disodium salt (DNQX). GABAA receptors were blocked with 20 μm 6-amino-3-(4-methoxyphenyl)-1(6 H)-pyridazinebutanoic acid hydrobromide (SR 95531 hydrobromide; GABAzine), and GABAB receptors were blocked with 2 μm (2S)-3-[[(1S)-1-(3,4-dichlorophenyl) ethyl]amino-2 hydroxypropyl](phenylmethyl)phosphinic acid (CGP 55845) and/or the inclusion of 10 mm QX 314 in the recording pipette. GABAA receptors were also partially blocked with the low-affinity antagonist 5 μm 2-(carboxy-3′ propyl)-3-amino-4-methyl-6-phenylpyridazinium chloride (SR 95103) (Chambon et al., 1985). Glycine receptors were blocked with 500 nm strychnine hydrochloride. Dopamine (10 μm) was protected from oxidation by the addition of Na2S2O5 (50 μm) to modified ACSF. Drugs were purchased from Abcam, except for dopamine and TEA-Cl, which were purchased from Sigma-Aldrich.
Slice preparation.
Rats or mice were deeply anesthetized with ketamine/xylazine (87/13 mg/kg i.p.) and perfused transcardially with ∼10–25 ml of ice-cold modified ACSF that contained 230 mm sucrose, 2.5 mm KCl, 1.25 mm NaH2PO4·H2O, 0.5 mm CaCl2·2H2O, 10 mm MgSO4·7H2O, 10 mm glucose, and 26 mm NaHCO3 equilibrated with 95% O2 and 5% CO2. The brain was removed, immersed in modified ACSF and 300 μm sagittal (rat STN), coronal (rat medial nucleus of the trapezoid body [MNTB]) or 20° parasagittal (mouse STN) slices were cut with a vibratome (Vibratome 3000, Vibratome). Slices were transferred to a holding chamber, submerged in traditional ACSF that contained 125 mm NaCl, 2.5 mm KCl, 1.25 mm NaH2PO4·H2O, 2 mm CaCl2·2H2O, 2 mm MgSO4·7H2O, 10 mm glucose, 26 mm NaHCO3, 1 mm sodium pyruvate, and 5 μm l-glutathione equilibrated with 95% O2 and 5% CO2 and maintained at room temperature.
Recording.
Individual brain slices were placed in a recording chamber where they were perfused at 3–5 ml/min with ACSF at 35°C that was modified to more closely match rodent interstitial fluid (Jones and Keep, 1987, 1988). This modified ACSF contained 126 mm NaCl, 3 mm KCl, 1.25 mm NaH2PO4·H2O, 1.6 mm CaCl2·2H2O, 1.5 mm MgSO4·7H2O, 10 mm glucose and 26 mm NaHCO3 equilibrated with 95% O2 and 5% CO2. Neurons were visualized using Dodt contrast infrared video microscopy (Infrapatch workstation, Luigs & Neumann) with a fixed-stage upright microscope (Axioskop 2 FS plus, Zeiss or BX51WI, Olympus) and a 60×, 0.9 NA water-immersion objective lens.
For investigations of IPSCs, whole-cell voltage-clamp recordings were made using borosilicate glass micropipettes (BF150–86-10, Sutter Instrument) containing 135 mm CsCl, 3.6 mm NaCl, 1 mm MgCl2·6H2O, 10 mm HEPES, 0.1 mm Na4EGTA, 10 mm QX 314, 0.4 mm Na3GTP, and 2 mm Mg1.5ATP (pH 7.3 with CsOH; 290 mmol/kg). For investigations of EPSCs, whole-cell voltage-clamp recordings were made using micropipettes containing 120 mm CsCH3SO3, 2.8 mm NaCl, 5 mm TEA-Cl, 10 mm HEPES, 0.4 mm Na4EGTA, 5 mm QX 314, 5 mm phosphocreatine di(tris) salt, 0.1 mm spermine, 0.4 mm Na3GTP, and 4 mm Mg1.5ATP (pH 7.3 with CsOH; 290 mmol/kg). Whole-cell current-clamp recordings were made using micropipettes containing 130 mm KCH3SO4, 3.8 mm NaCl, 1 mm MgCl2·6H2O, 10 mm HEPES, 5 mm phosphocreatine di(tris) salt, 0.1 mm Na4EGTA, 0.4 mm Na3GTP, and 2 mm Mg1.5ATP (pH 7.3 with KOH; 290 mmol/kg). Cell-attached recordings were made using micropipettes containing 140 mm NaCl, 3 mm KCl, 1.6 mm CaCl2·2H2O, 1.5 mm MgCl2·6H2O, 23 mm glucose, and 15 mm HEPES (pH 7.2 with NaOH; 300–310 mmol/kg). Filled micropipettes had a resistance of 3–5 MΩ for voltage-clamp and cell-attached recordings, or 6–10 MΩ for current-clamp recordings.
Recordings were amplified (Multiclamp 700B, Molecular Devices), digitized (Digidata 1440A, Molecular Devices), and recorded to a PC running Clampex 10 acquisition software (Molecular Devices). Recordings were low-pass filtered online at 10 kHz (4-pole Bessel filter) and sampled at 20 kHz. For cell-attached and current-clamp recordings, electrode capacitance was compensated and current-clamp recordings were bridge balanced electronically. For voltage-clamp recordings, electrode capacitance, whole-cell capacitance, and series resistances were electronically compensated. Cells in which the series resistance changed by >20% over the duration of recording were discarded from subsequent analyses. Liquid junction potentials of 5, 9, and 9 mV (Barry, 1994) were accounted for in CsCl-based and CsCH3SO3-based voltage-clamp recordings and KCH3SO4-based current-clamp recordings, respectively.
Synaptic stimulation.
GABAA receptor-mediated IPSCs were elicited through bipolar electrical stimulation of either the internal capsule at the rostroventral edge of the STN or, in a subset of experiments, of the GPe itself. GABAA receptor-mediated IPSCs were isolated pharmacologically by the blockade of NMDA and AMPA receptors with 50 μm APV and 20 μm DNQX, respectively, and the inclusion of 10 mm QX 314 in the recording pipette to block postsynaptic GABAB receptors. The poles of stimulation were selected from a custom-built matrix of 20 stimulation electrodes (MX54CBWMB1, Frederick Haer), and charge-balanced stimulation (100 μs positive/negative) was applied using a bipolar constant current isolator (A365R, World Precision Instruments) and a programmable pulse generator (Master-8, AMPI). Minimal stimulation was used to study unitary GPe–STN synaptic transmission, as described previously (Baufreton et al., 2009). Thus, stimulus intensity was gradually increased until an IPSC was first elicited; stimulation intensity was then further increased until each stimulus evoked an IPSC without an increase in the average amplitude or alteration in the kinetics of the evoked IPSC (Baufreton et al., 2009, their Fig. 5). Stimulation intensities typically ranged from 10 to 50 μA. Minimally stimulated IPSCs were presumed to arise from the GPe, which is by far the major source of GABAergic input to the STN (Smith et al., 1990; Bevan and Bolam, 1995; Baufreton et al., 2009). Glutamate receptor-mediated EPSCs in MNTB neurons were elicited in a similar manner through bipolar stimulation of the trapezoid body just lateral to the midline. EPSCs were isolated pharmacologically through the blockade of GABAA receptors with 20 μm GABAzine, GABAB receptors with 2 μm CGP 55845, and glycine receptors with 500 nm strychnine.
Figure 5.
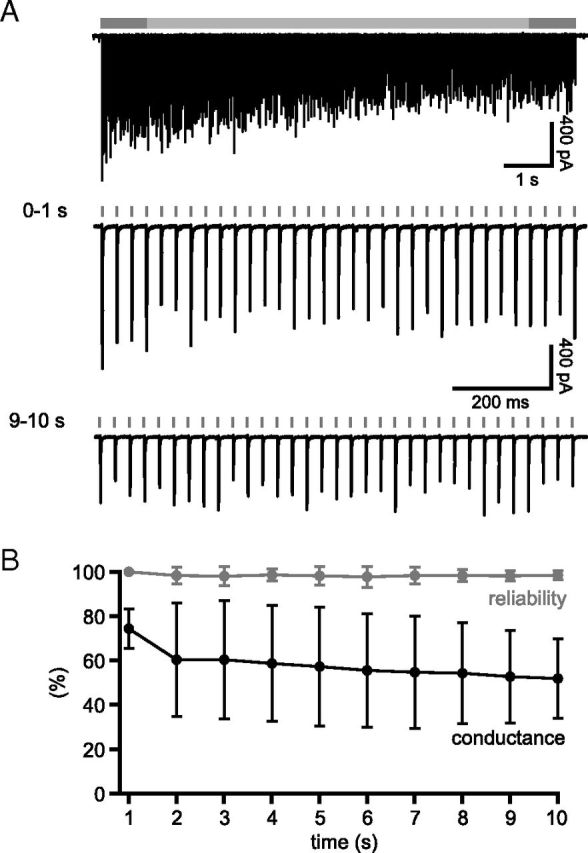
Under the same recording conditions, Calyx of Held transmission is reliable. A, Example of unitary synaptic transmission at the Calyx of Held during 10 s of stimulation at 33 Hz. B, Population data (n = 5). Mean normalized conductance (black) and reliability (gray) of transmission against time.
Unitary stimulation experiments consisted of 10 s trials of 33 Hz stimulation, repeated 10 times, with a 75 s recovery period between trials. IPSC amplitude was calculated by subtraction of 0.5 ms baseline current from the average of 5 data points (0.25 ms) centered on the maximum of the IPSC. The peak conductance underlying each IPSC was calculated as described previously (Baufreton et al., 2009). To determine the reliability of transmission, transmission was defined as successful if the amplitude of the evoked IPSC was >2–3 times the SD of the mean baseline current in the 1 s before the onset of stimulation, and the latency of the IPSC fell within the usual limits of the connection. Events marked as successful or unsuccessful were visually inspected in all neurons. Steady-state transmission was arbitrarily defined as transmission during the final second of stimulation.
Simulations and dynamic-clamp.
The steady-state transmission of up to 60 unitary GPe–STN connections synchronized at 33 Hz was simulated using IGOR Pro 6 (Wavemetrics). The probability of successful transmission from a simulated unitary GPe–STN connection (P) was drawn randomly from a Gaussian distribution with mean and SD derived from the steady-state transmission rate recorded at 27 unitary GPe–STN connections. For each of these connections, a train of 33 responses (Rn = 1–33) was generated. Each Rn was either 0, indicating failed transmission, or 1, indicating successful transmission. This was determined randomly such that the proportion of successful responses was equal to P. Transmission arising from up to 60 unitary GPe–STN connections was then simulated. If Rn from any unitary connection was 1, then the output of the ensemble of unitary connections was 1; otherwise, the output was 0.
For dynamic-clamp experiments, a conductance waveform was generated in a similar manner using 60 simulated unitary GPe–STN synaptic connections. Each simulated connection fired at 33 Hz with a coefficient of variation (CV) of 0.65 (a firing rate and CV based on GPe neurons recorded in awake rats; see Fig. 2C) (Urbain et al., 2000). To calculate the ensemble postsynaptic conductance, each unitary GPe–STN connection was assigned a random probability of transmission and peak postsynaptic conductance that were derived from the steady-state transmission properties of 27 unitary GPe–STN connections. Individual postsynaptic conductances were generated from the sum of two exponentials with τrise and τdecay derived from IPSC rise and decay times measured at 9 unitary GPe–STN connections (τrise = 0.4 ms; τdecay = 7.7 ms). Synthetic GPe–STN inhibitory conductance waveforms were then applied to STN neurons via a patch pipette using a synaptic module conductance injection amplifier (SM-1, Cambridge Conductance) with an equilibrium potential of −84 mV, as described previously (Baufreton et al., 2005, 2009). Conductance waveforms generated in this manner were unique for each neuron and for each trial.
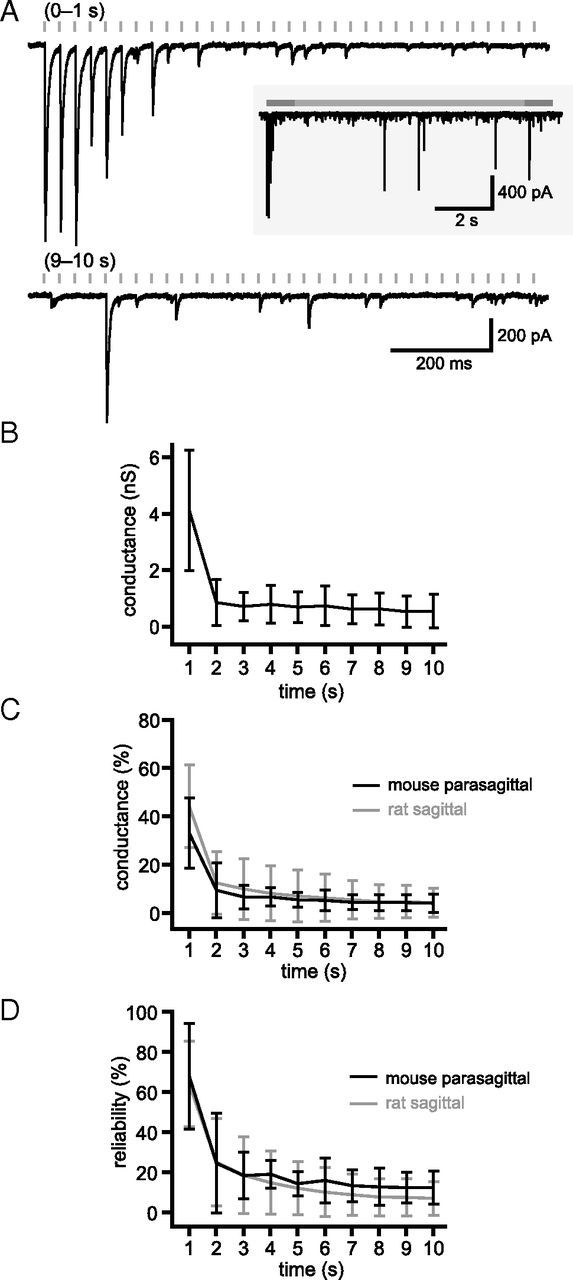
Figure 2.
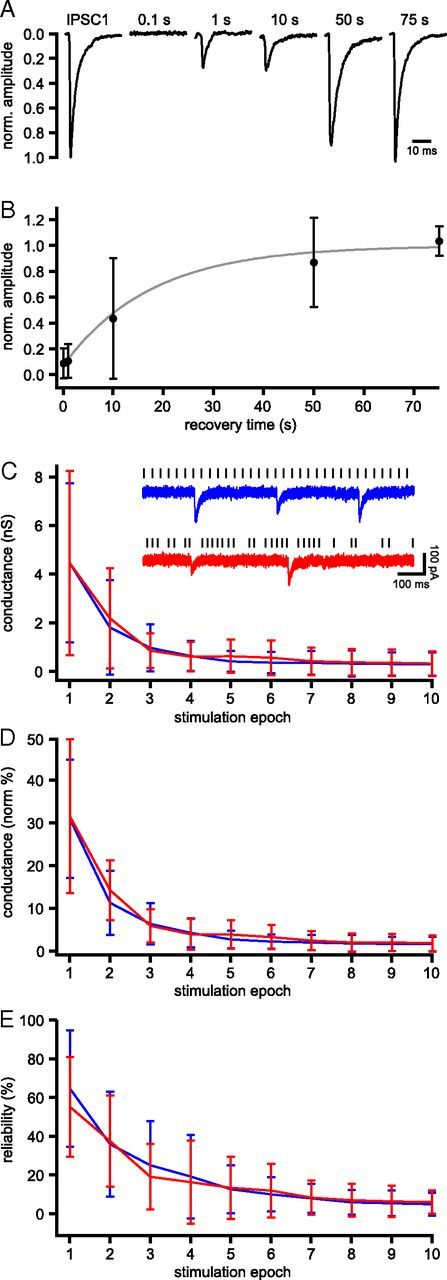
Unitary GPe–STN synaptic transmission recovers slowly from short-term synaptic depression. A, Example of the first IPSC from a 10 s train of 33 Hz stimulation and responses 0.1, 1, 10, 50, and 75 s after the train of stimulation. B, Mean recovery time course of transmission of the sample population (n = 5). The data were fit to a mono-exponential with τ of 17.3 ± 18.9 s (gray line). C–E, Plots of mean conductance (C), mean normalized conductance (D), and mean reliability (E) of unitary GPe–STN transmission per second of stimulation at 33 Hz in a regular (blue) or irregular in vivo-like (red) pattern (n = 6). C, Inset, Example of steady-state unitary GPe–STN synaptic transmission in response to a regular (blue) or irregular in vivo-like (red) pattern of stimulation.
Data analysis.
Data were analyzed with Clampfit 10 (Molecular Devices), IGOR Pro 6, and Prism 5 (GraphPad Software). Numerical data are presented as mean ± SD, and box plots (central line, median; box, 25–75%; whiskers, 10–90%) are used to illustrate sample distributions. An α-criterion of p < 0.05 was used to determine statistically significant changes.
Results
Unitary GPe–STN connections are subject to profound short-term depression when stimulated at rates and in patterns of GPe activity in vivo
Twenty-nine unitary GPe-STN synaptic connections were studied in 27 neurons in sagittal brain slices prepared from 18 rats using the minimal stimulation technique. In vivo, rat GPe neurons fire tonically at a mean rate of ∼33 Hz (Urbain et al., 2000). To study transmission at in vivo rates of activity, unitary GPe–STN inputs were electrically stimulated for 10 s at 33 Hz (Fig. 1). The first IPSC of the 10 s train had a mean underlying conductance of 8.9 ± 6.6 nS. The maximum conductance underlying this first IPSC was 13.3 ± 9.1 nS. This gives a ratio of mean:maximum conductance of 0.65 ± 0.15, which implies that unitary GPe–STN connections have a high initial probability of transmission. Both the mean and maximum conductances of unitary GPe–STN synaptic connections were similar to previously reported values (Baufreton et al., 2009).
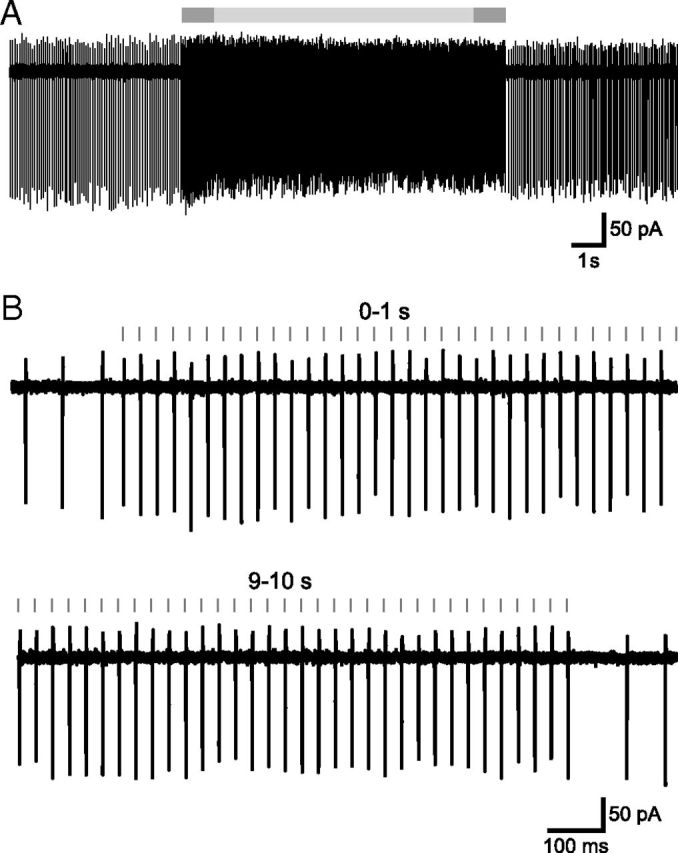
Figure 1.
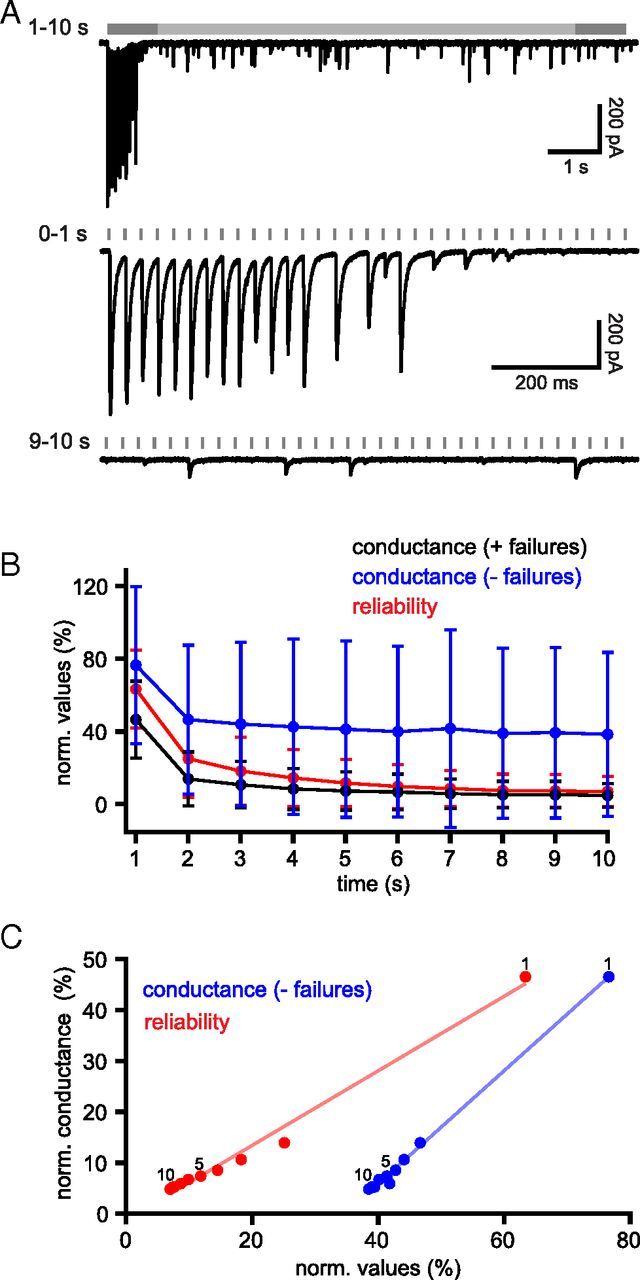
Unitary GPe–STN synaptic transmission is subject to profound short-term depression at in vivo rates of activity. A, Example of a unitary GPe–STN synaptic connection stimulated at 33 Hz for 10 s. Gray bar (top) represents the duration of stimulation. Dark gray represents the first and 10th seconds of stimulation, shown on an expanded time scale below. The amplitude and reliability of transmission during the first seconds of stimulation were considerably greater than during the 10th second of stimulation. B, C, Population data arising from 29 unitary connections. B, Plots of normalized mean conductance, including transmission failures (black markers), excluding transmission failures (blue markers), and mean reliability (red markers) per second of stimulation at 33 Hz. C, Normalized mean conductance excluding failures (blue markers) and reliability of transmission (red markers) are shown plotted against normalized mean conductance including failures. Points derived from first, fifth and 10th seconds of stimulation are denoted.
The ratio of IPSC2:IPSC1 (paired pulse ratio [PPR]) was 1.1 ± 0.7, indicating that GPe–STN connections initially exhibit no synaptic depression. However, within 1–2 s of the onset of stimulation, the amplitude and reliability of evoked transmission declined dramatically (Fig. 1A,B). From this point, a low but relatively stable level of transmission was observed over the remaining period of stimulation. The time course of synaptic depression in each connection was adequately fit by a monoexponential decay with a τ of 0.58 ± 0.49 s.
To quantify the extent of synaptic depression, the mean evoked conductance underlying IPSCs per second of stimulation (including failures of transmission) was calculated and normalized as a percentage of the conductance underlying IPSC1 (Fig. 1B). Steady-state conductance, defined as the average conductance during the last second of stimulation, was 0.24 ± 0.33 nS, or 4.4 ± 6.1% when normalized to the conductance underlying IPSC1. Steady-state transmission reliability, defined as the percentage of stimuli that gave rise to a detectable IPSC during the last second of stimulation, was 7.0 ± 8.4%. Thus, the mean steady-state conductance excluding transmission failures was considerably larger: 1.59 ± 1.03 nS or 38.5 ± 45.2% of the conductance of the underlying IPSC1. The mean steady-state amplitude of successful transmission at 33 Hz was slightly greater than the conductance underlying miniature transmission, which at this synapse is 0.73 ± 0.26 nS (Baufreton et al., 2009). Failure to detect IPSCs is therefore unlikely to have contributed to our measurement of synaptic depression. Because the reliability of transmission and conductance underlying successful transmission were tightly correlated with the conductance, including failures (r2 = 0.99 and 1.00, respectively), GPe–STN synaptic depression results from reductions in both the reliability and amplitude of unitary GPe–STN synaptic transmission (Fig. 1C). A similar degree of short-term synaptic depression was also observed when multiple GPe–STN connections were stimulated at 33 Hz (data not shown).
Although the mean firing rate of rat GPe neurons in vivo is ∼33 Hz, the pattern of activity is often irregular and interspersed with pauses in activity. Therefore, it is conceivable that pauses in the firing of GPe–STN neurons are sufficient to allow transmission to recover from synaptic depression in vivo. To test this possibility, the rate of recovery from synaptic depression was assessed in 5 neurons using single stimuli 0.1, 10, 50, or 75 s after 10 s of 33 Hz stimulation (Fig. 2A,B). Recovery was fit to a monoexponential with τ of 17.3 ± 18.9 s (Fig. 2B). As pauses in the firing of tonically active GPe neurons in vivo are usually <1 s (Urbain et al., 2000; Elias et al., 2007), these data suggest that substantial recovery from depression during these brief pauses in activity is unlikely. To address this issue more directly, unitary GPe–STN transmission was investigated using a 10 s stimulation pattern that was derived from the firing of an extracellularly recorded GPe neuron in an awake rat (firing rate = 33 Hz; CV = 0.65; interspike interval range = 11.7–124.7 ms) (Urbain et al., 2000). For each connection tested (n = 6), GPe–STN synaptic depression associated with regular or patterned stimulation were similar (Fig. 2C–E; not significant, two-way ANOVAs with post hoc Bonferroni comparisons for each stimulation epoch). Thus, the steady-state conductance associated with regular and patterned stimulation was 0.30 ± 0.49 nS and 0.33 ± 0.50 nS, respectively. The normalized steady-state conductance associated with regular and patterned stimulation was 1.63 ± 1.73% and 1.86 ± 1.81%, respectively. The steady-state reliability of transmission associated with regular or patterned stimulation was 5.0 ± 5.9% and 6.0 ± 6.0%, respectively.
The range of firing rates of GPe neurons in vivo is ∼0.2–100 Hz (Urbain et al., 2000). Therefore, steady-state depression at the mean firing rate of ∼33 Hz may not reflect the full spectrum of steady-state depression across the population of GPe neurons. To characterize this frequency dependence, depression was assessed during trains of stimuli at 1, 10, 20, 33, and 100 Hz (Fig. 3). Steady-state IPSC amplitude and reliability decreased with increasing stimulation frequency. The normalized steady-state conductance underlying IPSCs at 1 Hz was 66.1 ± 0.4% of the conductance underlying IPSC1, whereas at 100 Hz it was 3.4 ± 2.7% (Fig. 3C). Steady-state IPSC reliability at 1 Hz stimulation was 91.7 ± 20.4%, whereas with 100 Hz stimulation reliability was 6.4 ± 4.9% (Fig. 3D). Together, these data suggest that unitary GPe–STN connections are subject to widely varying degrees of short-term depression when stimulated within the range of frequencies and patterns of GPe activity in vivo.
Figure 3.
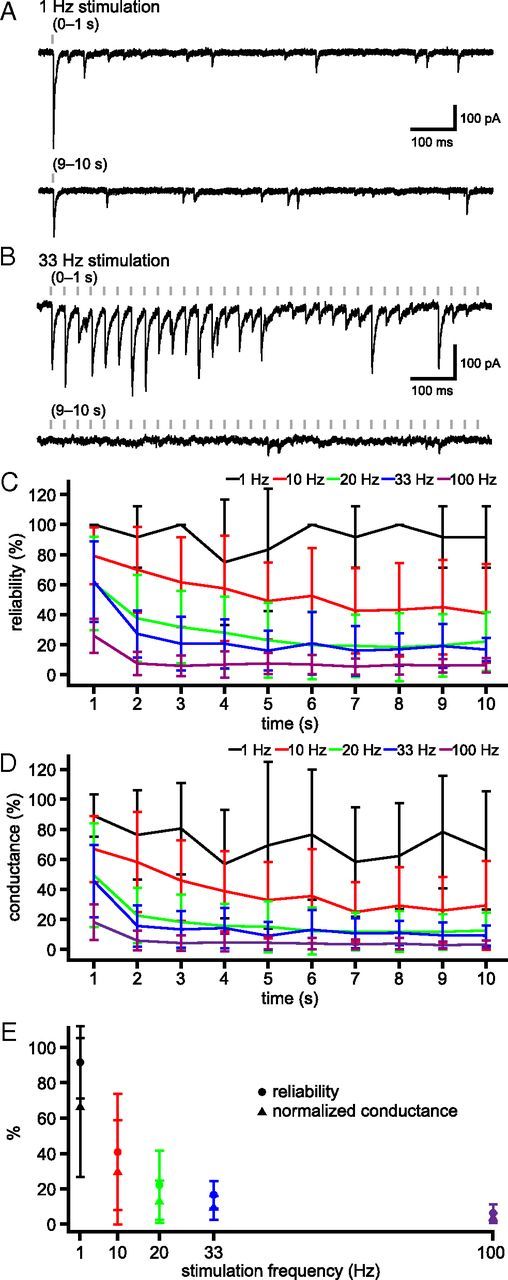
Activity dependence of unitary GPe–STN synaptic transmission. A, B, Example of unitary GPe–STN synaptic transmission during the first and 10th seconds of stimulation at 1 Hz (A) and 33 Hz (B). C, D, Population data (n = 5): mean reliability of transmission (C) and normalized conductance (D) at 1, 10, 20, 33, and 100 Hz stimulation. E, Steady-state reliability of transmission (●) and normalized conductance (▴) plotted against stimulation frequency.
Depression of unitary GPe–STN synaptic transmission is not the result of failure of action potential initiation and propagation in the primary axon of GPe neurons
As the depression of unitary GPe–STN transmission was, in part, the result of a reduction in the reliability of transmission, depression could be the result of failures in the initiation and/or propagation of action potentials in GPe–STN axons. To test for this possibility, loose-seal cell-attached recordings were made from neurons in the GPe and electrical stimulation was delivered to the internal capsule at 33 Hz for 10 s. In 5 of 5 GPe neurons tested, each stimulus elicited an antidromic action current throughout the stimulation period (Fig. 4), indicating that action potential initiation and/or propagation failure in the primary axon of GPe–STN neurons do not underlie synaptic depression during 33 Hz stimulation.
Figure 4.
GPe–STN synaptic depression is not the result of failure of action potential generation and propagation in GPe axons. A, Action currents in a GPe neuron before, during, and after electrical stimulation of the internal capsule caudal to the GPe at 33 Hz for 10 s. The period of stimulation is indicated with a gray bar and is flanked by periods of autonomous GPe activity. B, The first and 10th seconds of stimulation from the area indicated by the darker gray bars in A. Action currents were generated after each stimulus throughout the stimulation period in this and each GPe neuron tested.
It is conceivable that axons transected from their parent somata during slice preparation might transmit less effectively than intact axons as metabolic challenges could lead to a slowing of vesicle reycling and, thus, synaptic depression could be exaggerated ex vivo. To explore this possibility, first axons that are known to be able to transmit reliably at 33 Hz were tested for a reduction in reliability after slice preparation; then synaptic depression was characterized in a more intact GPe–STN preparation.
Coronal rat brain slices were prepared that contained the MNTB. Each principal neuron of the MNTB is innervated by a giant axo-somatic axon terminal, known as the Calyx of Held, which originates from the globular bushy cells of the anteroventral cochlear nucleus (Borst and Soria van Hoeve, 2012). Calyx of Held synapses contain multiple (>600) sites of vesicle fusion that ensure reliable transmission at high frequencies (Borst and Soria van Hoeve, 2012). Stimulating electrodes were placed just medial to the MNTB, close to where the afferent axons cross the midline and stimuli delivered at 33 Hz for 10 s (Fig. 5). At steady state, the normalized conductance was 52.0 ± 17.9% and transmission reliability was 98.5 ± 2.1% (n = 5). These data demonstrate that the reliable transmission of the Calyx of Held was not disrupted by our ex vivo recording conditions. Furthermore, because Calyx of Held transmission could not be generated by stimulation of the anteroventral cochlear nucleus, the Calyx of Held was transected from its parent cell body in this coronal slice preparation.
Mouse brain slices were cut at an angle of 20° to the sagittal plane, a preparation that has been previously shown to preserve GPe–STN connectivity (Hallworth and Bevan, 2005; Loucif et al., 2005). Stimulation electrodes were positioned in the GPe, and STN recordings were made during stimulation at 33 Hz (Fig. 6). Normalized steady-state conductance was not significantly altered from that observed in rat sagittal slices (rat sagittal: 4.4 ± 6.1%, n = 28; mouse parasagittal: 4.1 ± 3.9%, n = 5; Mann–Whitney test, not significant; Fig. 6C), and steady-state transmission reliability was slightly, but not statistically significantly, improved (rat sagittal: 7.0 ± 8.4%, n = 28; mouse parasagittal: 12.5 ± 8.2%, n = 5; Mann–Whitney test, not significant; Fig. 6D). These data suggest that axon transection during slice preparation did not increase synaptic depression at unitary GPe–STN synaptic connections.
Figure 6.
GPe–STN synaptic depression is not the result of transection of GPe–STN axons. A, Example of unitary synaptic transmission after stimulation of the GPe in a mouse parasagittal brain slice that preserves GPe–STN connectivity. The first and 10th seconds of stimulation at 33 Hz are shown. Inset, The entire stimulation period. B–D, Population data (n = 5). Mean conductance (B), mean normalized conductance (C), and reliability of transmission (D) against time. C, D, Gray traces represent overlay of unitary rat GPe–STN data for comparison.
Depression of unitary GPe–STN synaptic connections is not the result of activation of presynaptic GABAB autoreceptors
At many GABAergic synapses, activation of presynaptic GABAB autoreceptors can reduce the probability of transmission (e.g., Chen and van den Pol, 1998). Indeed, the GABAB agonist baclofen reduces the amplitude of GABAA receptor-mediated-IPSCs in STN neurons (Shen and Johnson, 2001). Therefore, the depression of unitary GPe–STN transmission could be the result of activation of presynaptic GABAB receptors. To test this possibility, synaptic transmission was measured before and after the application of the GABAB antagonist CGP 55845 (Fig. 7). Postsynaptic GABAB receptors were blocked a priori through the use of QX 314 in the intracellular recording solution (Nathan et al., 1990).
Figure 7.

GPe–STN synaptic depression is not the result of activation of presynaptic GABAB autoreceptors. A, B, Example of unitary GPe–STN synaptic transmission during the first and 10th seconds of stimulation at 33 Hz under control conditions (A) and in the presence of the GABAB receptor antagonist CGP 55845 (B; 2 μm). Inset, The entire stimulation period. C, Population data (n = 8): mean conductance (C1), mean normalized conductance (C2), and reliability of transmission (C3) against time and box plots illustrating amplitude of IPSC1 (C4) and ratio of IPSC2:IPSC1 (C5). Scale bars in B also apply to A. *p < 0.05.
Application of 2 μm CGP 55845 did not alter the conductance of IPSC1 (Fig. 7C4; control = 13.5 ± 7.9 nS; CGP 55845 = 13.2 ± 6.4 nS; n = 8, not significant, Wilcoxon signed ranks test) or the ratio of IPSC2:IPSC1 (Fig. 7C5; control = 0.87 ± 0.26; CGP 55845 = 0.91 ± 0.1; n = 8, not significant, Wilcoxon signed ranks test). However, the mean amplitude of transmission during the first 2 s of stimulation was increased by CGP 55845 application (0–1 s: control = 5.2 ± 3.1 nS, CGP 55845 = 6.7 ± 3.9 nS; 1–2 s: control = 1.4 ± 1.8 nS, CGP 55845 = 2.3 ± 3.2 nS; n = 8, p < 0.05, two-way ANOVA with post hoc Bonferroni comparisons; Fig. 7C1). The reliability of transmission over this period was similarly increased (0–1 s: control = 74.5 ± 19.4%, CGP 55845 = 88.0 ± 12.8%; 1–2 s: control = 35.6 ± 26.3%, CGP 55845 = 47.6 ± 36.8%; n = 8, p < 0.05, two-way ANOVA with post hoc Bonferroni comparisons; Fig. 7C3). The amplitude and reliability of steady-state transmission were however unaltered by application of CGP 55845 (amplitude: control = 0.17 ± 0.10 nS, CGP 55845 = 0.24 ± 0.16 nS; reliability: control = 5.9 ± 3.3%, CGPe 55845 = 7.1 ± 4.6%; n = 8, not significant, two-way ANOVA with post hoc Bonferroni comparisons; Fig. 7C1–C3). The data therefore suggest that the low level of steady-state GPe–STN transmission is not the result of activation of presynaptic GABAB autoreceptors.
Depression of unitary GPe–STN synaptic connections is not the result of a reduction in multivesicular release or desensitization of postsynaptic GABAA receptors
Low-affinity neurotransmitter receptor antagonists with rapid kinetics of unbinding have been used to probe the contribution of reduced GABA release and postsynaptic receptor desensitization to synaptic transmission at a variety of connections (e.g., Chen et al., 2002, Kirischuk et al., 2002; Wong et al., 2003; Foster and Regehr, 2004). If synaptic depression is the result of a reduction in the concentration of GABA released at each individual synapse, the low-affinity receptor antagonist will more effectively antagonize later synaptic currents because the concentration of neurotransmitter released at each synapse is progressively reduced. If depression is the result of postsynaptic receptor desensitization, the relative amplitude of later synaptic currents will increase because postsynaptic receptors are relatively protected from progressive desensitization by binding to the low-affinity receptor antagonist. To test for the contribution of these factors to depression, synaptic transmission was measured before and after the application of the low-affinity GABAA receptor antagonist SR95103 (Duittoz and Martin, 1991) (Fig. 8). As expected, application of 5 μm SR95103 significantly reduced the conductance of IPSC1 (control = 5.5 ± 4.1 nS; SR95103 = 2.6 ± 1.7 nS; n = 6; p < 0.05; Wilcoxon signed ranks test; Fig. 8C4), but PPR was not altered (control = 1.5 ± 0.8, SR95103 = 1.2 ± 0.3; n = 6, not significant, Wilcoxon signed ranks test; Fig. 8C5). SR95103 also produced a consistent 25–50% reduction in IPSC conductance throughout the 10 s stimulation period (linear fit: r2 = 0.01; deviation from zero slope, not significant). The mean conductance underlying transmission (Fig. 8C1) was significantly reduced in the first 1 s of transmission (0–1 s: control = 2.6 ± 1.8 nS, SR95103 = 1.3 ± 8.2 nS; n = 6, p < 0.05, two-way ANOVA with post hoc Bonferroni comparisons), but the normalized amplitude (Fig. 8C2) and reliability of transmission (Fig. 8C3) were not altered at any time point. Thus, these data suggest that a progressive reduction in the concentration of released GABA or postsynaptic receptor desensitization does not underlie synaptic depression at GPe–STN synapses.
Figure 8.

GPe–STN synaptic depression is not due to desensitization of postsynaptic GABAA receptors or reduction in the concentration of released GABA. A, B, Example of unitary GPe–STN synaptic transmission during the first and 10th seconds of stimulation at 33 Hz under control conditions (A) and in the presence of the low-affinity GABAA receptor antagonist SR95103 (B; 5 μm). Inset, The entire stimulation period. C, Population data (n = 6): mean conductance (C1), mean normalized conductance (C2), and reliability of transmission (C3) against time and box plots illustrating amplitude of IPSC1 (C4) and ratio of IPSC2:IPSC1 (C5). Scale bars in B also apply to A. *p < 0.05.
Unitary GPe–STN synaptic depression is not prevented by activation of presynaptic dopamine receptors
The initial probability of GABAA receptor-mediated GPe–STN transmission is reduced by activation of presynaptic dopamine receptors, which reduces short-term synaptic depression (Shen and Johnson, 2000; Baufreton and Bevan, 2008). Although STN neurons also express postsynaptic dopamine receptors, these do not participate in the regulation of GABAergic transmission (Shen and Johnson, 2000). The impact of presynaptic dopaminergic neuromodulation during sustained GPe–STN transmission has however not been studied. Therefore, unitary GPe–STN synaptic transmission before and after the application of 10 μm dopamine (Fig. 9) was compared. Consistent with previous reports, dopamine: (1) reduced the conductance underlying IPSC1 (control = 15.3 ± 17.6 nS, dopamine = 8.0 ± 8.5 nS; n = 10, p < 0.05, Wilcoxon signed ranks test; Fig. 9C4); (2) increased the PPR (control = 0.84 ± 0.47, dopamine = 2.36 ± 2.38; n = 10, p < 0.05, Wilcoxon signed ranks test; Fig. 9C5); (3) reduced the mean amplitude of transmission over the first second of stimulation (0–1 s: control = 4.4 ± 4.2 nS, dopamine = 3.3 ± 3.3 nS; n = 10, p < 0.05, two-way ANOVA with post hoc Bonferroni comparisons; Fig. 9C1); and (4) increased the amplitude of transmission normalized to IPSC1 over the first second of stimulation (0–1 s: control = 39.5 ± 15.8%, dopamine = 94.8 ± 65.4%; n = 10, p < 0.05, two-way ANOVA with post hoc Bonferroni comparisons; Fig. 9C2). However, from 2 to 10 s of 33 Hz stimulation, dopamine had no effect on the absolute (steady-state: control = 0.19 ± 0.18 nS, dopamine = 0.19 ± 0.26 nS; n = 10, not significant, two-way ANOVA with post hoc Bonferroni comparisons; Fig. 9C1) or normalized amplitude of transmission (steady-state: control = 2.0 ± 1.6%, dopamine = 5.5 ± 4.5%; n = 10, not significant, two-way ANOVA with post hoc Bonferroni comparisons; Fig. 9C2). Dopamine application also had no effect on reliability of transmission (steady-state: control = 4.2 ± 4.0%, dopamine = 3.9 ± 4.4%; n = 10, not significant, two-way ANOVA with post hoc Bonferroni comparisons; Fig. 9C3). Thus, reducing the initial probability of GPe–STN transmission delays, but does not prevent, synaptic depression.
Figure 9.

GPe–STN synaptic depression is not prevented by activation of dopamine receptors. A, B, Example of unitary GPe–STN synaptic transmission during the first and 10th seconds of stimulation at 33 Hz under control conditions (A) and in the presence of dopamine (B; 10 μm). Inset, The entire stimulation period. C, Population data (n = 10): mean conductance (C1), mean normalized conductance (C2), and reliability of transmission (C3) against time and box plots illustrating amplitude of IPSC1 (C4) and ratio of IPSC2:IPSC1 (C5). Scale bars in B also apply to A. *p < 0.05.
Synchronous activity of multiple unitary GPe–STN synaptic connections increases the reliability of GPe–STN transmission
The maximum GABAA receptor-mediated synaptic conductance generated by a single GPe–STN axon is 11.32 ± 10.61 nS, whereas the average miniature GABAA receptor-mediated synaptic conductance is 0.73 ± 0.26 nS (Baufreton et al., 2009). Thus, each GPe neuron may establish ∼15.5 synaptic contacts with each STN neuron. As each STN neuron has been estimated to receive an average of 883 synaptic contacts from the GPe (Baufreton et al., 2009), ∼57 GPe neurons may provide convergent synaptic input to each STN neuron. Although individual GPe–STN neurons transmit with low reliability at 33 Hz, we hypothesized that synchronous activity of presynaptic neurons would enhance the reliability of synaptic inhibition. To test this, IPSC conductances from different randomly selected STN neuron recordings were summed. Thus, 25 summed GPe–STN connections resulted in larger amplitude IPSC conductances and fewer failures than 5 summed connections (Fig. 10A). Figure 10B illustrates the steady-state reliability when 1, 5, 10, 15, 20, or 25 connections were summed (black dots). These data were fitted to a single exponential with a τ of 8.6 ± 0.3 connections (y0 = 100%, A = −105.3 ± 2.5; Fig. 10B, red line). Next, a simulation of 1–60 GPe–STN fibers was generated using transmission reliabilities derived from the steady-state transmission of 27 unitary GPe–STN connections, as described above. After 1000 runs, the mean ± SD of transmission reliability from 1 to 60 connections was calculated (Fig. 10B, gray line and shaded area). On the basis of this simulation, ∼37 GPe–STN connections (i.e., more than half the presynaptic neuron population synchronized at 33 Hz) would be required to reliably generate IPSCs at 33 Hz in the postsynaptic neuron.
Figure 10.
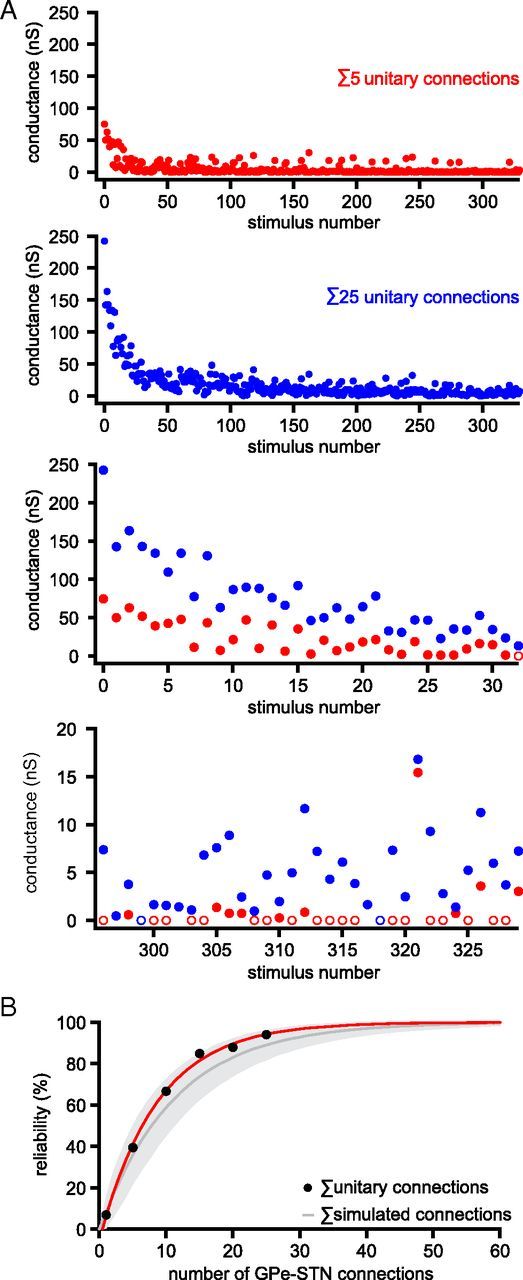
Synchronous activity of multiple unitary GPe–STN synaptic connections increases the reliability of GPe–STN transmission. A, Comparison of GPe–STN transmission arising from the addition of 5 (red dots) and 25 (blue dots) unitary inputs randomly selected from a sample of 27 recorded unitary GPe–STN connections stimulated at 33 Hz for 10 s. Open circles represent failures of transmission. Lower two panels, First and 10th seconds of stimulation. B, Plot of number of randomly selected (black dots; red line indicates monoexponential fit) and simulated (gray represents mean ± SD. of 1000 simulations) unitary GPe–STN connections versus the reliability of steady-state GPe–STN transmission at 33 Hz.
Tonic, irregular, nonsynchronous GPe–STN activity disrupts, but does not prevent, autonomous STN activity
To assess how GPe–STN neurons firing at 33 Hz pattern STN activity when GPe–STN synaptic transmission is depressed to a steady-state level, GPe–STN transmission arising from the nonsynchronous, tonic, irregular (CV = 0.65) activity of 60 GPe–STN neurons firing at 33 Hz was simulated and then applied as a synaptic conductance to STN neurons in vitro.
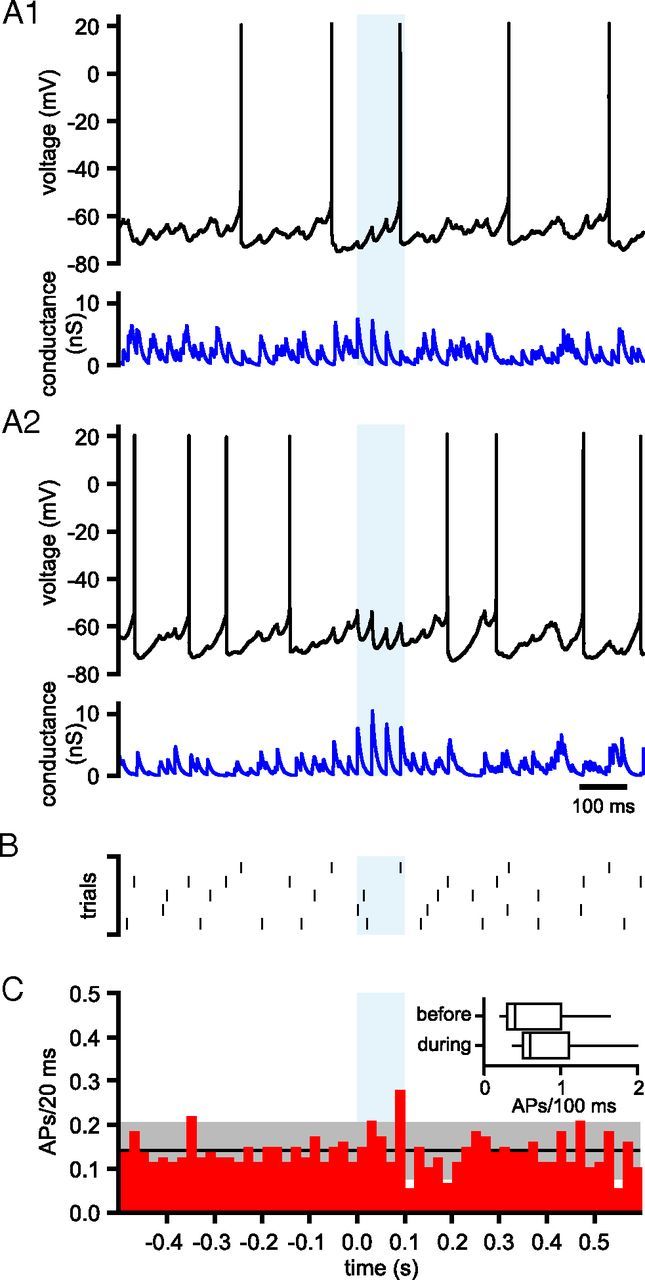
Figure 11 illustrates the impact of simulated GPe–STN transmission on the activity of STN neurons. Regular autonomous firing was slowed and disrupted by synthetic synaptic input. Action potentials were autonomously generated at 12.35 ± 4.99 Hz under control conditions and at 6.68 ± 3.73 Hz during synthetic conductance injection (n = 19, p < 0.05, Wilcoxon signed ranks test; Fig. 11A1,A2,D). The CV of firing was 0.11 ± 0.06 under control conditions and 0.50 ± 0.19 during synthetic conductance injection (n = 19, p < 0.05, Wilcoxon signed ranks test; Fig. 11A1,A2,D). Spike-triggered averaging revealed that STN action potentials coincided with momentary reductions in inhibitory transmission (Fig. 11B,C). For comparison, a conductance waveform simulating transmission from the nonsynchronous activity of 60 GPe–STN neurons firing at 33 Hz, which possessed a similarly depressed amplitude but not reliability of transmission, was also applied. As illustrated in Figure 11E, and in each neuron tested, action potential generation was completely inhibited and the resulting membrane potential was hyperpolarized to −80.44 ± 0.79 mV (n = 6). These data suggest that the synaptic output arising from tonic, irregular, nonsynchronous GPe–STN activity produces moderate, but not complete, suppression of autonomous STN activity.
Figure 11.

Tonic, irregular, asynchronous GPe–STN activity disrupts, but does not prevent, autonomous STN activity. Activity of a STN neuron (black) in the absence (A1) and presence of simulated GABAA receptor-mediated inhibition arising from 60 GPe–STN neurons discharging at 33 Hz in a nonsynchronous, irregular pattern (A2). The applied inhibitory conductance waveform is illustrated (blue). B, Spike-triggered average of action potentials (black) and the applied inhibitory conductance waveform (blue) from the example in A. C, Population data showing the mean ± SD (shaded area) spike-triggered average for all neurons tested. D, Population data illustrating the frequency and CV of firing in the absence and presence of simulated GPe–STN transmission. Data from individual STN neurons (colored lines and points) and the population means and SDs (horizontal black lines/gray boxes) are illustrated. E, Impact on the activity of a STN neuron (black) of simulated GPe–STN transmission arising from 60 GPe–STN neurons discharging at 33 Hz in a nonsynchronous, irregular pattern that was depressed in amplitude to the same level as in A2 but was 100% reliable (blue). *p < 0.05.
Patterning of STN activity by brief synchronous firing or inhibition of tonically active GPe–STN neurons or phasic activity of GPe–STN neurons
We next investigated whether synchronized perturbations in the firing of simulated GPe–STN neurons modified the patterning of STN activity. Waveforms were generated that simulated 60 GPe–STN unitary connections with tonic, irregular (CV = 0.65), nonsynchronous presynaptic activity that was interrupted for 100 ms with synchronization of all GPe–STN inputs at 33 Hz (CV = 0). Figure 12A shows examples of two trials with 100 ms of synchronous firing at 33 Hz (shaded blue box). Action potentials from all five trials from this neuron are illustrated in Figure 12B. Overall, there was no alteration in the number of action potentials during 100 ms of synchronization compared with the 100 ms period before synchronization (tonic, irregular, nonsynchronous firing = 0.73 ± 0.62 action potentials/100 ms, synchronous firing = 0.94 ± 0.78 action potentials/100 ms, n = 17, not significant, Wilcoxon signed rank test; Fig. 12C).
Figure 12.
Effects of synchronized 33 Hz firing of GPe–STN neurons on STN activity. A, Activity of a STN neuron (black) in the presence of simulated GABAA receptor-mediated inhibition (blue) arising from 60 GPe–STN neurons discharging at 33 Hz in a nonsynchronous, irregular pattern that was interrupted for 100 ms by synchronous, rhythmic firing at 33 Hz (light blue shaded area). A1, A2, Two trials are illustrated; blue represents the respective conductance waveforms for each trial. B, Raster plot of action potentials from 5 trials taken from the neuron shown in A. C, Population PSTH showing action potentials (APs)/20 ms before, during, and after 100 ms of synchronous 33 Hz firing. The black line and gray shaded area show the mean ± 2 SD of firing during nonsynchronous input. Inset, Box plots comparing action potentials in the 100 ms before and during synchronization of GPe–STN activity/transmission. *p < 0.05.
Next, waveforms were generated that simulated 60 GPe–STN unitary connections with tonic, irregular (CV = 0.65), nonsynchronous activity that was interrupted by a 100 ms synchronized pause in all presynaptic activity. An example of the effect of a 100 ms pause in GPe–STN activity is illustrated in Figure 13A, B. In all 5 trials in this neuron, two action potentials were generated during the pause. Overall, the pause in GPe–STN transmission produced an increase in STN firing (tonic, irregular, nonsynchronous firing = 0.67 ± 0.63 action potentials/100 ms, synchronous pause in firing = 1.59 ± 0.96 action potentials/100 ms, n = 17, p < 0.05, Wilcoxon signed rank test; Fig. 13C).
Figure 13.
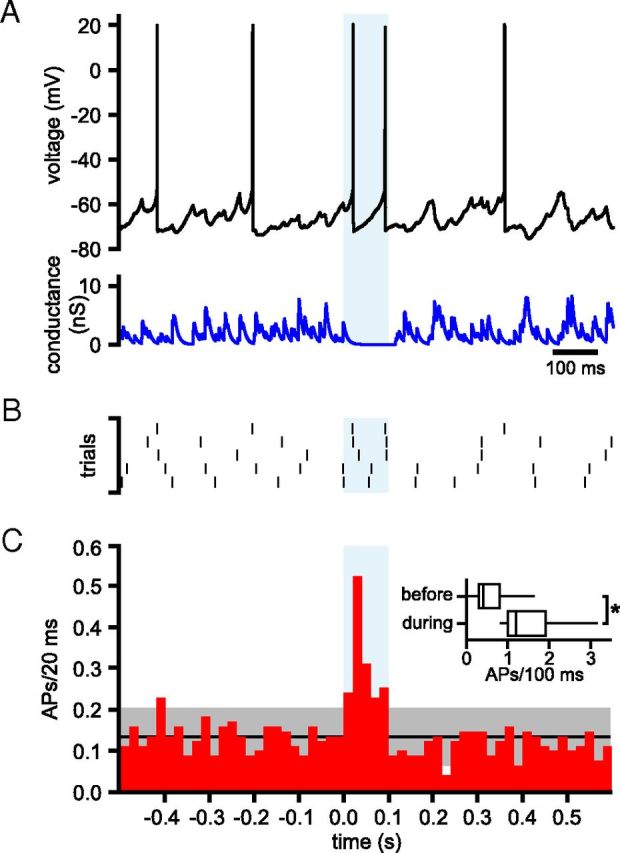
Effects of synchronous inhibition of GPe–STN activity on STN firing. A, Activity of a STN neuron (black) in the presence of simulated GABAA receptor-mediated inhibition (blue) arising from 60 GPe–STN neurons discharging at 33 Hz in a nonsynchronous, irregular pattern that was interrupted for 100 ms by synchronous inhibition of GPe–STN activity (light blue shaded area). B, Raster plot showing the times of action potentials in 5 trials from the STN neuron shown in A. C, Population PSTH showing action potentials (APs)/20 ms before, during, and after 100 ms of synchronous inhibition of GPe–STN activity. The black line and gray shaded area show the mean ± 2 SD of firing during nonsynchronous activity. Inset, Box plots comparing the number of action potentials in the 100 ms before and during synchronous inhibition of GPe–STN activity/transmission. *p < 0.05.
The role of a hypothetical subpopulation of phasically active GPe–STN connections was also investigated. In this case, the conductance waveform was generated from 60 simulated connections with tonic 33 Hz, irregular (CV = 0.65), nonsynchronous action potentials in 54 of 60 connections. Additionally, the conductance waveform incorporated 100 ms synchronized 33 Hz activity of 6 (10%) GPe–STN connections that were otherwise inactive and thus less subject to short-term synaptic depression. The effect of phasic activity of 6 GPe–STN connections against a background of 54 tonically active GPe–STN connections is illustrated in Figure 14. Phasic, synchronous activity of 6 GPe–STN connections generated a large synaptic conductance that inhibited STN activity (Fig. 14A,B). Indeed firing was abolished by phasic activity in each of 13 STN neurons tested (Fig. 14C; tonic, irregular, nonsynchronous firing = 0.77 ± 0.92 action potentials/100 ms, partial, phasic, synchronous firing = 0 ± 0 action potentials/100 ms, n = 13, p < 0.05, Wilcoxon signed rank test).
Figure 14.
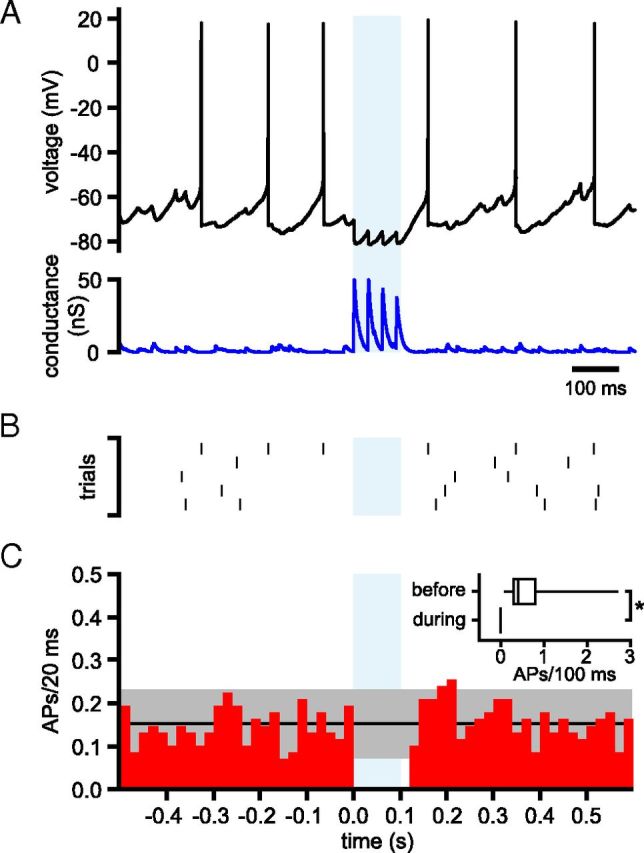
Effects of synchronized phasic 33 Hz firing of 10% of GPe–STN neurons on STN activity. A, Activity of a STN neuron (black) in the presence of simulated GABAA receptor-mediated inhibition (blue) arising from 54 GPe–STN neurons discharging at 33 Hz in a nonsynchronous, irregular pattern and from 6 GPe–STN neurons that discharged synchronously for 100 ms at 33 Hz but were otherwise inactive (light blue shaded area). B, Raster plot showing the times of action potentials in 5 trials from the STN neuron shown in A. C, Population PSTH showing action potentials (APs)/20 ms before, during, and after partial, phasic, synchronous GPe–STN activity. The black line and gray shaded area show the mean ± 2 SD of firing during nonsynchronous input. Inset, Box plots comparing action potentials 100 ms before and during 100 ms partial, phasic, synchronous GPe–STN activity/transmission. *p < 0.05.
The impact of 100 ms synchronous GPe–STN activity, a synchronous pause in GPe–STN activity and partial, phasic synchronization of GPe–STN connections on the first action potential after the onset of each applied conductance was analyzed (Fig. 15). This analysis revealed that the latency to the first action potential was significantly less for synchronous inhibition of firing than synchronous firing or partial, phasic synchronous firing (synchronous firing = 96.4 ± 66.7 ms, n = 17; synchronous pause in firing; 32.1 ± 9.9 ms, n = 17; partial, phasic synchronous firing = 234.8 ± 104.5 ms, n = 13; one-way ANOVA with post hoc Bonferroni comparisons; Fig. 15).
Figure 15.

STN output in response to patterns of synthetic GPe–STN inhibition. Box plots summarizing the latency (A) and CV of latency (B) to the first action potential (AP1) following the onset of 100 ms synchronous (synch.) GPe–STN firing or 100 ms of synchronous inhibition of GPe–STN activity or 100 ms of partial, phasic, synchronous GPe–STN firing. *p < 0.05.
The jitter (CV of latency) of the subsequent action potential was smallest for partial, phasic synchronous firing of STN-GPe neurons, presumably because this pattern of presynaptic activity most effectively inhibited STN activity through deactivation of STN Nav channels, which in turn led to the phase resetting of autonomous STN activity (synchronous firing = 0.7 ± 0.25, n = 17; synchronous pause in firing; 0.56 ± 0.14, n = 17; partial, phasic synchronous firing = 0.27 ± 0.22, n = 13; one-way ANOVA with post hoc Bonferroni comparisons; Fig. 15). Together, our data suggest that short-term synaptic depression is a robust property of GPe–STN synaptic transmission, which has a fundamental influence on the patterning of STN activity by the GPe.
Discussion
Unitary GPe–STN connections are mediated through multiple axosomatic and axodendritic synapses, which generate large GABAA receptor-mediated conductances (Smith et al., 1990; Baufreton et al., 2009). These features imply that GPe neurons should powerfully regulate STN activity. However, extracellular recording studies in vivo (Magill et al., 2000; Urbain et al., 2000; Soares et al., 2004; Mallet et al., 2008) and ex vivo (Loucif et al., 2005) report little correlated GPe–STN activity. Although the selectivity of GPe–STN connections may contribute to this paradox (Baufreton et al., 2009), the present findings argue that the strength of GPe–STN synaptic transmission is highly dynamic. Thus, we demonstrate that the probability and reliability of unitary GPe–STN transmission vary greatly when GPe–STN inputs are stimulated at rates and in patterns of GPe neuron activity in vivo.
The comparatively reliable Calyx of Held transmission (Borst and Soria van Hoeve, 2012) along with the physiological temperature range (35°C–37°C) and extracellular Ca2+ concentration (1.6 mm; Jones and Keep, 1988) used here argue that short-term synaptic depression is a robust feature of GPe–STN transmission. Furthermore, GPe-substantia nigra pars reticulata transmission, which often arises from the same GPe neurons that project to the STN (Bevan et al., 1998; Mallet et al., 2012), exhibits similar activity-dependent dynamics (Connelly et al., 2010).
Short-term synaptic depression was not the result of the failure of action potential generation and propagation in the primary descending axon of GPe neurons, as evidenced by reliable antidromic driving of GPe neurons, which is consistent with the capability of GPe neurons to fire at high frequencies in vivo (Magill et al., 2000; Urbain et al., 2000; Bar-Gad et al., 2003; Soares et al., 2004; Mallet et al., 2008) and ex vivo (Cooper and Stanford, 2000; Mercer et al., 2007). That said, action potential generation and/or propagation failures in the terminal branches of GPe axons (Hatt and Smith, 1976) and inactivation and/or reduced activation of axon terminal CaV channels (Forsythe et al., 1998; Xu and Wu, 2005) may contribute to depression.
Presynaptic GABAB autoreceptors (Shen and Johnson, 2001) do not underlie depression because their blockade retarded its onset but had no effect on steady-state transmission. Reduction in the number of quanta/amount of GABA per quantum per release event or postsynaptic receptor desensitization can also be discounted because the rapidly dissociating GABAA receptor antagonist SR95103 blocked postsynaptic receptors to a consistent degree across the stimulation period (Kirischuk et al., 2002; compare Chen et al., 2002; Wong et al., 2003; Foster and Regehr, 2004). Finally, reducing the initial probability of GPe–STN synaptic transmission through activation of presynaptic D2-like dopamine receptors retarded, but did not prevent, synaptic depression (compare Hefft et al., 2002). Together, we conclude that, at mean in vivo firing rates, unitary GPe–STN synaptic transmission is limited by the availability of release-ready vesicles.
The mean steady-state conductance per unitary connection at 33 Hz was ∼0.24 nS/stimulus. Thus, the total conductance generated per unitary connection per second was ∼7.92 nS/s (33 stimuli/s × 0.24 nS/stimulus). Given that the mean quantal conductance of GPe–STN connections is ∼0.73 nS/quantum (Baufreton et al., 2009), unitary GPe–STN connections transmitted ∼ 10.85 quanta/s (7.92 nS/s / 0.73 nS/quantum). Because unitary GPe–STN connections are mediated through ∼15.5 axon terminals (Baufreton et al., 2009), transmission was ∼0.70 quanta/s per axon terminal (10.85 quanta/s / 15.5 axon terminals), a level of transmission similar to that observed at Schaffer collateral axon terminals stimulated continuously at 20 Hz (Garcia-Perez et al., 2008). Because GPe–STN synaptic depression was similar in response to a regular or an in vivo-like irregular pattern of stimulation, and recovery from synaptic depression was very slow, the brief pauses in tonic GPe neuron activity that are often observed in vivo (Magill et al., 2000; Urbain et al., 2000; Soares et al., 2004; Elias et al., 2007; Mallet et al., 2008) are unlikely to greatly increase the availability of release-ready vesicles.
At some connections, synaptic depression is counteracted by the presence of multiple synapses per axon terminal and spillover transmission (e.g., the calyx of Held and cerebellar Purkinje-deep cerebellar nuclear axon terminals possess >600 synapses) (Borst and Soria van Hoeve, 2012) and ∼9 synapses per terminal (Telgkamp et al., 2004), respectively. In contrast, GPe–STN axon terminals, in common with Schaffer collateral axon terminals, possess far fewer synapses per axon terminal (Sorra and Harris, 1993; Stevens and Wang, 1995; Baufreton et al., 2009; Fan et al., 2012). A large ready releasable pool of vesicles and ultrafast vesicle recycling (Saviane and Silver, 2006) can also help to sustain transmission, adaptations that GPe–STN axon terminals (studied under similar conditions) apparently do not possess.
To understand the functional implications of short-term synaptic depression, we simulated GPe–STN transmission under a variety of activity and transmission conditions and then applied the resultant inhibitory conductance waveforms using the dynamic-clamp technique. This approach is a simplification of conditions in vivo because STN neurons also receive glutamatergic inputs from a variety of sources (Smith et al., 1998). However, the firing patterns of these afferents in vivo and the postsynaptic receptors they act through are poorly defined and were therefore not considered further. Thus, 100% reliable GPe–STN transmission at 33 Hz overwhelmed autonomous STN activity, whereas low reliability GPe–STN transmission at 33 Hz disrupted STN activity but did not abolish firing. Spike-triggered averaging revealed that STN neurons fired action potentials during brief random interruptions/reductions in GPe–STN transmission. These observations help to explain the persistent activity of STN neurons in vivo (Magill et al., 2000; Urbain et al., 2000; Soares et al., 2004; Mallet et al., 2008) and ex vivo (Hallworth and Bevan, 2005), which would be prevented by huge inhibitory conductances if GPe–STN transmission were not subject to depression. Conversely, the weak background inhibition of STN neurons provided by tonic but depressed GPe–STN synaptic transmission can explain the disinhibition of STN neurons that accompanies the lesioning or silencing of GPe neurons or blockade of STN GABAA receptors in vivo (Rouzaire-Dubois et al., 1980; Ryan and Clark, 1992; Urbain et al., 2002; Tachibana et al., 2011) and ex vivo (Hallworth and Bevan, 2005).
Simulations suggest that to transmit reliably at 33 Hz, GPe–STN activity must be synchronized. However, the impact of brief periods of synchronous firing at the same frequency, was no different from that of irregular, nonsynchronous GPe–STN activity. In contrast, brief synchronous inhibition of GPe–STN activity effectively patterned STN firing through disinhibition. Thus, from a network perspective, the low reliability of GPe–STN transmission could subserve multiple functions: (1) contribute to the resting decorrelation of GPe and STN neurons (Abbott and Regehr, 2004); (2) disrupt, but not prevent, tonic STN activity, which is critical for the prevention of involuntary movement and impulses (Crossman, 2000); (3) shunt synaptic excitation of the STN (compare Atherton et al., 2010); and (4) enable striatal inhibition of GPe neurons to regulate STN activity through disinhibition (Maurice et al., 1998). Another effective pattern of GPe–STN transmission was provided when 10% of presynaptic GPe–STN neurons discharged briefly and synchronously at 33 Hz for 100 ms. Because transmission at these GPe–STN connections was not depressed, the large magnitude of the phasic conductance silenced STN neurons. Thus, phasically active GPe neurons with a low mean rate of activity are highly effective at inhibiting STN activity. Short-term depression therefore enables GPe–STN neurons to transmit and thus pattern STN neurons in distinct modes that are dependent on their recent firing history. Similar activity-dependent modes of transmission have been observed in other brain nuclei (Abbott and Regehr, 2004; Swadlow et al., 2005). Tonic and phasic firing patterns have been consistently observed in GPe neurons in vivo (Magill et al., 2000; Raz et al., 2000; Urbain et al., 2000; Soares et al., 2004; Mallet et al., 2008). In genetic absence epilepsy rats undergoing seizures, GPe activity patterns have distinct relationships to STN firing analogous to those described above. Thus, pauses in the tonic firing of the majority of GPe neurons were broadly associated with activity of STN neurons, whereas bursts of activity in an otherwise silent minority of GPe neurons were associated with large IPSPs and inhibition of STN neurons (Paz et al., 2005).
Although the tonic firing of GPe neurons in normal animals is irregular and poorly correlated, in experimental and idiopathic PD GPe neurons exhibit correlated bursts of activity (Nini et al., 1995). Our data suggest that in PD synchronous pauses in GPe activity together with a reduction in mean firing rate (Wichmann et al., 2011) and strengthening of GPe–STN connections (Fan et al., 2012) will enable the GPe to more effectively pattern STN activity. Indeed, GPe and STN neurons discharge is in antiphase in PD models (Mallet et al., 2008, 2012). Furthermore, abnormal, parkinsonian STN activity is abolished by pharmacological inhibition of GPe neurons, implying a causative role for GPe–STN transmission (Tachibana et al., 2011).
Footnotes
This work was supported by National Institutes of Health, National Institute of Neurological Disorders and Stroke Grants R37NS041280 and P50 NS047085, and by the Parkinson's Disease Foundation Grant PDF-IRG-1101 to M.D.B.
The authors declare no competing financial interests.
References
- Abbott LF, Regehr WG. Synaptic computation. Nature. 2004;431:796–803. doi: 10.1038/nature03010. [DOI] [PubMed] [Google Scholar]
- Atherton JF, Kitano K, Baufreton J, Fan K, Wokosin D, Tkatch T, Shigemoto R, Surmeier DJ, Bevan MD. Selective participation of somatodendritic HCN channels in inhibitory but not excitatory synaptic integration in neurons of the subthalamic nucleus. J Neurosci. 2010;30:16025–16040. doi: 10.1523/JNEUROSCI.3898-10.2010. [DOI] [PMC free article] [PubMed] [Google Scholar]
- Bar-Gad I, Heimer G, Ritov Y, Bergman H. Functional correlations between neighboring neurons in the primate globus pallidus are weak or nonexistent. J Neurosci. 2003;23:4012–4016. doi: 10.1523/JNEUROSCI.23-10-04012.2003. [DOI] [PMC free article] [PubMed] [Google Scholar]
- Barry PH. JPCalc, a software package for calculating liquid junction potential corrections in patch-clamp, intracellular, epithelial and bilayer measurements and for correcting junction potential measurements. J Neurosci Methods. 1994;51:107–116. doi: 10.1016/0165-0270(94)90031-0. [DOI] [PubMed] [Google Scholar]
- Baufreton J, Bevan MD. D2-like dopamine receptor-mediated modulation of activity-dependent plasticity at GABAergic synapses in the subthalamic nucleus. J Physiol. 2008;586:2121–2142. doi: 10.1113/jphysiol.2008.151118. [DOI] [PMC free article] [PubMed] [Google Scholar]
- Baufreton J, Atherton JF, Surmeier DJ, Bevan MD. Enhancement of excitatory synaptic integration by GABAergic inhibition in the subthalamic nucleus. J Neurosci. 2005;25:8505–8517. doi: 10.1523/JNEUROSCI.1163-05.2005. [DOI] [PMC free article] [PubMed] [Google Scholar]
- Baufreton J, Kirkham E, Atherton JF, Menard A, Magill PJ, Bolam JP, Bevan MD. Sparse but selective and potent synaptic transmission from the globus pallidus to the subthalamic nucleus. J Neurophysiol. 2009;102:532–545. doi: 10.1152/jn.00305.2009. [DOI] [PMC free article] [PubMed] [Google Scholar]
- Bevan MD, Bolam JP. Cholinergic, GABAergic, and glutamate-enriched inputs from the mesopontine tegmentum to the subthalamic nucleus in the rat. J Neurosci. 1995;15:7105–7120. doi: 10.1523/JNEUROSCI.15-11-07105.1995. [DOI] [PMC free article] [PubMed] [Google Scholar]
- Bevan MD, Booth PA, Eaton SA, Bolam JP. Selective innervation of neostriatal interneurons by a subclass of neuron in the globus pallidus of the rat. J Neurosci. 1998;18:9438–9452. doi: 10.1523/JNEUROSCI.18-22-09438.1998. [DOI] [PMC free article] [PubMed] [Google Scholar]
- Bevan MD, Magill PJ, Hallworth NE, Bolam JP, Wilson CJ. Regulation of the timing and pattern of action potential generation in rat subthalamic neurons in vitro by GABA-A IPSPs. J Neurophysiol. 2002;87:1348–1362. doi: 10.1152/jn.00582.2001. [DOI] [PubMed] [Google Scholar]
- Bevan MD, Atherton JF, Baufreton J. Cellular principles underlying normal and pathological activity in the subthalamic nucleus. Curr Opin Neurobiol. 2006;16:621–628. doi: 10.1016/j.conb.2006.10.003. [DOI] [PubMed] [Google Scholar]
- Borst JG, Soria van Hoeve J. The calyx of held synapse: from model synapse to auditory relay. Annu Rev Physiol. 2012;74:199–224. doi: 10.1146/annurev-physiol-020911-153236. [DOI] [PubMed] [Google Scholar]
- Chambon J, Feltz P, Heaulme M, Restle S, Schlichter R, Biziere K, Wermuth C. An arylaminopyridazine derivative of gamma-aminobutyric acid (GABA) is a selective and competitive antagonist at the GABAA receptor site. Proc Natl Acad Sci U S A. 1985;82:1832–1836. doi: 10.1073/pnas.82.6.1832. [DOI] [PMC free article] [PubMed] [Google Scholar]
- Chen C, Blitz DM, Regehr WG. Contributions of receptor desensitization and saturation to plasticity at the retinogeniculate synapse. Neuron. 2002;33:779–788. doi: 10.1016/S0896-6273(02)00611-6. [DOI] [PubMed] [Google Scholar]
- Chen G, van den Pol AN. Presynaptic GABA(B) autoreceptor modulation of P/Q-type calcium channels and GABA release in rat suprachiasmatic nucleus neurons. J Neurosci. 1998;18:1913–1922. doi: 10.1523/JNEUROSCI.18-05-01913.1998. [DOI] [PMC free article] [PubMed] [Google Scholar]
- Connelly WM, Schulz JM, Lees G, Reynolds JN. Differential short-term plasticity at convergent inhibitory synapses to the substantia nigra pars reticulata. J Neurosci. 2010;30:14854–14861. doi: 10.1523/JNEUROSCI.3895-10.2010. [DOI] [PMC free article] [PubMed] [Google Scholar]
- Cooper AJ, Stanford IM. Electrophysiological and morphological characteristics of three subtypes of rat globus pallidus neurone in vitro. J Physiol. 2000;527:291–304. doi: 10.1111/j.1469-7793.2000.t01-1-00291.x. [DOI] [PMC free article] [PubMed] [Google Scholar]
- Crossman AR. Functional anatomy of movement disorders. J Anat. 2000;196:519–525. doi: 10.1046/j.1469-7580.2000.19640519.x. [DOI] [PMC free article] [PubMed] [Google Scholar]
- Duittoz AH, Martin RJ. Antagonist properties of arylaminopyridazine GABA derivatives at the Ascaris muscle GABA receptor. J Exp Biol. 1991;159:149–164. doi: 10.1242/jeb.159.1.149. [DOI] [PubMed] [Google Scholar]
- Elias S, Joshua M, Goldberg JA, Heimer G, Arkadir D, Morris G, Bergman H. Statistical properties of pauses of the high-frequency discharge neurons in the external segment of the globus pallidus. J Neurosci. 2007;27:2525–2538. doi: 10.1523/JNEUROSCI.4156-06.2007. [DOI] [PMC free article] [PubMed] [Google Scholar]
- Fan KY, Baufreton J, Surmeier DJ, Chan CS, Bevan MD. Proliferation of external globus pallidus-subthalamic nucleus synapses following degeneration of midbrain dopamine neurons. J Neurosci. 2012;32:13718–13728. doi: 10.1523/JNEUROSCI.5750-11.2012. [DOI] [PMC free article] [PubMed] [Google Scholar]
- Forsythe ID, Tsujimoto T, Barnes-Davies M, Cuttle MF, Takahashi T. Inactivation of presynaptic calcium current contributes to synaptic depression at a fast central synapse. Neuron. 1998;20:797–807. doi: 10.1016/S0896-6273(00)81017-X. [DOI] [PubMed] [Google Scholar]
- Foster KA, Regehr WG. Variance-mean analysis in the presence of a rapid antagonist indicates vesicle depletion underlies depression at the climbing fiber synapse. Neuron. 2004;43:119–131. doi: 10.1016/j.neuron.2004.06.022. [DOI] [PubMed] [Google Scholar]
- Fujimoto K, Kita H. Response characteristics of subthalamic neurons to the stimulation of the sensorimotor cortex in the rat. Brain Res. 1993;609:185–192. doi: 10.1016/0006-8993(93)90872-K. [DOI] [PubMed] [Google Scholar]
- Galvan A, Wichmann T. Pathophysiology of parkinsonism. Clin Neurophysiol. 2008;119:1459–1474. doi: 10.1016/j.clinph.2008.03.017. [DOI] [PMC free article] [PubMed] [Google Scholar]
- Garcia-Perez E, Lo DC, Wesseling JF. Kinetic isolation of a slowly recovering component of short-term depression during exhaustive use at excitatory hippocampal synapses. J Neurophysiol. 2008;100:781–795. doi: 10.1152/jn.90429.2008. [DOI] [PubMed] [Google Scholar]
- Hallworth NE, Bevan MD. Globus pallidus neurons dynamically regulate the activity pattern of subthalamic nucleus neurons through the frequency-dependent activation of postsynaptic GABAA and GABAB receptors. J Neurosci. 2005;25:6304–6315. doi: 10.1523/JNEUROSCI.0450-05.2005. [DOI] [PMC free article] [PubMed] [Google Scholar]
- Hatt H, Smith DO. Synaptic depression related to presynaptic axon conduction block. J Physiol. 1976;259:367–393. doi: 10.1113/jphysiol.1976.sp011471. [DOI] [PMC free article] [PubMed] [Google Scholar]
- Hefft S, Kraushaar U, Geiger JR, Jonas P. Presynaptic short-term depression is maintained during regulation of transmitter release at a GABAergic synapse in rat hippocampus. J Physiol. 2002;539:201–208. doi: 10.1113/jphysiol.2001.013455. [DOI] [PMC free article] [PubMed] [Google Scholar]
- Jenkinson N, Brown P. New insights into the relationship between dopamine, beta oscillations and motor function. Trends Neurosci. 2011;34:611–618. doi: 10.1016/j.tins.2011.09.003. [DOI] [PubMed] [Google Scholar]
- Jones HC, Keep RF. The control of potassium concentration in the cerebrospinal fluid and brain interstitial fluid of developing rats. J Physiol. 1987;383:441–453. doi: 10.1113/jphysiol.1987.sp016419. [DOI] [PMC free article] [PubMed] [Google Scholar]
- Jones HC, Keep RF. Brain fluid calcium concentration and response to acute hypercalcaemia during development in the rat. J Physiol. 1988;402:579–593. doi: 10.1113/jphysiol.1988.sp017223. [DOI] [PMC free article] [PubMed] [Google Scholar]
- Kirischuk S, Clements JD, Grantyn R. Presynaptic and postsynaptic mechanisms underlie paired pulse depression at single GABAergic boutons in rat collicular cultures. J Physiol. 2002;543:99–116. doi: 10.1113/jphysiol.2002.021576. [DOI] [PMC free article] [PubMed] [Google Scholar]
- Kita H. Responses of globus pallidus neurons to cortical stimulation: intracellular study in the rat. Brain Res. 1992;589:84–90. doi: 10.1016/0006-8993(92)91164-A. [DOI] [PubMed] [Google Scholar]
- Kolomiets BP, Deniau JM, Mailly P, Ménétrey A, Glowinski J, Thierry AM. Segregation and convergence of information flow through the cortico-subthalamic pathways. J Neurosci. 2001;21:5764–5772. doi: 10.1523/JNEUROSCI.21-15-05764.2001. [DOI] [PMC free article] [PubMed] [Google Scholar]
- Loucif KC, Wilson CL, Baig R, Lacey MG, Stanford IM. Functional interconnectivity between the globus pallidus and the subthalamic nucleus in the mouse brain slice. J Physiol. 2005;567:977–987. doi: 10.1113/jphysiol.2005.093807. [DOI] [PMC free article] [PubMed] [Google Scholar]
- Magill PJ, Bolam JP, Bevan MD. Relationship of activity in the subthalamic nucleus-globus pallidus network to cortical electroencephalogram. J Neurosci. 2000;20:820–833. doi: 10.1523/JNEUROSCI.20-02-00820.2000. [DOI] [PMC free article] [PubMed] [Google Scholar]
- Mallet N, Pogosyan A, Márton LF, Bolam JP, Brown P, Magill PJ. Parkinsonian beta oscillations in the external globus pallidus and their relationship with subthalamic nucleus activity. J Neurosci. 2008;28:14245–14258. doi: 10.1523/JNEUROSCI.4199-08.2008. [DOI] [PMC free article] [PubMed] [Google Scholar]
- Mallet N, Micklem BR, Henny P, Brown MT, Williams C, Bolam JP, Nakamura KC, Magill PJ. Dichotomous organization of the external globus pallidus. Neuron. 2012;74:1075–1086. doi: 10.1016/j.neuron.2012.04.027. [DOI] [PMC free article] [PubMed] [Google Scholar]
- Maurice N, Deniau JM, Glowinski J, Thierry AM. Relationships between the prefrontal cortex and the basal ganglia in the rat: physiology of the corticosubthalamic circuits. J Neurosci. 1998;18:9539–9546. doi: 10.1523/JNEUROSCI.18-22-09539.1998. [DOI] [PMC free article] [PubMed] [Google Scholar]
- Mercer JN, Chan CS, Tkatch T, Held J, Surmeier DJ. Nav1.6 sodium channels are critical to pacemaking and fast spiking in globus pallidus neurons. J Neurosci. 2007;27:13552–13566. doi: 10.1523/JNEUROSCI.3430-07.2007. [DOI] [PMC free article] [PubMed] [Google Scholar]
- Nambu A, Tokuno H, Hamada I, Kita H, Imanishi M, Akazawa T, Ikeuchi Y, Hasegawa N. Excitatory cortical inputs to pallidal neurons via the subthalamic nucleus in the monkey. J Neurophysiol. 2000;84:289–300. doi: 10.1152/jn.2000.84.1.289. [DOI] [PubMed] [Google Scholar]
- Nathan T, Jensen MS, Lambert JD. The slow inhibitory postsynaptic potential in rat hippocampal CA1 neurones is blocked by intracellular injection of QX-314. Neurosci Lett. 1990;110:309–313. doi: 10.1016/0304-3940(90)90865-7. [DOI] [PubMed] [Google Scholar]
- Nini A, Feingold A, Slovin H, Bergman H. Neurons in the globus pallidus do not show correlated activity in the normal monkey, but phase-locked oscillations appear in the MPTP model of parkinsonism. J Neurophysiol. 1995;74:1800–1805. doi: 10.1152/jn.1995.74.4.1800. [DOI] [PubMed] [Google Scholar]
- Paz JT, Deniau JM, Charpier S. Rhythmic bursting in the cortico-subthalamo-pallidal network during spontaneous genetically determined spike and wave discharges. J Neurosci. 2005;25:2092–2101. doi: 10.1523/JNEUROSCI.4689-04.2005. [DOI] [PMC free article] [PubMed] [Google Scholar]
- Raz A, Vaadia E, Bergman H. Firing patterns and correlations of spontaneous discharge of pallidal neurons in the normal and the tremulous 1-methyl-4-phenyl-1,2,3,6-tetrahydropyridine vervet model of parkinsonism. J Neurosci. 2000;20:8559–8571. doi: 10.1523/JNEUROSCI.20-22-08559.2000. [DOI] [PMC free article] [PubMed] [Google Scholar]
- Robinson HP, Kawai N. Injection of digitally synthesized synaptic conductance transients to measure the integrative properties of neurons. J Neurosci Methods. 1993;49:157–165. doi: 10.1016/0165-0270(93)90119-C. [DOI] [PubMed] [Google Scholar]
- Rouzaire-Dubois B, Hammond C, Hamon B, Feger J. Pharmacological blockade of the globus palidus-induced inhibitory response of subthalamic cells in the rat. Brain Res. 1980;200:321–329. doi: 10.1016/0006-8993(80)90923-3. [DOI] [PubMed] [Google Scholar]
- Ryan LJ, Clark KB. Alteration of neuronal responses in the subthalamic nucleus following globus pallidus and neostriatal lesions in rats. Brain Res Bull. 1992;29:319–327. doi: 10.1016/0361-9230(92)90063-4. [DOI] [PubMed] [Google Scholar]
- Saviane C, Silver RA. Fast vesicle reloading and a large pool sustain high bandwidth transmission at a central synapse. Nature. 2006;439:983–987. doi: 10.1038/nature04509. [DOI] [PubMed] [Google Scholar]
- Sharp AA, O'Neil MB, Abbott LF, Marder E. Dynamic clamp: computer-generated conductances in real neurons. J Neurophysiol. 1993;69:992–995. doi: 10.1152/jn.1993.69.3.992. [DOI] [PubMed] [Google Scholar]
- Shen KZ, Johnson SW. Presynaptic dopamine D2 and muscarine M3 receptors inhibit excitatory and inhibitory transmission to rat subthalamic neurones in vitro. J Physiol. 2000;525:331–341. doi: 10.1111/j.1469-7793.2000.00331.x. [DOI] [PMC free article] [PubMed] [Google Scholar]
- Shen KZ, Johnson SW. Presynaptic GABA(B) receptors inhibit synaptic inputs to rat subthalamic neurons. Neuroscience. 2001;108:431–436. doi: 10.1016/S0306-4522(01)00424-9. [DOI] [PubMed] [Google Scholar]
- Smith Y, Bolam JP, Von Krosigk M. Topographical and synaptic organization of the GABA-containing pallidosubthalamic projection in the rat. Eur J Neurosci. 1990;2:500–511. doi: 10.1111/j.1460-9568.1990.tb00441.x. [DOI] [PubMed] [Google Scholar]
- Smith Y, Bevan MD, Shink E, Bolam JP. Microcircuitry of the direct and indirect pathways of the basal ganglia. Neuroscience. 1998;86:353–387. doi: 10.1016/S0306-4522(98)00004-9. [DOI] [PubMed] [Google Scholar]
- Soares J, Kliem MA, Betarbet R, Greenamyre JT, Yamamoto B, Wichmann T. Role of external pallidal segment in primate parkinsonism: comparison of the effects of 1-methyl-4-phenyl-1,2,3,6-tetrahydropyridine-induced parkinsonism and lesions of the external pallidal segment. J Neurosci. 2004;24:6417–6426. doi: 10.1523/JNEUROSCI.0836-04.2004. [DOI] [PMC free article] [PubMed] [Google Scholar]
- Sorra KE, Harris KM. Occurrence and three-dimensional structure of multiple synapses between individual radiatum axons and their target pyramidal cells in hippocampal area CA1. J Neurosci. 1993;13:3736–3748. doi: 10.1523/JNEUROSCI.13-09-03736.1993. [DOI] [PMC free article] [PubMed] [Google Scholar]
- Stevens CF, Wang Y. Facilitation and depression at single central synapses. Neuron. 1995;14:795–802. doi: 10.1016/0896-6273(95)90223-6. [DOI] [PubMed] [Google Scholar]
- Swadlow HA, Bezdudnaya T, Gusev AG. Spike timing and synaptic dynamics at the awake thalamocortical synapse. Prog Brain Res. 2005;149:91–105. doi: 10.1016/S0079-6123(05)49008-1. [DOI] [PubMed] [Google Scholar]
- Tachibana Y, Iwamuro H, Kita H, Takada M, Nambu A. Subthalamo-pallidal interactions underlying parkinsonian neuronal oscillations in the primate basal ganglia. Eur J Neurosci. 2011;34:1470–1484. doi: 10.1111/j.1460-9568.2011.07865.x. [DOI] [PubMed] [Google Scholar]
- Telgkamp P, Padgett DE, Ledoux VA, Woolley CS, Raman IM. Maintenance of high-frequency transmission at purkinje to cerebellar nuclear synapses by spillover from boutons with multiple release sites. Neuron. 2004;41:113–126. doi: 10.1016/S0896-6273(03)00802-X. [DOI] [PubMed] [Google Scholar]
- Urbain N, Gervasoni D, Soulière F, Lobo L, Rentéro N, Windels F, Astier B, Savasta M, Fort P, Renaud B, Luppi PH, Chouvet G. Unrelated course of subthalamic nucleus and globus pallidus neuronal activities across vigilance states in the rat. Eur J Neurosci. 2000;12:3361–3374. doi: 10.1046/j.1460-9568.2000.00199.x. [DOI] [PubMed] [Google Scholar]
- Urbain N, Rentéro N, Gervasoni D, Renaud B, Chouvet G. The switch of subthalamic neurons from an irregular to a bursting pattern does not solely depend on their GABAergic inputs in the anesthetic-free rat. J Neurosci. 2002;22:8665–8675. doi: 10.1523/JNEUROSCI.22-19-08665.2002. [DOI] [PMC free article] [PubMed] [Google Scholar]
- Wichmann T, Bergman H, DeLong MR. The primate subthalamic nucleus: I. Functional properties in intact animals. J Neurophysiol. 1994;72:494–506. doi: 10.1152/jn.1994.72.2.494. [DOI] [PubMed] [Google Scholar]
- Wichmann T, DeLong MR, Guridi J, Obeso JA. Milestones in research on the pathophysiology of Parkinson's disease. Mov Disord. 2011;26:1032–1041. doi: 10.1002/mds.23695. [DOI] [PMC free article] [PubMed] [Google Scholar]
- Wong AY, Graham BP, Billups B, Forsythe ID. Distinguishing between presynaptic and postsynaptic mechanisms of short-term depression during action potential trains. J Neurosci. 2003;23:4868–4877. doi: 10.1523/JNEUROSCI.23-12-04868.2003. [DOI] [PMC free article] [PubMed] [Google Scholar]
- Xu J, Wu LG. The decrease in the presynaptic calcium current is a major cause of short-term depression at a calyx-type synapse. Neuron. 2005;46:633–645. doi: 10.1016/j.neuron.2005.03.024. [DOI] [PubMed] [Google Scholar]