

Abstract
The activin A-myostatin-follistatin system is thought to play an important role in the regulation of muscle and bone mass throughout growth, development, and aging; however, the effects of these ligands on progenitor cell proliferation and differentiation in muscle and bone are not well understood. In addition, age-associated changes in the relative expression of these factors in musculoskeletal tissues have not been described. We therefore examined changes in protein levels of activin A, follistatin, and myostatin (GDF-8) in both muscle and bone with age in C57BL6 mice using ELISA. We then investigated the effects of activin A, myostatin and follistatin on the proliferation and differentiation of primary myoblasts and mouse bone marrow stromal cells (BMSCs) in vitro. Myostatin levels and the myostatin:follistatin ratio increased with age in the primarily slow-twitch mouse soleus muscle, whereas the pattern was reversed with age in the fast-twitch extensor digitorum longus muscle. Myostatin levels and the myostatin: follistatin ratio increased significantly (+75%) in mouse bone marrow with age, as did activin A levels (+17%). Follistatin increased the proliferation of primary myoblasts from both young and aged mice, whereas myostatin increased proliferation of younger myoblasts but decreased proliferation of older myoblasts. Myostatin reduced proliferation of both young and aged BMSCs in a dose-dependent fashion, and activin A increased mineralization in both young and aged BMSCs. Together these data suggest that aging in mice is accompanied by changes in the expression of activin A and myostatin, as well as changes in the response of bone and muscle progenitor cells to these factors. Myostatin appears to play a particularly important role in the impaired proliferative capacity of muscle and bone progenitor cells from aged mice.
Keywords: sarcopenia, myoblasts, bone marrow stromal cells, proliferation, differentiation
1. Introduction
Aging is associated with a number of changes in the musculoskeletal system, including progressive deterioration of articular cartilage in the form of osteoarthritis, loss of muscle mass in the form of sarcopenia, and loss of bone density and strength in the form of osteoporosis. Muscle weakness and frailty contribute directly to postural instability, which in turn increases the risk for falls, and falls are the main etiological factor in more than 90% of bone fractures. The more than 1.5 million osteoporotic fractures a year in the US place significant burden on the healthcare system, and also contribute to significant morbidity and poor quality of life. Treatments that can improve muscle strength and at the same time increase bone mass will therefore significantly reduce fracture-related morbidity and mortality.
The activin A-myostatin-follistatin system is believed to play an important role in musculoskeletal growth, development and aging. Myostatin (GFD-8) and activin A bind type II activin receptors and signal through a transforming growth factor-beta signaling pathway involving SMAD phosphorylation. Activin is thought to bind with greater affinity to the type IIA activin receptor (ActRIIA) and myostatin to the type II B receptor (ActRIIB), but both are involved in the regulation of muscle mass (Gilson et al., 2009; Lee et al., 2010). Follistatin antagonizes both myostatin and activin A activity, and mice overexpressing follistatin in skeletal muscle show a more dramatic phenotype than mice lacking myostatin alone (Lee et al., 2005). These data suggest that alterations in either myostatin or activin A with aging or disuse can have significant effects on muscle mass, and these may be further influenced by relative levels of follistatin. Although myostatin is not highly expressed by bone cells, loss of myostatin function is associated with increased bone density in mice (Morissette et al., 2009; Elkasrawy and Hamrick, 2010). The increased bone density of mice lacking myostatin is likely multifactorial, and may result not only from the indirect effects of increased muscle mass (Hamrick, 2011, 2012) but also from increased circulating levels of IGF-1 (Williams et al., 2011). The type IIA and type IIB activin receptors are both expressed by chondrocytes and osteoblasts, and activin A has been observed to inhibit mineralization by osteoblasts in vitro whereas follistatin can increase mineralization (Eijken et al., 2007). Furthermore, inhibiting activin A in vivo using a decoy soluble activin A receptor (ActRIIA) increases bone formation in mice (Pearsall et al., 2008).
The activin A-myostatin-follistatin system therefore appears to play a number of important roles in muscle as well as in bone metabolism. Although some studies have found no association between age and myostatin transcript levels in skeletal muscle (Marcell et al., 2001), others reveal a marked elevation in skeletal muscle myostatin expression with aging in humans (Leger et al., 2008). Additional research suggests that circulating levels of myostatin increase with age in men and women, and are highest in people aged 60-90 (Yarasheski et al., 2002). The latter finding may implicate myostatin in the sarcopenia of aging, hence myostatin inhibitors could be useful pharmacological agents for treating age-related muscle atrophy as well as bone loss. Indeed, a myostatin inhibitor has been shown to improve muscle regeneration in aged mice (Siriett et al., 2007), and a recent study reveals that muscle-derived stem cells from older male patients show a +65% higher level of myostatin expression compared to stem cells from younger patients (McKey et al., 2012). Myostatin levels can also be reduced in skeletal muscle with resistance exercise in older men (Dalbo et al., 2011), and aerobic exercise can decrease myostatin expression in older women (Konopka et al., 2010). While there has been considerable interest in the role of myostatin in musculoskeletal changes with aging, much less is known about activin A and follistatin. Circulating activin A levels have been observed to increase with age, whereas circulating follistatin levels did not show age-associated changes (Baccarelli et al., 2001; Hurwitz and Santoro, 2004). Very little information exists, however, with regard to tissue-specific changes in activin A and follistatin levels with aging or how the response of muscle and bone cells to these factors is altered with age.
We have previously shown that aged C57BL/6 mice share a number of key features in common with the aging human musculoskeletal system including an age-related decline muscle mass, both absolutely and relative to body mass, as well as loss of bone density, bone formation, and bone strength (Hamrick et al., 2006). In order to address several of the questions outlined above we examined age-related changes in the expression of activin A, follistatin, and myostatin in mouse skeletal muscle as well as in mouse bone marrow supernatant. We also investigated the response of primary muscle and bone cells from young (12 months) and aged (24 months) mice to activin A, follistatin, and myostatin treatment in vitro.
2. Materials and Methods
2.1 Animals
C57BL6 mice were purchased from aged rodent colony at National Institute on Aging, National Institutes of Health (USA) at 12 and 24 months of age and delivered to Georgia Health Sciences University, Augusta, GA. Animals were allowed to acclimate for approximately two weeks and were maintained at the Laboratory Animal Service Facility of the Georgia Health Sciences University. Animals were sacrificed by CO2 overdose and thoracotomy following procedures approved by the the Institutional Animal Care and Use Committee of Georgia Health Sciences University.
2.2 ELISA assays
Whole extensor digitorum longus or soleus muscle were dissected from C57BL6 mice at either 12 or 24 months of age and snap-frozen in liquid nitrogen. Each muscle was placed in 1mL phosphate buffered saline (PBS) and subjected to homogenization using Fisherbrand Tissuemiser® rotary homogenizer until large pieces of muscle were no longer visible. Samples were subjected to two freeze-thaw cycles to disrupt the plasma membrane then centrifuged briefly. Samples were separated into 250μl aliquots and stored at −80°C until assayed. Follistatin and Activin A ELISA kits were purchased from R&D Systems and assays performed according to manufacturer's protocol without sample dilution. Myostatin ELISA kits were purchased from Alpco diagnostic and also performed according to manufacturer's protocol, but samples for myostatin assay were diluted 5-fold. Total protein was measured for each sample using Pierce BCA Protein Assay Kit (Thermo Scientific) according to manufacturer's protocol. Briefly: after thawing samples for ELISA, 25 μl of sample was incubated undiluted with 200μl of Pierce® working reagent for 20 minutes at 37° C. Absorbance was recorded at 590 nm wavelength and total protein concentrations were calculated based on standard curve generated with bovine serum albumin.
Left and right femora were dissected from C57BL6 mice at either 12 or 24 months of age and placed in PBS. Samples were immediately minced using fine-point surgical scissors. Samples were vortexed vigorously and triturated with a pipette to liberate marrow from bone. Samples were centrifuged briefly, supernatant was collected, and bone fragments were discarded. Supernatant was centrifuged at 1500g for 5 minutes to pellet cells. Supernatant was collected, aliquotted, and stored at −80°C until assayed. Specific ELISA assays and total protein were performed and measured as described above for skeletal muscle homogenates.
2.3 Primary myoblast isolation, culture, and proliferation and differentiation assays
Mice 12 and 24 months of age were euthanized and tibialis anterior muscle dissected and place in sterile PBS. The muscle was minced with a sterile scalpel under aseptic conditions. Minced muscle was digested in 0.2% collagenase type II (Gibco) for 1 hour with frequent shaking followed by digestion in 1× trypsin for 30 minutes. The slurry was pelletted and trypsin supernatant removed. The slurry was re-suspended in proliferation medium. Upon completion of enzymatic digest, slurry was poured over a 70μm cell strainer (Fisher) to remove any remaining connective tissue. The cells were then added to collagen type I (BD Bioscience) coated T-25 flasks.
Primary myoblasts were allowed to attach for 72 hours. Cells were then maintained in proliferation medium (PM): DMEM (Hyclone) supplemented with 10% fetal bovine serum, 10% horse serum, 1% penicillin / streptomycin, and 0.5% chick embryo extract (Sera Labs U.K.). Medium was changed every 48 hours until T-25 flask was confluent. Once confluent, cells were trypsinized and counted using NucleoCounter (New Brunswick Scientific). Cells were then plated in a 96 well plate at 5,000 cells/cm2. Cells were allowed to attach in proliferation medium for 48 hours. Proliferation medium was removed, cells washed with PBS, and DMEM supplemented with 1% insulin-transferrin-sodium selenite (ITS) was added followed by either control (PBS) or high or low dose activin A (50 ng/ml, 100 ng/ml), follistatin (100 ng/ml, 1000 ng/ml) or myostatin (100 ng/ml, 1000 ng/ml) (R&D Systems, Minneapolis). Doses follow those utilized by He et al. (2005) for activin A and Zhu et al. (2007) for myostatin and follistatin. After 24 h of treatment, MTS reagent was added according to the manufacturer's protocol (Promega, Madison) and absorbance at 492 nm was read 2 h later.
For differentiation assays, cells were isolated and cultured for one week until confluent as described above. Cells were then trypsinized and plated in 12 well plates at 5,000 cells/ml and allowed to attach overnight in proliferation medium. PM was removed, cells washed with PBS, and DMEM-supplemented with 1% ITS was added followed by the addition of Mstn, Fstn, Activin A or control. Cells were maintained in treatment for 48 hour then harvested in TRIZOL® reagent (Invitrogen) for RNA isolation and subsequent cDNA synthesis (Bio-Rad). 50-100 ng of cDNA was amplified in duplicates in each 40-cycle reaction using an iCycler™ (Bio-Rad) with annealing temperature set at 60°C, ABsolute™ QPCR SYBR® Green Fluorescein Mix (ABgene, Thermo Fisher Scientific), and custom-designed qRT-PCR primers (Table 1). A melt curve was used to assess the purity of amplification products. mRNA levels were normalized to β-Actin/18S and gene expression was calculated as fold change using the comparative CT method. If not otherwise indicated, treated groups were compared to PBS control groups.
Table 1.
List of oligonucleotide primer sequences for qRT-PCR.
| Name | Sequence | Amplicon Size |
|---|---|---|
| Myogenin | Fwd: GGAAGTCTGTGTCGGTGGAC | 150 |
| Rev: CGCTGCGCAGGATCTCCAC | ||
| MyoD | Fwd: GCCTGAGCAAAGTGAATGAG | 184 |
| Rev: GGTCCAGGTGCGTAGAAGG | ||
| Myosin, heavy polypeptide 3 (Myh3) | Fwd: ACAGTCAGAGGTGTGACTCAGCCG | 90 |
| Rev: CCGACTTGCGGAGGAAAGGTGC | ||
| BMP-2 | Fwd: TGTTTGGCCTGAAGCAGAGA | 83 |
| Rev: TGAGTGCCTGCGGTACAGAT | ||
| Osteocalcin | Fwd: ATTTAGGACCTGTGCTGCCCTA | 120 |
| Rev: GGAGCTGCTGTGACATCCATAC |
2.4 Primary bone marrow stromal cell (BMSC) isolation, culture, and proliferation and differentiation assays
Bone marrow aspirates were flushed from mouse femora and tibias and BMSCs isolated using magnetic bead sorting as previously described (Zhang et al., 2008). Briefly, magnetic nanoparticles conjugated to anti-mouse CD11b, CD11c, CD45R/B220, and Pan DC monoclonal antibodies were used to remove hematopoietic-lineage cells and those that were negative for these four antigens remained in the solution and were collected and subjected to a round of positive-selection using anti-Sca-1 microbeads.
Enriched BMSCs were cultured in proliferation medium (DMEM supplemented with 10% heat-inactivated FBS) in T-75 flasks until ∼80% confluent. Cells were then lifted with trypsin/EDTA, plated in 96-well plates at a density of 5,000 cells/well in proliferation medium, and allowed to attach for 24 h. Proliferation medium was removed, cells washed with PBS, and DMEM supplemented with 2% heat-inactivated FBS (for BMSCs) was added followed by control (PBS), activin A, follistatin, or myostatin (all from R&D Systems, Minneapolis) at the same doses noted above for primary myoblasts. After 24 h of treatment, MTS reagent was added according to the manufacturer's protocol (Promega, Madison, WI) and absorbance at 492 nm was read 2 h later.
Osteogenic differentiation and Alizarin Red S (ARS) staining was performed as described previously (Zhang et al., 2008). In brief, enriched BMSCs were plated in 24-well plates at a density of 5,000 cells/cm2 in proliferation medium and allowed to attach for 24 h. Cells were then treated with osteogenic induction medium (DMEM supplemented with 5% FBS, 0.25 mM ascorbic acid, 0.1 μM dexamethasone, and 10 mM β-glycerophosphate (all from Sigma-Aldrich) for 14 d. For ARS staining, differentiated BMSCs were washed with PBS and fixed in 3% paraformaldehyde (Sigma-Aldrich) for 30 min. Cells were stained with 40 mM ARS pH 4.1 (Sigma-Aldrich) for 15 min followed by washing with excess dH2O. Stained plates were scanned for visualization. For quantitative destaining, 10% acetic acid was added for 30 min. Samples were transferred to a 1.5 ml microcentrifuge tube, overlaid with mineral oil (Sigma-Aldrich), heated to 85°C for 10 min, and transferred to ice for 5 min. Following centrifugation at 14,000 rpm for 15 min, supernatants were removed and neutralized with 10% ammonium hydroxide. Aliquots were transferred to a 96-well plate and absorbance was read at 405 nm (Gregory et al., 2004). Expression of osteogenic genes was assessed using primers for bone morphogenetic protein-2 (BMP-2) and osteocalcin (OCN) shown in Table 1.
2.5 Statistical Analysis
Two-factor ANOVAs were performed with treatment and age as the two factors. Fisher's least significant difference (LSD) test was used for post-hoc, pairwise comparisons. All statistical analyses were performed using SYSTAT® software.
3. Results
3.1 Protein levels of activin A, myostatin, and follistatin in skeletal muscle
ANOVAs performed on activin A and follistatin normalized for total protein, and the ratio of normalized activin A: follistatin, revealed no significant changes with age in either the soleus or extensor digitorum longus muscles. Levels of normalized myostatin showed a slight but nonsignificant decrease in the EDL with age (Fig. 1A), whereas SOL showed a significant increase in normalized myostatin with age (Fig. 1A). Likewise, the ratio of normalized myostatin: follistatin showed a significant (∼40%) decrease with age in EDL (Fig. 1B), but a significant (∼four-fold) increase with age in SOL (Fig. 1B). Two-factor ANOVA with age (12 or 24 mo) and muscle (EDL or SOL) as the two factors showed significant age*muscle interaction effects for both normalized myostatin (p<.05) and the myostatin: follistatin ratio (p<.01), with myostatin levels decreasing with age in the EDL but increasing with age in SOL.
Fig. 1.


Myostatin protein normalized to total protein (A) and the ratio of normalized myostatin to follistatin (B) in the extensor digitorum longus muscle (EDL) and soleus (SOL) of mice 12 months of age (12 mo) and 24 months of age (24 mo). Myostatin levels decline with age in the EDL but increase with age in the soleus. Error bars represent one standard deviation and sample size includes six replicates per group.
3.2 Effects of activin A, myostatin, and follistatin on the proliferation and differentiation of primary myoblasts
Overall there was a significant (P<.01) age effect for both myostatin and follistatin treatment, in which young cells were more proliferative in response to treatment than older cells. ANOVAs showed significant treatment effects for activin A, myostatin, and follistatin (Fig. 2A). Activin A produced a significant dose-response increase in proliferation in myoblasts from younger mice but not older mice; however, the treatment*age interaction was not significant. Follistatin also increased proliferation in dose-response manner in young myoblasts, but the effect was attenuated in myoblasts from older mice (Fig. 2B). There was a significant (p=.001) treatment*age interaction effect for follistatin treatment where the treatment effect, approximately two-fold at the highest dose, was much greater in younger myoblasts compared to older cells. Myostatin treatment also increased proliferation in young myoblasts compared to untreated cells, whereas in older myoblasts myostatin decreased proliferation at the low dose (Fig. 2C). There was also a significant (p<.001) treatment*age interaction effect for myostatin, where myostatin treatment increased proliferation in young myoblasts but decreased proliferation in the older cells.
Fig. 2.
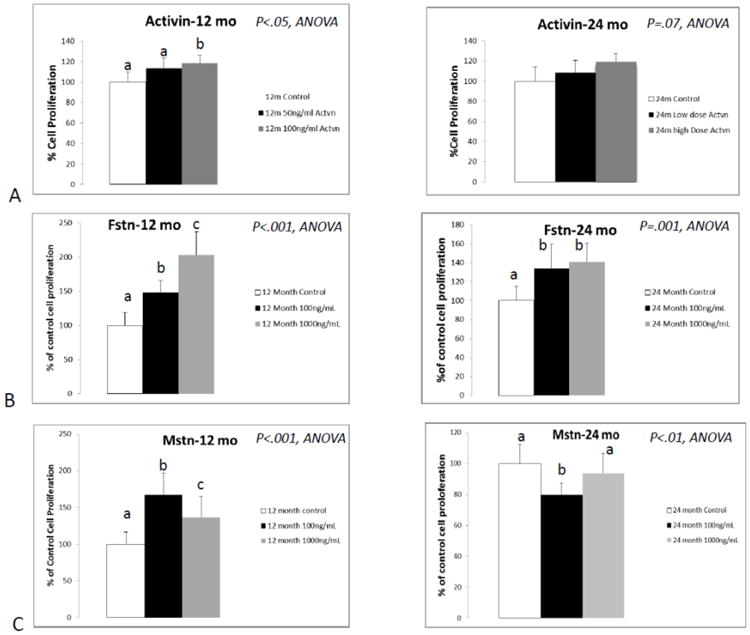
Results of proliferation assays following treatment of primary myoblasts with activin A (A; activin), follistatin (B; Fstn), and myostatin (C; Mstn). Means with different superscripts differ significantly from one another (P<.05). Error bars represent one standard deviation and sample size includes eight replicates per group.
RT-PCR data revealed no marked changes in the expression of differentiation markers MyoD, myogenin, or myosin heavy chain (MHC) with Activin A treatment. MyoD and MHC expression were also unaffected by follistatin treatment of young and aged myoblasts; however, follistatin stimulated a significant increase in myogenin expression in aged but not young myoblasts (Fig. 3A). ANOVAs demonstrated a significant age effect for myogenin expression (p<.05) with older cells generally showing higher levels of myogenin expression, and there was also a significant treatment * age interaction for myogenin expression. Myostatin treatment had no effect on MyoD or myogenin expression in either young or aged myoblasts, but myostatin did produce a significant increase in MHC expression in aged but not young myoblasts (Fig. 3B).
Fig. 3.

Real-time PCR data for primary myoblast expression of myogenin (A) and myosin heavy chain (B) in response to treatment with follistatin (Fstn, top) and myostatin (Mstn, bottom). Means with different superscripts differ significantly from one another (P<.05). Error bars represent one standard deviation and sample size includes four-six replicates per group.
3.3 Protein levels of activin A, myostatin, and follistatin in bone marrow supernatants
Comparisons of normalized protein levels obtained from bone marrow supernatant revealed no significant differences between older and young mice for activin A, follistatin, or the activin A: follistatin ratio. Normalized myostatin is significantly (∼80%) increased in mouse bone marrow with increasing age (Fig. 4A), as is the ratio of normalized myostatin: follistatin (+60%; Fig. 4B).
Fig. 4.


Myostatin protein normalized to total protein (A) and the ratio of normalized myostatin to follistatin (B) in bone marrow supernatants from mice 12 months of age (12 mo) and 24 months of age (24 mo). Error bars represent one standard deviation and sample size includes six replicates per group.
3.4 Effects of activin A, myostatin, and follistatin on the proliferation and differentiation of primary bone marrow stromal cells (BMSCs)
ANOVAs showed a significant (P<.001) age effect in each treatment group, with younger BMSCs overall having higher values for proliferation than older BMSCs, irrespective of the treatment (Fig. 5). Proliferation assays showed no effects of activin treatment on either young or old BMSCs (Fig. 5A). Two-factor ANOVA revealed a significant treatment*age interaction for follistatin, with follistatin having no impact on proliferation in older BMSCs but reducing proliferation in young BMSCs (Fig. 5B). Myostatin significantly decreased BMSC proliferation in both young cells (−15%) and aged cells (−40%); however, this effect was greater in the aged cells, and this treatment*age interaction was also significant (P<.05) for myostatin (Fig. 5C).
Fig. 5.
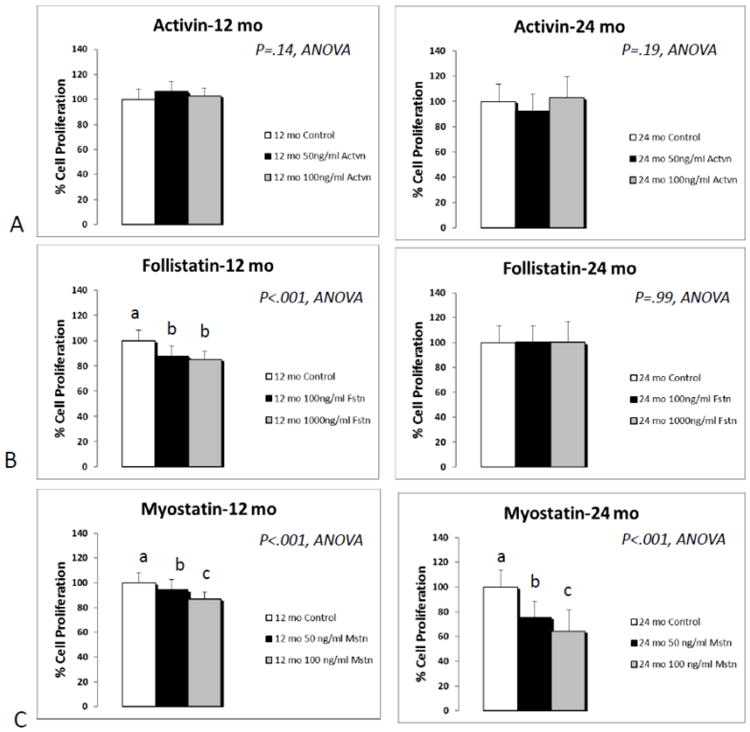
Results of proliferation assays following treatment of primary bone marrow stromal cells (BMSCs) with activin A (A; activin), follistatin (B; Fstn), and myostatin (C; Mstn). Means with different superscripts differ significantly from one another (P<.05). Error bars represent one standard deviation and sample size includes eight replicates per group.
Differentiation assays using alizarin red staining to detect mineralization revealed that activin treatment significantly increased mineralization of young and older BMSCs (Fig. 6). The effect of age on mineralization was significant (P<.001) for activin, with the younger cells consistently showing greater mineralization in response to treatment. Treatment effects were less pronounced in aged BMSCs, with the low dose of activin increasing alizarin red staining but the other doses showing no significant effect (Fig. 6C, D). The treatment*age interaction was significant (P<.01) for activin using two-factor ANOVA. In the myostatin experiments, the higher dose of myostatin significantly decreased mineralization in younger cells but not in older cells, and the treatment*age interaction was also significant for myostatin (P<.01). Finally, follistatin treatment did not significantly affect mineralization either young or older BMSCS (Fig. 6).
Fig. 6.
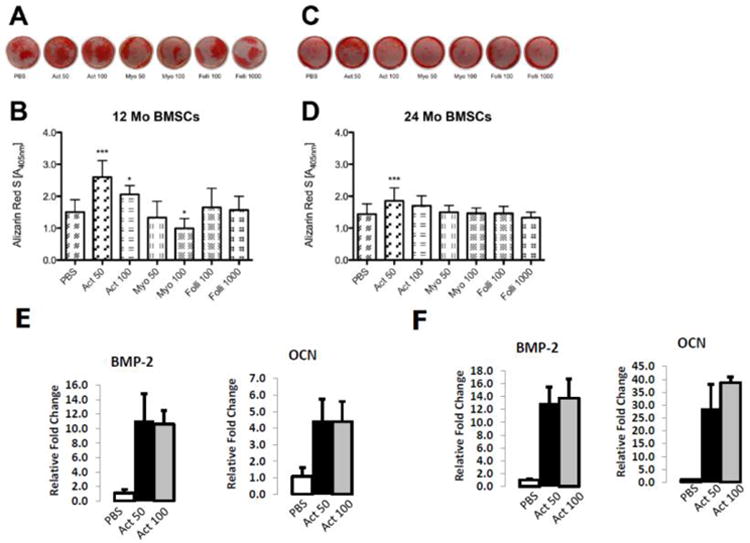
Alizarin red staining of bone marrow stromal cells cultured in osteogenic conditions (A-D) and PCR data for osteogenic genes (E-F) from BMSCs treated with activin A. Images of wells (A, C) and quantification of staining (B, D) in BMSCs from young mice (A, B; 12 Mo BMSCs) and older mice (C, D; 24 Mo BMSCs) treated with Activin A (Act), Myostatin (Myo) or Follistatin (Folli) at 50 ng/ml (50), 100 ng/ml (100) or 1000 ng/ml (1000). ***P<.001, *P<.05 relative to same-aged PBS controls. Error bars represent one standard deviation and sample size includes sixteen replicates per group for panels A-D. PCR data show elevated expression of osteogenic genes BMP-2 and osteocalcin (OCN) in activin-treated cells from mice 12 months of age (E) and mice 24 months of age (F). Error bars represent one standard deviation and four replicates are included per treatment group.
4. Discussion
The ELISA assays using muscle and bone samples from aged mice provided results that were unexpected for two reasons. First, it is well-known that fast-twitch (type II) muscle fibers atrophy with age (Holloszy et al., 1991) and a number of studies have implicated myostatin in muscle atrophy (McKay et al., 2012). In addition, Hennebry et al. (2009) found that mice lacking myostatin showed an increase in type I fibers and decrease in type II fibers, and blocking myostatin function in vivo using a myostatin antibody has been shown to increases type II fiber size in aging mice (Murphy et al., 2010). The fact that we observed a decline in myostatin levels with age in the predominantly fast-twitch extensor digitorum longus muscle of mice, but a relative increase in myostatin levels in the slow-twitch (type I) soleus, was therefore not anticipated. Nevertheless, it has been shown that mice lacking myostatin lose the same percentage of muscle mass with age as normal mice (Morissette et al., 2009), and muscles composed of different fiber types are all larger in aged myostatin-deficient mice compared to those of same-aged wild-type mice (Jackson et al., 2012). Given that both myostatin levels and the myostatin:follistatin ratio increased with age in soleus muscles of mice compared to extensor digitorum longus, myostatin inhibitors may have a greater impact on preserving muscle mass with age in those muscles composed predominantly of slow- rather than fast-twitch fibers.
The second in vivo finding that was also unexpected was the significant rise in myostatin protein with age in bone marrow supernatants. This was not expected because myostatin is primarily secreted by muscle and not by osteoblasts or marrow stromal cells. Yarasheski et al. (2002) did, however, find that serum myostatin increased with age in older women, and Szulc et al. (2012) found that serum myostatin increased in men until age 57 and then declined. The rise in bone marrow myostatin that we observed with age in mice likely reflects an increase in circulating myostatin levels with age. The elevated concentrations of myostatin in the bone marrow microenvironment of aged mice is significant given the findings discussed below regarding the effects of myostatin on proliferation of bone marrow stromal cells. Moreover, while myostatin was found to be most highly expressed in skeletal muscle progenitors early in development (McPherron et al., 1997), data presented here and elsewhere suggest that myostatin levels may rise again later in life. Thus, the interplay among activin A, myostatin, and follistatin is dynamic and changes across the aging spectrum.
The cell proliferation experiments yielded findings that were consistent with those of previous studies with regard to the effects of age and treatment. First, in both primary myoblasts and BMSCs, age effects were significant regardless of treatment. That is, aged myoblasts and BMSCs were less proliferative overall in response to treatment whether the cells were exposed to activin A, myostatin, or follistatin. This does not appear to be related to expression of ActRIIB, since we have observed using PCR (data not shown) that ActRIIB expression does not differ significantly either between muscle and bone cells of mice at similar ages, or between musculoskeletal tissues of young versus aged mice. Second, in the case of primary myoblasts, all of the ligands generally increased proliferation of young myoblasts at lower doses. Activin A was previously found to suppress embryonic muscle development in chicks (He et al., 2005), and to inhibit proliferation of stem cells derived from adult muscle (Nomura et al., 2008). Myostatin has also been shown previously to be a potent inhibitor of myoblast proliferation (McFarlane et al., 2011), and while myostatin increased proliferation of young myoblasts it decreased proliferation of aged myoblasts. The effects of these ligands on proliferation were quite different in BMSCs, where follistatin and myostatin both suppressed proliferation of young BMSCs, and myostatin significantly suppressed the proliferation of aged BMSCs. These data are consistent with our previous findings showing that BMSCs of mice lacking myostatin were more proliferative in vitro than those from normal mice (Elkasrawy et al., 2011). Probably the most important observation from these in vitro experiments is that, in the case of both aged myoblasts and aged BMSCs, myostatin consistently suppressed cell proliferation. Aged muscle precursors have an impaired capacity for proliferation (Conboy et al., 2003; Machida and Booth, 2004), as do aged BMSCs (Kretlow et al., 2008). Blocking myostatin function in aged animals may therefore have significant potential for improving the repair and regeneration of both muscle and bone by improving the proliferative capacity of both myo- and osteo-progenitor cells.
Findings from our differentiation assays are generally consistent with the idea that myostatin inhibits proliferation and promotes terminal differentiation of aged myoblasts, as myostatin treatment increased myosin heavy chain expression in aged myoblasts. The osteoblast differentiation and mineralization assays revealed that while activin A increased mineralization, myostatin exposure suppressed mineralization in vitro (Fig. 6). These experiments where BMSCs were treated with myostatin are also consistent with our previous studies using BMSCs from myostatin-deficient mice, which showed that Mstn−/− BMSCs had an increased capacity for mineralization in vitro and impaired potential for adipocyte differentiation (Hamrick et al., 2007; Kellum et al., 2009). The activin A differentiation experiments with BMSCs differ somewhat from those of Eijken et al. (2007) who found that activin A treatment strongly inhibited mineralization in osteoblast cultures, whereas follistatin increased mineralization. Our data, on the other hand, showed that osteogenic culture of BMSCs in the presence of activin A increased mineralization whereas follistatin had no effect on mineralization in either young or old BMSCs. It is likely that our findings differ from those of Eijken et al. (2007) because our experiments examined the effects of activin A and follistatin on the differentiation of osteoprogenitors, whereas Eijken et al. treated differentiated osteoblasts. It is therefore important to acknowledge here that, while our study examined the proliferation and differentiation of progenitor cell populations, ligands of the activin A-myostatin-follistatin system may have different effects on target cells at different stages of development, differentiation, and maturation.
5. Conclusions
Our experiments using aged mice as a model system for investigating the role of activin A, myostatin, and follistatin in musculoskeletal aging suggest that these ligands are likely to be involved in the altered capacity for tissue formation and repair that is observed in aged rodents and humans. Specifically, primary myoblasts and bone marrow stromal cells of aged animals were found to be less proliferative than those of younger animals in response to most of the treatments utilized. Myostatin levels in bone marrow and in soleus muscles increased with age in mice, and myostatin treatment suppressed proliferation of both aged myoblasts and aged BMSCs. Myostatin also inhibited mineralization of BMSCs under osteogenic culture conditions. Together these data suggest that targeting myostatin in aged animals may improve the proliferative capacity of muscle and bone progenitor cells, perhaps enhancing the potential for muscle and bone repair and regeneration in the therapeutic setting.
Highlights.
Activin A, follistatin, and myostatin were studied in aging muscle and bone
Myostatin levels increased with age in muscle and bone marrow
Myostatin decreased proliferation of aged muscle and bone cells
Acknowledgments
Funding for this research was provided by the Congressionally Directed Medical Research Programs, Department of the Army (CDMRP093619) and the National Institute on Aging (P01 AG036675).
Footnotes
Publisher's Disclaimer: This is a PDF file of an unedited manuscript that has been accepted for publication. As a service to our customers we are providing this early version of the manuscript. The manuscript will undergo copyediting, typesetting, and review of the resulting proof before it is published in its final citable form. Please note that during the production process errors may be discovered which could affect the content, and all legal disclaimers that apply to the journal pertain.
References
- Baccarelli A, Morpurgo P, Corsi A, Vaghi I, Fanelli M, Cremonesi G, Vaninetti S, Beck-Peccoz P, Spada A. Activin A serum levels and aging of the pituitary-gonadal axis: a cross-sectional study in middle-aged and elderly healthy subjects. Exp Gerontol. 2001;36:1403–12. doi: 10.1016/s0531-5565(01)00117-6. [DOI] [PubMed] [Google Scholar]
- Conboy I, Conboy MJ, Smythe G, Rando TM. Notch-mediated restoration of regenerative potential to aged muscle. Science. 2003;302:1575–177. doi: 10.1126/science.1087573. [DOI] [PubMed] [Google Scholar]
- Dalbo VJ, Roberts MD, Sunderland KL, Poole CN, Stout JR, Beck TW, Bemben M, Kerksick CM. Acute loading and aging effects on myostatin pathway biomarkers in human skeletal muscle after three sequential bouts of resistance exercise. J Gerontol A Biol Sci Med Sci. 2011;66:855–65. doi: 10.1093/gerona/glr091. [DOI] [PubMed] [Google Scholar]
- Eijken M, Swagemakers S, Koedam M, Steenbergen C, Derkx P, Uitterlinden AG, van der Spek PJ, Visser JA, de Jong FH, Pols HA, van Leeuwen JP. The activin A-follistatin system: potent regulator of human extracellular matrix mineralization. FASEB J. 2007;21:2949–60. doi: 10.1096/fj.07-8080com. [DOI] [PubMed] [Google Scholar]
- Elkasrawy MN, Hamrick MW. Myostatin (GDF-8) as a key factor linking muscle mass and bone structure. J Musculoskelet Neuronal Interact. 2010;10:56–63. [PMC free article] [PubMed] [Google Scholar]
- Elkasrawy MN, Fulzele S, Bowser M, Wenger K, Hamrick MW. Myostatin (GDF-8) inhibits chondrogenesis and chondrocyte proliferation in vitro by suppressing Sox-9 expression. Growth Factors. 2011;29:253–62. doi: 10.3109/08977194.2011.599324. [DOI] [PMC free article] [PubMed] [Google Scholar]
- Gilson H, Schakman O, Kalista S, Lause P, Tsuchida K, Thissen JP. Follistatin induces muscle hypertrophy through satellite cell proliferation and inhibition of both myostatin and activin. Am J Physiol Endocrinol Metab. 2009;297:E157–64. doi: 10.1152/ajpendo.00193.2009. [DOI] [PubMed] [Google Scholar]
- Gregory CA, Gunn WG, Peister A, Prockop DJ. An Alizarin red-based assay of mineralization by adherent cells in culture: comparison with cetylpyridinium chloride extraction. Anal Biochem. 2004;329:77. doi: 10.1016/j.ab.2004.02.002. [DOI] [PubMed] [Google Scholar]
- Hamrick MW, Ding KH, Pennington C, Chao YJ, Wu YD, Howard B, Immel D, Borlongan C, McNeil PL, Bollag WB, Curl WW, Yu J, Isales CM. Age-related loss of muscle mass and bone strength in mice is associated with a decline in physical activity and serum leptin. Bone. 2006;39:845–853. doi: 10.1016/j.bone.2006.04.011. [DOI] [PubMed] [Google Scholar]
- Hamrick MW. A role for myokines in muscle-bone interactions. Exercise & Sports Science Reviews. 2011;39:43–47. doi: 10.1097/JES.0b013e318201f601. [DOI] [PMC free article] [PubMed] [Google Scholar]
- Hamrick MW. The skeletal muscle secretome: an emerging player in muscle-bone crosstalk. Nature Bonekey. 2012;60:1–5. doi: 10.1038/bonekey.2012.60. [DOI] [PMC free article] [PubMed] [Google Scholar]
- Hamrick MW, Shi X, Zhang W, Pennington C, Thakore H, Haque M, Kang B, Isales CM, Fulzele S, Wenger KH. Loss of myostatin (GDF-8) function increases osteogenic differentiation of bone marrow-derived stem cells but the osteogenic effect is ablated with unloading. Bone. 2007;40:1544–53. doi: 10.1016/j.bone.2007.02.012. [DOI] [PMC free article] [PubMed] [Google Scholar]
- He L, Vichev K, Macharia R, Huang R, Christ B, Patel K, Amthor H. Activin A inhibits formation of skeletal muscle during chick development. Anat Embryol. 2005;209:401–7. doi: 10.1007/s00429-005-0454-1. [DOI] [PubMed] [Google Scholar]
- Hennebry A, Berry C, Siriett V, O'Callaghan P, Chau L, Watson T, Sharma M, Kambadur R. Myostatin regulates fiber-type composition of skeletal muscle by regulation MEF2 and MyoD gene expression. Am J Physiol Cell Physiol. 2009;296:C525–34. doi: 10.1152/ajpcell.00259.2007. [DOI] [PubMed] [Google Scholar]
- Holloszy JO, Chen M, Cartee G, Young JC. Skeletal muscle atrophy in old rats: differential changes in the three fiber types. Mech Aging Dev. 1991;60:199–213. doi: 10.1016/0047-6374(91)90131-i. [DOI] [PubMed] [Google Scholar]
- Hurwitz JM, Santoro N. Inhibins, activins and follistatin in the aging female and male. Semin Reprod Med. 2004;22:209–17. doi: 10.1055/s-2004-831896. [DOI] [PubMed] [Google Scholar]
- Jackson M, Luong D, Vang DD, Garikipati D, Stanton J, Nelson OL, Rodgers B. The aging myostatin null phenotype: reduced adiposity, cardiac hypertrophy, enhanced cardiac stress response, and sexual dimorphism. J Endocrinol. 2012;213:263–75. doi: 10.1530/JOE-11-0455. [DOI] [PubMed] [Google Scholar]
- Kellum E, Starr H, Arounleut P, Immel D, Fulzele S, Wenger K, Hamrick MW. Myostatin (GDF-8) deficiency increases fracture callus size, Sox-5 expression, and callus bone volume. Bone. 2009;44:17–23. doi: 10.1016/j.bone.2008.08.126. [DOI] [PMC free article] [PubMed] [Google Scholar]
- Konopka A, Douglass M, Kaminsky L, Jemiolo B, Trappe T, Trappe S, Harper M. Molecular adaptations to aerobic exercise training in skeletal muscle of older women. J Gerontol A Biol Sci Med Sci. 2010;65:1201–7. doi: 10.1093/gerona/glq109. [DOI] [PMC free article] [PubMed] [Google Scholar]
- Kretlow J, Jin Y, Liu W, Zhang W, Hong TH, Zhou G, Baggett L, Mikos A, Cao Y. Donor age and cell passage affects differentiation potential of murine bone marrow-derived stem cells. BMC Cell Biol. 2008;9:60. doi: 10.1186/1471-2121-9-60. [DOI] [PMC free article] [PubMed] [Google Scholar]
- Lee SJ, Reed LA, Davies MV, Girgenrath S, Goad ME, Tomkinson KN, Wright JF, Barker C, Ehrmantraut G, Holmstrom J, Trowell B, Gertz B, Jiang MS, Sebald SM, Matzuk M, Li E, Liang LF, Quattlebaum E, Stotish RL, Wolfman NL. Regulation of muscle growth by multiple ligands signaling through activin type II receptors. Proc Natl Acad Sci USA. 2005;102:18117–22. doi: 10.1073/pnas.0505996102. [DOI] [PMC free article] [PubMed] [Google Scholar]
- Lee SJ, Lee YS, Zimmers TA, Soleimani A, Matzuk M, Tsuchida K, Cohn RD, Barton ER. Regulation of muscle mass by follistatins and activins. Mol Endocrinol. 2010;24:1998–2008. doi: 10.1210/me.2010-0127. [DOI] [PMC free article] [PubMed] [Google Scholar]
- Leger B, Derave W, De Bock K, Hespel P, Russell AP. Human sarcopenia reveals an increase in SOCS-3 and myostatin and a reduced efficiency of Akt phosphorylation. Rejuvenation Res. 2008;11:163–175B. doi: 10.1089/rej.2007.0588. [DOI] [PubMed] [Google Scholar]
- Machida S, Booth FW. Increased nuclear proteins in muscle satellite cells in aged animals as compared to young growing animals. Exp Gerontol. 2004;39:1521–1525. doi: 10.1016/j.exger.2004.08.009. [DOI] [PubMed] [Google Scholar]
- Marcell TJ, Harman SM, Urban RJ, Metz DD, Rodgers BD, Blackman MR. Comparison of GH, IGF-1, and testosterone with mRNA of receptors and myostatin in older men. Am J Phys Endocrinol Metab. 2001;281:E1159–64. doi: 10.1152/ajpendo.2001.281.6.E1159. [DOI] [PubMed] [Google Scholar]
- McFarlane C, Hui G, Amanda W, Lau H, Lokireddy S, Xiaojia G, Mouly B, Butler-Browne G, Gluckman P, Sharma M, Kambadur R. Human myostatin negatively regulates human myoblast growth and differentiation. Am J Physiol Cell Physiol. 2011;301:C195–203. doi: 10.1152/ajpcell.00012.2011. [DOI] [PMC free article] [PubMed] [Google Scholar]
- McKay B, Ogborn DI, Bellamy LM, Tarnopolsky MA, Parise G. Myostatin is associated with age-related human muscle stem cell dysfunction. FASEB J. 2012;26:2509–21. doi: 10.1096/fj.11-198663. [DOI] [PubMed] [Google Scholar]
- McPherron AC, Lawler A, Lee SJ. Regulation of skeletal muscle mass in mice by a new TGF-β family member. Nature. 1997;387:83–90. doi: 10.1038/387083a0. [DOI] [PubMed] [Google Scholar]
- Morissette MR, Stricker C, Rosenberg MA, Buranasombati C, Levitan EB, Mittleman MA, Rosenzweig A. Effects of myostatin deletion in aging mice. Aging Cell. 2009;8:573–83. doi: 10.1111/j.1474-9726.2009.00508.x. [DOI] [PMC free article] [PubMed] [Google Scholar]
- Murphy K, Koopman R, Naim T, Leger B, Trieu J, Ibebunjo C, Lynch GS. Antibody-directed myostatin inhibition in 21-mo-old mice reveals novel roles for myostatin signaling in skeletal muscle structure and function. FASEB J. 2010;24:4433–42. doi: 10.1096/fj.10-159608. [DOI] [PubMed] [Google Scholar]
- Nomura T, Ueyama T, Ashihara E, Tateishi K, Asada S, Nakajima N, Isodono K, Takahashi T, Matsubara H, Oh H. Skeletal muscle-derived progenitors capable of differentiating into cardiomyocytes proliferate through myostatin-independent TGF-beta family signaling. Biochem Biophys Res Commun. 2008;365:863–9. doi: 10.1016/j.bbrc.2007.11.087. [DOI] [PubMed] [Google Scholar]
- Pearsall RS, Canalis E, Cornwall-Brady M, Underwood KW, Haigis B, Ucran J, Kumar R, Pobre E, Grinberg A, Werner ED, Glatt V, Stadmeyer L, Smith D, Seehra J, Bouxsein ML. A soluble activin type IIA receptor induces bone formation and improves skeletal integrity. Proc Natl Acad Sci USA. 2008;105:7082–7. doi: 10.1073/pnas.0711263105. [DOI] [PMC free article] [PubMed] [Google Scholar]
- Peister A, Mellad JA, Larson BL, Hall BM, Gibson LF, Prockop DJ. Adult stem cells from bone marrow (MSCs) isolated from different strains of inbred mice vary in surface epitopes, rates of proliferation, and differentiation potential. Blood. 103:1662–2004. doi: 10.1182/blood-2003-09-3070. [DOI] [PubMed] [Google Scholar]
- Schmittgen TD, Livak KJ. Analyzing real-time PCR data by the comparative C(T) method. Nature Protocols. 3:1101–2008. doi: 10.1038/nprot.2008.73. [DOI] [PubMed] [Google Scholar]
- Siriett V, Platt L, Salerno MS, Ling N, Kambadur R, Sharma M. Prolonged absence of myostatin reduces sarcopenia. J Cell Physiol. 2006;209:866–73. doi: 10.1002/jcp.20778. [DOI] [PubMed] [Google Scholar]
- Szulc P, Schoppet M, Goettsch C, Rauner M, Dschietzig T, Chapurlat R, Hofbauer LC. Endocrine and clinical correlates of myostatin serum concentration in men—the STRAMBO study. J Clin Endocrinol Metab. 2012 doi: 10.1210/jc.2012-1273. Epub ahead of print. [DOI] [PubMed] [Google Scholar]
- Williams NG, Interlichia JP, Jackson MF, Hwang D, Cohen O, Rodgers B. Endocrine actions of myostatin: systemic regulation of the IGF and IGF binding protein axis. Endocrinology. 2011;152:172–80. doi: 10.1210/en.2010-0488. [DOI] [PMC free article] [PubMed] [Google Scholar]
- Yarasheski KE, Ghasin S, Sinha-Hikim I, Pak-Loduca J, Gonzalez-Cadavid NF. Serum myostatin-immunoreactive protein is increased in 60-92 year old women and men with muscle wasting. J Nutr Health Aging. 2002;6:343–8. [PubMed] [Google Scholar]
- Zhang W, Ou G, Hamrick M, Hill W, Borke J, Wenger K, Chutkan N, Yu J, Mi QS, Isales CM, et al. Age-Related Changes in the Osteogenic Differentiation Potential of Mouse Bone Marrow Stromal Cells. J Bone Miner Res. 2008;23:1118–1128. doi: 10.1359/JBMR.080304. [DOI] [PMC free article] [PubMed] [Google Scholar]
- Zhu J, Li Y, Shen W, Qiao C, Ambrosio F, Lavasani M, Nozaki M, Branca M, Huard J. Relationships between transforming growth factor-β1, myostatin, and decorin. J Biol Chem. 2007;282:25852–25863. doi: 10.1074/jbc.M704146200. [DOI] [PubMed] [Google Scholar]