Abstract
Background:
The Human Protein Atlas (HPA) is an effort to map the location of all human proteins (http://www.proteinatlas.org/). It contains a large number of histological images of sections from human tissue. Tissue micro arrays (TMA) are imaged by a slide scanning microscope, and each image represents a thin slice of a tissue core with a dark brown antibody specific stain and a blue counter stain. When generating antibodies for protein profiling of the human proteome, an important step in the quality control is to compare staining patterns of different antibodies directed towards the same protein. This comparison is an ultimate control that the antibody recognizes the right protein. In this paper, we propose and evaluate different approaches for classifying sub-cellular antibody staining patterns in breast tissue samples.
Materials and Methods:
The proposed methods include the computation of various features including gray level co-occurrence matrix (GLCM) features, complex wavelet co-occurrence matrix (CWCM) features, and weighted neighbor distance using compound hierarchy of algorithms representing morphology (WND-CHARM)-inspired features. The extracted features are used into two different multivariate classifiers (support vector machine (SVM) and linear discriminant analysis (LDA) classifier). Before extracting features, we use color deconvolution to separate different tissue components, such as the brownly stained positive regions and the blue cellular regions, in the immuno-stained TMA images of breast tissue.
Results:
We present classification results based on combinations of feature measurements. The proposed complex wavelet features and the WND-CHARM features have accuracy similar to that of a human expert.
Conclusions:
Both human experts and the proposed automated methods have difficulties discriminating between nuclear and cytoplasmic staining patterns. This is to a large extent due to mixed staining of nucleus and cytoplasm. Methods for quantification of staining patterns in histopathology have many applications, ranging from antibody quality control to tumor grading.
Keywords: Color deconvolution, dual tree complex wavelets, histology, human protein atlas, support vector machine, textural features, weighted neighbor distance using compound hierarchy of algorithms representing morphology (WND-CHARM) features
INTRODUCTION
The Human Protein Atlas (HPA) is a publicly available database with millions of high resolution images showing the spatial distribution of proteins detected by 15,598 different antibodies (release 9.0, November 2011) in 46 different normal human tissue types and 20 different cancer types, as well as 47 different human cell lines.[1] The data is released together with application-specific validation performed for each antibody, including immunohistochemisty (IHC), Western blot analysis, a protein array assay, and, for a large fraction, immunofluorescent-based confocal microscopy images. Tissue microarrays (TMA) provide the possibility to immunohistochemically stain a large number and variety of normal and cancer tissues. Specimens containing normal and cancer tissue have been collected and sampled from anonymized paraffin embedded material of surgical specimens, in accordance with approval from the local ethics committee. The images represent a view similar to what is seen in a microscope when examining sections of tissue on glass slides. Each antibody in the database has been used for IHC staining of both normal and cancer tissue. IHC has been used increasingly for over four decades, initially for research but now also for diagnosis and assessment of therapeutic biomarkers.
IHC relies on the specific binding of an antibody to its corresponding antigen for detection and an enzymatic step where a dye is processed to produce a stain for visualization. A commonly used dye is 3,3’-diaminobenzidine (DAB), which produces a dark brown stain. The tissue section is counterstained with hematoxylin to enable visualization of microscopic features. Hematoxylin staining is unspecific and results in a blue coloring of both cells and extracellular material. Traditionally, IHC has been used qualitatively and analyzed through visual inspection. However, there is a clear effort to move towards more quantitative and automated methods.[2,3] With the emergence of digital imaging techniques, digital image analysis has become a promising approach to extract quantitative data from IHC stained samples. Most attempts have been made to quantify the amount of certain proteins with diagnostic or prognostic value.[4–6] In these cases, the protein is known and the staining pattern is well-studied.
In previous studies, Breast TMA spots were classified using color and local invariants,[7] and texton histograms.[8] Scoring of breast TMA spots has been done through ordinal regression methods.[9] A framework towards an automated analysis of sub-cellular patterns in human protein atlas images yielded 83% accuracy in 45 different tissues.[10] Here we describe and compare methods to automatically classify staining patterns of proteins with unknown as well as known localization. Since the location of a protein within the cell can be coupled with certain functions, quantitative information on the staining pattern can be used to group proteins and understand the function of unknown proteins. The methods can also be used to quantify the amount of a protein with known staining pattern. Here we used various features including gray level co-occurrence matrix (GLCM) features, complex wavelet co-occurrence matrix (CWCM) features, and weighted neighbor distance using compound hierarchy of algorithms representing morphology (WND-CHARM)-inspired features[11] for classifying different cellular staining patterns that is nuclear versus cytoplasmic staining in TMA images.
MATERIALS AND METHODS
The proposed methodologies for computation of cellular features to the classification task are shown in Figure 1. The steps include color deconvolution to separate brown/black and blue cellular regions in the stained breast TMA images followed by the computation of various features including gray level co-occurrence matrix (GLCM) features, complex wavelet co-occurrence matrix (CWCM) features and WND-CHARM-inspired features as defined below. The extracted features are thereafter fed into two different multivariate classifiers (support vector machine (SVM) and Linear discriminant analysis (LDA) classifier).
Figure 1.
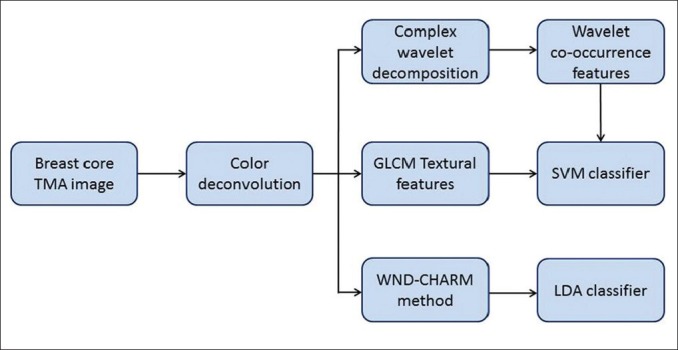
Block diagram of proposed methods
TMA Images
TMA images of normal and breast cancer tissue were downloaded from the HPA (http://www.proteinatlas.org/). A ScanScope CS (Aperio, San Diego, CA) digital microscopical scanner was used to digitize each slice at 20x magnification. We selected images from 19 normal breast tissue cores and 10 breast cancer tissue cores and downloaded them from the database in jpeg file format. At the initiation of the project, non-compressed full resolution images in tif (converted from svs, ScanScope Virtual Slide) format were retrieved from HPA, but a comparison showed that compression artifacts had minor effect on the performance of the presented classification approaches.
Each image is 3000 × 3000 pixels and represents a section of a tissue core composite of two stains; DAB and hematoxylin. We selected samples showing either nuclear or cytoplasmic DAB staining. We divided each image into small patches of 64 × 64 pixels, and classified each patch individually as showing background, connective tissue, nuclear or cytoplasmic staining [Figure 2]. The 29 images result in a total of 61,354 patches. Each image is, thereafter, described by the frequency of the patch classes.
Figure 2.
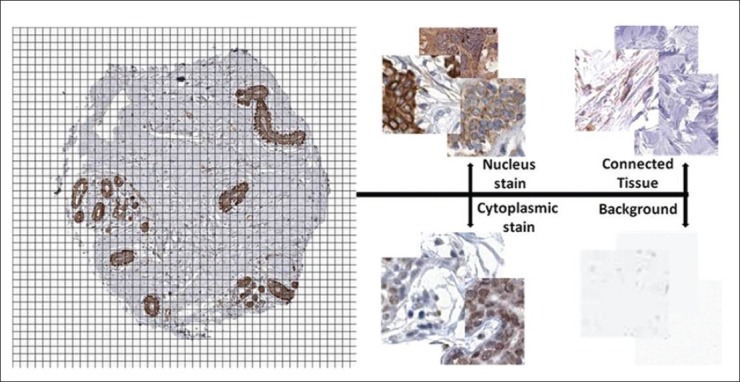
Each core image is divided into 64 × 64 pixel patches and each patch is classified by the presented methods
Color Deconvolution
A color deconvolution scheme is used to transform each image from the red, green, blue (RGB) color space to a new space modeled by the spectral properties of hematoxylin (blue) and DAB (brown/black). Since the hematoxylin stain is selectively absorbed by cell nuclei and DAB stains by specific binding of an antibody to its corresponding antigen (i.e., protein), the information from the created hematoxylin and DAB channels can be used to distinguish protein localization patterns within the tissue sample. The color deconvolution method[12] converts the RGB space to a new color space comprising Hematoxylin (H), DAB, and a third ‘dummy’ channel created as a vector orthogonal to H and DAB. The pre-defined and normalized color stained values for Hematoxylin-staining vector [0.074510 0.054902 0.337255]; DAB-staining vector [0.341176 0.101961 0.043137] have been obtained from the ImageJ color deconvolution plug-in.[13] The result after color deconvolution is shown in Figure 3.
Figure 3.
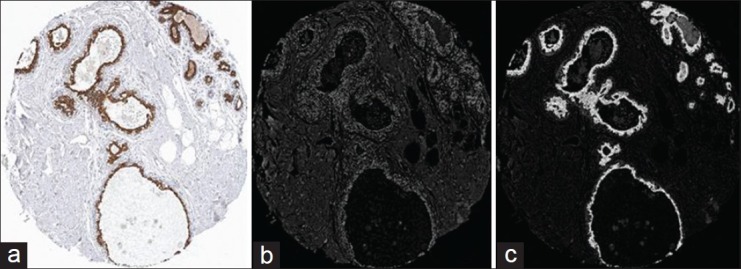
Color deconvolution; (a) Original breast core TMA image; (b) Blue channel after color deconvolution; (c) Brown channel after color deconvolution
The blue channel corresponds to regions stained with Hematoxylin and, in this example image, it is expressed mainly in the nuclei. In that image, most nuclei are also positive and are, therefore, also stained with the brown DAB stain, which makes it hard to see the blue stain due to brown being darker and more distinct. Also, in the nature of the chosen color deconvolution algorithm, which uses a simple matrix multiplication on the color value, and one of its major drawbacks, is the fact that it will always give some response in very dark regions. Hence, some of the dark brown nuclei will always show high response, no matter which deconvolution is used.
Gray level Co-Occurrence and Complex Wavelet Features with SVM
Gray Level Co-Occurrence Matrix
A commonly used statistical method to examine texture is the gray-level co-occurrence matrix (GLCM), previously shown to be useful for tissue texture analysis.[14] GLCM considers the spatial relationship of pixels and characterizes the texture of an image by calculating how often pairs of pixel with specific values and spatial relationships occur in an image. Once the GLCM is constructed, statistical measures are extracted from the matrix.[15,16] We calculated the GLCM in each 64 × 64 patch with inter-pixel distance d = 16, where four main directions have been used so as to compute the occurrences: 0°, 45°, 90°, and 135°.
Complex Wavelet Co-Occurrence Matrix
The complex wavelet transform (CWT) is a complex valued extension to the standard discrete wavelet transform (DWT).[17] It provides multiresolution, sparse representation, and useful characterization of the structure of an image. The dual-tree complex wavelet transform (DT-CWT) requires additional memory, but provides approximate shift invariance, good directional selectivity in two dimensions and extra information in imaginary plane of complex wavelet domain when compared to DWT.[18] DT-CWT calculates the complex transform of a signal using two separate DWT decompositions.
Since DT-CWT produces complex coefficients for each directional sub-band at each scale, this produces six directionally selective sub-bands for each scale of the two-dimensional DT-CWT at approximately ±15°, ±45°, and ±75°. In dyadic decomposition, sub-bands are allowed to be decomposed in both vertical and horizontal directions sequentially, but in anisotropic decomposition sub-bands are allowed to be decomposed only vertically or horizontally.
Studies have shown that the anisotropic dual-tree complex wavelet transform (ADT-CWT) provides an efficient representation of directional features in images for pattern recognition applications.[19] Ten basis functions are produced in ADT-CWT in each level which makes different orientations at the directions of ±81°, ±63°, ±45°, ±27°, and ± 9°. This result in a finer analysis of the local high frequency components of images which is characterized by a finer division of high-pass sub-bands as well as edges and contours, which are represented by anisotropic basis functions oriented in different finer directions. Here we use an adaptive basis selection method on Undecimated Adaptive Anisotropic Dual-tree complex wavelet transform (UAADT-CWT).[20]
Textural Feature Extraction
The textural features uniformity, entropy, dissimilarity, contrast, correlation, homogeneity, autocorrelation, cluster shade, cluster prominence, max. probability, sum of squares, sum average, sum variance, sum entropy, difference variance, difference entropy, information measures of correlation-1, information measures of correlation-2, inverse difference normalized, inverse difference moment normalized are extracted with inter-pixel distance d = 16, from the 64 × 64 pixel patches of the tissue images using the standard expressions derived in[15,16] for the following features extraction techniques (i) GLCM features: From color delineated blue and brown/black stains channels (20 + 20 = 40 features) and (ii) CWCM features: Each feature is computed by taking the absolute value of the real and imaginary part of complex co-efficient in four main directions (0°, 45°, 90°, and 135°) for three decomposition levels. Finally, for each feature, the mean value over the three decomposition levels is computed for the DT-CWT (60 blue channel + 60 brown/black channel = 120 features) and UAADT-CWT (60 blue channel + 60 brown/black channel = 120 features).
Support Vector Machine Classifier
SVM is a classification technique, which is based on statistical learning theory. It can model nonlinear relationships, which is useful in practical applications.[21] In SVM, a nonlinear input data set is converted into a high dimensional linear feature space via kernels for the non-linear case. A SVM classifier with linear kernel is used in the training and testing phase for the classification task using the Library for Support Vector Machine (LIB-SVM) tool box[22] with SVM parameters -s 0 (SVM type: 0 for C-SVC), -g (Number of features), -r 0 (Coefficient in kernel function), -c 1.0 (parameter C of C-SVC), -e 0.0010 (tolerance of termination criterion), -p 0.1 (epsilon value).
Principal Component Analysis-Linear Discriminant Analysis-Compound Hierarchy of Algorithms Representing Morphology
“PCA-LDA-CHARM” is an algorithm initially inspired by Ilya Goldberg's WND-CHARM,[11] a whole-image-based classifier. The principle of the original algorithm is to extract features on the whole image (without segmenting the interesting parts), weighting the features depending on their information content, and then classifying them using a modified version of the k-nearest neighbor classifier. Here we extract features from 64 × 64 pixel patches from larger tissue images. The feature vector is built “hierarchically”: It is composed of different kinds of global features (texture descriptors, edge descriptors, histograms, moments, etc.) that are computed on the raw image, on several transformed version of the raw image (Fourier Transform, Wavelet Transform, and Chebyshev Transform), and eventually on compound-transformed version of the image (Wavelet-Fourier Transform, Chebyshev-Fourier Transform).
A C++ implementation of the original algorithm is available online and described in.[23] PCA-LDA-CHARM is using the same idea of building a vector composed of whole-image features. The feature extraction process is performed in CellProfiler.[24] The feature vector is not composed of the exact same elements as the one proposed by Ilya Goldberg in the original WND-CHARM, but the same “groups” of features are present (texture features, edge features, histograms, transforms.,). Since the datasets are represented as sets of features in a high-dimensional space and a more robust classification framework than the one suggested in[11] was desired, Principal Component Analysis (PCA) was used as a pre-processing step to reduce the dimensionality of the feature space, and then a subset of the PCA-transformed features was classified using Linear Discriminant Analysis (LDA) as suggested in.[25] The subset of principal components used for classification was chosen as the minimal number of strongest principal components required to explain at least 98% of the variance in the original data. The sklearn[26] Python implementation of PCA and LDA were used.
EXPERIMENTS AND RESULTS
In order to compare the different feature extraction and classification approaches, 1,057 patches were manually selected from the total of 61,354 patches from 29 core images. The patches were selected to represent comparably clear examples of each of the four classes: Background - 193 patches, connective tissue - 462 patches, cytoplasmic staining - 200 patches, and nuclear staining - 202 patches. Each of the 1,057 patches was manually/visually classified as showing nucleus stain, cytoplasmic stain, connective tissue or background. This classification result was used as ground truth for evaluation of the automated methods.
To evaluate the ground truth, the classification was performed by a different expert, and a second time by the first expert. The inter-observer accuracy was 92% and the intra-observer accuracy 96% as shown in Figure 4.
Figure 4.
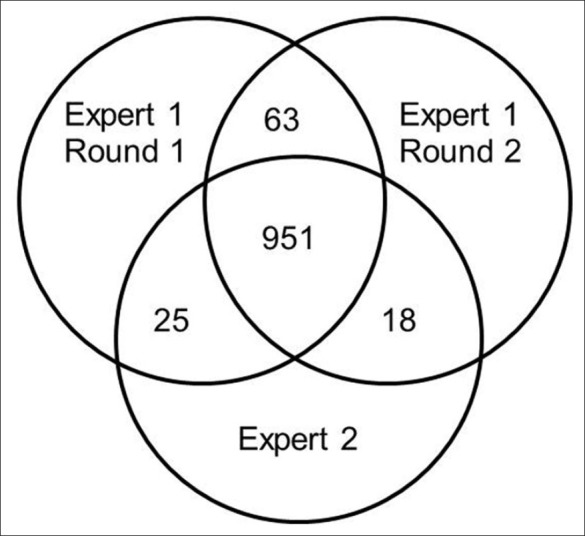
Venn diagram for visual scoring of 1,057 patches by two different experts
GLCM, ADT-CWT, and UAADT-CWT co-occurrence features were extracted from each of the 1,057 patches. The Waikato Environment for Knowledge Analysis (WEKA) data mining tool[27] used to select the optimal features for the classifier task using half the samples of each class as input. Based on the Greedy hill-climbing algorithm implemented in WEKA, 9, 18, and 19 features were selected from GLCM, ADT-CWT, and UAADT-CWT features, respectively.
We used five combinations of features for training the classifier: 9 GLCM features, 18 DTCWT features, 19 UDTCWT features, the combination of GLCM + DTCWT features (9 + 18 = 27), and the combination GLCM + UDTCWT features (9 + 19 = 28).
The PCA-LDA-CHARM feature vector was composed of 661 elements from various feature “groups” (edges features, texture features, histograms, moments, and transforms or the image) extracted using CellProfiler. We used the k-fold cross validation method (with k = 10) to assess classification efficiency for each of the compared methods.
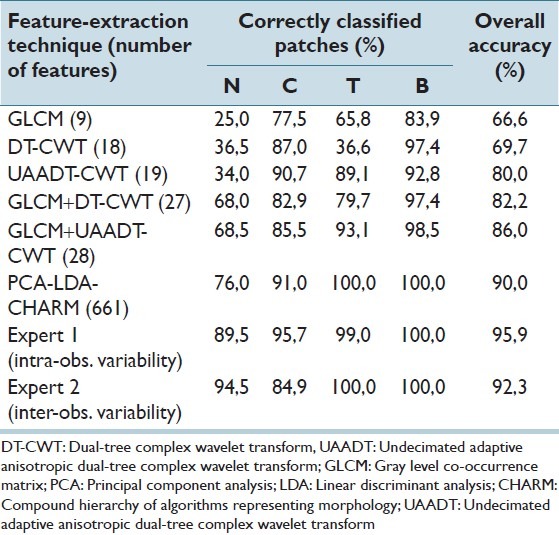
The accuracy of each combination of features and classifier is defined as the ratio of the number of samples correctly classified to the total number of samples tested, as presented in Table 1. The PCA-LDA-CHARM shows a result (90% accuracy) similar to that of the inter-observer variability (92% accuracy).
Table 1.
Classification result using different features (where N-Nucleus stains, C-Cytoplasmic stains, T-Connected tissue, B-Background)
CONCLUSIONS AND FUTURE WORK
The methods proposed in this paper are general in the sense that they are trained for a variety of features that are not specific for a certain type of objects. Using only traditionally used features such as GLCM gives low accuracy [Table 1]. However, we have obtained good results on this dataset by using combinations of GLCM and wavelets (GLCM + UAADT-CWT) and texture features, edge features, histograms, transforms, etc., (WND-CHARM). In this study, we have shown that the ability of the Undecimated Anisotropic DT-CWT, which provides distinguished textural features in both positive and negative frequencies resulted in different orientated sub-bands at each scale. Also, this proposed method is considerably less complex than previous attempts at producing features.[10] Some of the WND-CHARM-inspired features are complicated to interpret, and might not generalize well to other cases, and will, thus, require a new training step.
The 1,057 patches used in the experiments were selected to represent comparably clear examples of each of the four classes. The goal is of course to have a method that performs well when applied to arbitrary patches (that, for example, contains more than one class) from core images and our initial experiments show that we can obtain reasonable good results for some of the methods.
The majority of the classification errors are between samples with nuclear and cytoplasmic staining. This is true for both automatic and manual classification, and correlates with the increasing diversity within the class. For the nuclear class the stain should be located mainly in the nucleus; however, some weaker stain may also be present in the cytoplasm. For patches with cytoplasmic stain the stain may only be present in the cytoplasm, however, due to the sectioning, the cytoplasm may cover the nucleus, which can appear to be stained. Furthermore in the core, there might be unspecific binding of antibody in the connective tissue resulting in a brown stain in between cells, which is neither nuclear nor cytoplasmic. In this study, these patches have been classified as cytoplasmic, however, in future work the classes may have to be revised to accommodate for this staining pattern.
We have encountered the variation in staining pattern and intensity between patches for a single antibody within a core. However, repeated immunostaining of the same material will inevitably exhibit variations due to variability in the steps in the staining process. In future work, we will explore variations in the staining process in more detail by analyzing repeated staining and sibling antibodies raised against the same protein. We will also implement and test methods for normalization of contrast and intensity as the samples we process show a large amount of variability.
Note that in this report, we use low-level image features to classify patches based on the biological content in the patches. The patches are extracted from 29 core images, each with similar noise and artifacts.
A previous study[28] has shown that some classification method, that use low-level image features for patch classification, give similar results when applied to the original patches (from fluorescence microscopy images) compared to when applied to the original patches with the biological content removed. In this paper, we assume that the patches within a core are independent in terms of staining pattern and intensity as well as noise and artifacts. Further experiments are needed to verify that this assumption holds. Moreover, since we used different classifiers (SVM and LDA) for the different approaches, further investigation is needed to examine the impact of the choice of methods for feature selection and classification.
We can conclude that both human experts and the proposed automated methods have difficulties discriminating between nuclear and cytoplasmic staining patterns. This is to a large extent due to mixed staining of nucleus and cytoplasm. However, the proposed GLCM + UDTCWT features and the PCA-LDA-CHARM, which combine many different classes of features such as GLCM and wavelet, have accuracy similar to that of a human expert.
Footnotes
Available FREE in open access from: http://www.jpathinformatics.org/text.asp?2013/4/2/14/109881
REFERENCES
- 1.Human Protein Atlas (HPA) [Last accessed on 2011 Dec 15]. Available from: http://www.proteinatlas.org .
- 2.Taylor CR, Levenson RM. Quantification of immunohistochemistry-issues concerning methods, utility and semi-quantitative assessment II. Histopathology. 2006;49:411–24. doi: 10.1111/j.1365-2559.2006.02513.x. [DOI] [PubMed] [Google Scholar]
- 3.Walker RA. Quantification of immunohistochemistry-issues concerning methods, utility and semi-quantitative assessment I. Histopathology. 2006;49:406–10. doi: 10.1111/j.1365-2559.2006.02514.x. [DOI] [PubMed] [Google Scholar]
- 4.Rexhepaj E, Brennan DJ, Holloway P, Kay EW, McCann AH, Landberg G, et al. Novel image analysis approach for quantifying expression of nuclear proteins assessed by immunohistochemistry: Application to measurement of oestrogen and progesterone receptor levels in breast cancer. Breast Cancer Res. 2008;10:R89. doi: 10.1186/bcr2187. [DOI] [PMC free article] [PubMed] [Google Scholar]
- 5.Tuominen VJ, Ruotoistenmäki S, Viitanen A, Jumppanen M, Isola J. ImmunoRatio: A publicly available web application for quantitative image analysis of estrogen receptor (ER), progesterone receptor (PR), and Ki-67. Breast Cancer Res. 2010;12:R56. doi: 10.1186/bcr2615. [DOI] [PMC free article] [PubMed] [Google Scholar]
- 6.Tuominen VJ, Tolonen TT, Isola J. ImmunoMembrane: A publicly available web application for digital image analysis of HER2 immunohistochemistry. Histopathology. 2012;60:758–67. doi: 10.1111/j.1365-2559.2011.04142.x. [DOI] [PubMed] [Google Scholar]
- 7.Amaral T, McKenna SJ, Robertson K, Thompson A. Classification of breast tissue microarray spots using colour and local invariants. Proceedings of the IEEE International Symposium on Biomedical Imaging: From Nano to Macro; Paris. 2008:999–1002. [Google Scholar]
- 8.Amaral T, McKenna SJ, Robertson K, Thompson A. Classification of breast tissue microarray spots using texton histograms. In Medical Image Understanding and Analysis, Dundee. 2008 Jul [Google Scholar]
- 9.Amaral T, McKenna SJ, Robertson K, Thompson A. Scoring of breast tissue microarray spots through ordinal regression, Proceedings of the International Conference on Computer Vision Theory and Applications. 2009 [Google Scholar]
- 10.Newberg J, Murphy RF. A framework for the automated analysis of subcellular patterns in human protein atlas images. J Proteome Res. 2008;7:2300–8. doi: 10.1021/pr7007626. [DOI] [PubMed] [Google Scholar]
- 11.Orlov N, Shamir L, Macura LS, Johnston J, Eckley DM, Goldberg IG. WND-CHARM: Multi-purpose image classification using compound image transforms. Pattern Recognit Lett. 2008;29:1684–93. doi: 10.1016/j.patrec.2008.04.013. [DOI] [PMC free article] [PubMed] [Google Scholar]
- 12.Ruifrok AC, Johnston DA. Quantification of histochemical staining by color deconvolution. Anal Quant Cytol Histol. 2001;23:291–9. [PubMed] [Google Scholar]
- 13.Rasband WS, Image J. US National Institutes of Health, Bethesda, Maryland, USA. 1997-2012. [Last accessed on 2011 Dec 21]. Available from: http://imagej.nih.gov/ij/
- 14.Nielsen B, Albregtsen F, Danielsen HE. Statistical nuclear texture analysis in cancer research: A review of methods and applications. Crit Rev Oncog. 2008;14:89–164. doi: 10.1615/critrevoncog.v14.i2-3.10. [DOI] [PubMed] [Google Scholar]
- 15.Haralick RM, Shanmugam K, Dinstein I. Texture features for image classification. IEEE Trans System Man Cybernat. 1973;8:610–21. [Google Scholar]
- 16.Soh L, Tsatsoulis C. Texture analysis of SAR sea ice imagery using gray level co-occurrence matrices. IEEE Trans Geoscience Remote Sens. 1999;37:780–95. [Google Scholar]
- 17.Goswami JC, Chan AK. Fundamentals of wavelets-theory, algorithms and applications. New Delhi: Wiley India Pvt. Ltd; 2006. [Google Scholar]
- 18.Selesnick IW, Baraniuk RG, Kingsbury NC. The dual-tree complex wavelet transform. IEEE Sig Pro Mag. 2005;22:123–51. [Google Scholar]
- 19.Peng Y, Xie X, Xu W, Dai Q. Face Recognition Using Anisotropic Dual-Tree Complex Wavelet Packet. Proceedings of the 19th International Conference on Pattern Recognition. 2008 [Google Scholar]
- 20.Yang J, Yang J, Wang Y, Xu W, Dai Q. Image and video denoising using adaptive dual tree discrete wavelet packets. IEEE Trans Circ Syst Video Tech. 2009;19:642–55. [Google Scholar]
- 21.Burges CJ. A tutorial on support vector machines for pattern recognition. Data Min Knowl Discov. 1998;2:121–67. [Google Scholar]
- 22.Chang CC, Lin CJ. LIBSVM: A library for support vector machines. ACM Trans Intel Sys Tech. 2011;2:1–27. [Google Scholar]
- 23.Shamir L, Orlov N, Eckley DM, Macura T, Johnston J, Goldberg IG. Wndchrm-an open source utility for biological image analysis. Source Code Biol Med. 2008;3:13. doi: 10.1186/1751-0473-3-13. [DOI] [PMC free article] [PubMed] [Google Scholar]
- 24.Lamprecht MR, Sabatini DM, Carpenter AE. CellProfiler: Free, versatile software for automated biological image analysis. Biotechniqes. 2007;42:71–5. doi: 10.2144/000112257. [DOI] [PubMed] [Google Scholar]
- 25.Yang J, Yang JY. Why can LDA be performed in PCA transformed space? Pattern Recog. 2003;36:563–6. [Google Scholar]
- 26.Pedregosa F, Varoquaux G, Gramfort A, Michel V, Thirion B, Grisel O, et al. Scikit-learn: Machine Learning in Python. J Mach Learn Res. 2011;12:2825–30. [Google Scholar]
- 27.Waikato Environment for Knowledge Analysis: University of Waikato New Zealand. [Last accessed on 2011 Dec 02]. Available from: http://www.cs.waikato.ac.nz/ml/weka/index.html .
- 28.Shamir L. Assessing the efficacy of low-level image content descriptors for computer-based fluorescence microscopy image analysis. J Microsc. 2011;243:284–92. doi: 10.1111/j.1365-2818.2011.03502.x. [DOI] [PubMed] [Google Scholar]


