Abstract
Context:
Three dimensional (3D) tissue reconstructions from the histology images with different stains allows the spatial alignment of structural and functional elements highlighted by different stains for quantitative study of many physiological and pathological phenomena. This has significant potential to improve the understanding of the growth patterns and the spatial arrangement of diseased cells, and enhance the study of biomechanical behavior of the tissue structures towards better treatments (e.g. tissue-engineering applications).
Methods:
This paper evaluates three strategies for 3D reconstruction from sets of two dimensional (2D) histological sections with different stains, by combining methods of 2D multi-stain registration and 3D volumetric reconstruction from same stain sections.
Setting and Design:
The different strategies have been evaluated on two liver specimens (80 sections in total) stained with Hematoxylin and Eosin (H and E), Sirius Red, and Cytokeratin (CK) 7.
Results and Conclusion:
A strategy of using multi-stain registration to align images of a second stain to a volume reconstructed by same-stain registration results in the lowest overall error, although an interlaced image registration approach may be more robust to poor section quality.
Keywords: 3D reconstruction, computerized diagnosis, digital pathology, histological image, image analysis, multi-stain registration
INTRODUCTION
Histopathology is the microscopic examination of tissue sections, which are colored with different stains to display different functional or physical properties. Three dimensional (3D) tissue reconstruction from the digital images of serial sections has significant potential to improve the understanding of the growth patterns and the spatial arrangement of diseased cells, enhance the study of biomechanical behavior of the tissue structures towards better treatments (e.g. tissue-engineering applications). This can be obtained by successively applying two dimensional (2D) image-to-image registrations and then concatenating the set of aligned images to form a 3D volumetric dataset. Various methods based on this idea have been presented for 3D reconstruction from a set of images of same-stain serial sections.[1–4] Recently, there is increasing research interest in registering 2D histology images of consecutive sections with different stains,[5–8], since automatic co-registration of these images allows the spatial alignment of structural and functional elements in different modalities for quantitative study of many physiological and pathological phenomena. However, there is no work known to the authors addressing the problem of 3D reconstruction from images of sections with different stains. In this paper, we discuss three strategies for combining the solutions of automatic 2D multi-stain registration and 3D volumetric reconstruction from same-stain sections. As the 2D multi-stain registration and same-stain volumetric reconstruction are the key steps of all 3D reconstruction strategies, for the completeness, we provide the necessary details about our implementations of 2D registrations in section Methods.
MATERIALS
Two human liver surgical Specimens (A, B) are used to examine three 3D reconstruction strategies. Local NHS research ethical approval was obtained for use of the human tissue. On Specimen A, four artificial vertical holes were made for the quantitative evaluation of the accuracy of the 3D reconstruction. Specimen B was chosen because there are relatively consistent anatomic features present in the stack of sections. Using standard histological techniques, the specimens were formalin fixed, paraffin embedded, and cut into ~5μm sections using a microtome.
For Specimen A, every 4th section was selected and stained with H and E; every 5th section was stained with Sirius Red. Twenty five sections of each stain were prepared, with 50 sections in total.
For Specimen B, every 2nd, 3rd, 4th section was stained with H and E while every 6th, 7th, 8th sections were stained with CK7. Fifteen sections of each stain were prepared, with 30 sections in total.
Sections were scanned at 20× magnification with average image size ~1.4 G (Specimen A) and 40× with average image size ~18.5 G (specimen B) using an Aperio XT scanner. To verify the influence of misaligned 2D images on the various 3D reconstruction strategies, images of sections with the following problems are included:
Luminance gradient: Sections mounted close to the edge of the glass slide produce images with significant luminance gradients [Figure 1-A1, 1-A2].
Non-tissue noise: Dust and air bubbles in the slide [Figure 1-A1, 1-A2].
Damaged and missing sections: During sectioning and mounting, sections are occasionally torn, folded [Figure 1-B1].
Staining variations: Differences in section thickness, staining duration, and stain concentration result in colour variations [Figure 1-B2].
Figure 1.

Example histological sections on which the green marks are annotations used for the evaluation
METHODS
There are several potential approaches for 3D reconstruction from images of differently stained sections which we have implemented and evaluated. An intuitive option is to apply 2D registration sequentially for each stain separately (i.e. same-stain registration) after the reference image (i.e. the first section) for each stack has been aligned by applying 2D multi-stain registration Figure 2, Strategy 1). The second solution is to apply same-stain registration on the stack of images with one stain (e.g. T1) sequentially and then aligning every image in the stack of the other stain (e.g. T2) to its adjacent image in the stack of stain T1 using multi-stain registration [Figure 2, Strategy 2]. The third approach is interlacing images of stain T1 and T2 in the same sequence as sectioning and applying multi-stain registration for all neighboring images [Figure 2, Strategy 3]. In “Results” section, we present a comparison study of these options. The 3D registration approaches discussed in this paper are the extension of: 1) Our previous works on 3D volume reconstruction from 2D registration of images of same-stain serial sections[1] and 2) our unsupervised content classification based on 2D multi-stain registration method (manuscript under preparation). To make this paper independently readable, we briefly review our 2D registration methods in the following sections.
Figure 2.
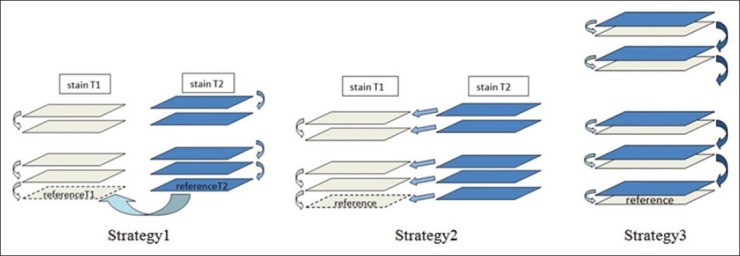
Strategies of 3D registration of multi-stain pathological images
Automatic 2D:2D Same-Stain Registration of Histology Images
Registration consists in two main steps: 1) Initial rigid alignment of an red, green, blue (RGB) image pair at low resolution X0 using a phase correlation based method (a combination of[9] and[10] to recover scale and rotation) applied to grayscale image; 2) Non-rigid alignment is done by dividing each image into small patches (from our cross-validation study, the best results are given at 256 × 256 pixels per patch) and computing the rigid transformation of these patches separately by applying the phase correlation based method. The deformation field is then represented by five vectors for each patch, i.e. one at each corner and one at the centre. A cubic B-Spline transform is estimated to approximate the deformation field using regularized least squares error minimization.[11] The non-rigid transform in Step 2 is refined by a multi-resolution (from coarse X1 to fine Xn) approach. The patch matching approach is the key to tackle large image size (gigabytes at high resolution).
Automatic 2D:2D Multi-Stain Registration of Histology Images
A challenge when registering histology images with different stains is that different stains highlight different substances in tissues, resulting in dissimilar structural appearances on adjacent tissue sections. We address this challenge by proposing an unsupervised content classification method, which automatically identifies common content classes from differently stained histology image pair. This method creates two multi- channel probability images [Figure 3c] for the non-rigid alignment, as in step 2 where the grayscale images are used for the same-stain registration. The workflow of multi-stain registration is illustrated in Figure 3, and the results at resolution Xi (1 ≤ i ≤ n) of each step are exemplified on the right hand side. The content classification algorithm is summarized in Table 1, where we assume the input image pair at resolution Xi has been pre-registered by the transformation estimated at resolution Xi-1 (within a multi-resolution framework).
Figure 3.
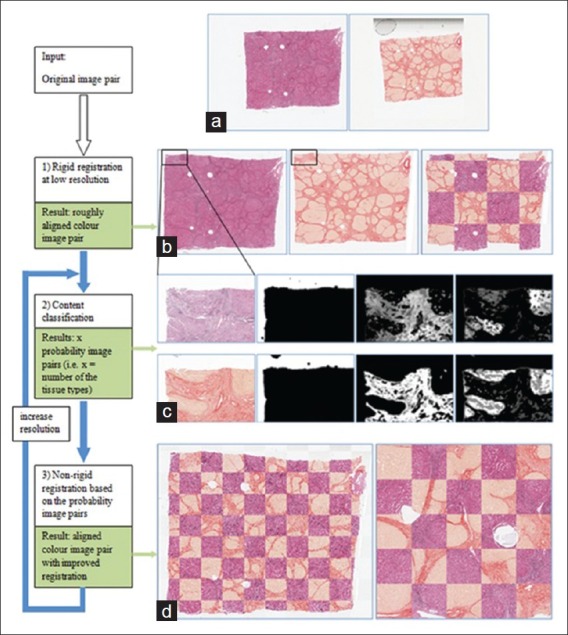
Workflow of unsupervised content classification based registration of multi-stain histology images. Examples results of each step are illustrated at the right side. (a) Original tissue sections stained with H and E and Sirius Red stains. (b) Rigidly aligned image pair. (c) Example output of three channel probability image pair. Each channel is corresponding to a content class automatically identified from the image pair in (a). (d) Non-rigid registration result
Table 1.
Content classification algorithm
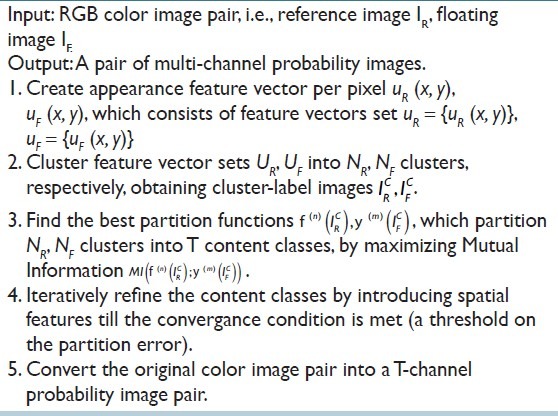
Spatial location features are introduced as complementary to the appearance features. This overcomes the problem where the appearance features alone (for some stains) are not sufficient to separate certain image regions, which have similar appearance, but belong to different content classes. As that the content classes are emergent from co-occurrence statistics between the image pairs, they do not necessarily resemble to real anatomic classes. Note this is not a prerequisite for registration.
RESULTS
Evaluation on 2D Multi-Stain Registration
The 2D unsupervised content classification-based registration method plays a key role in our 3D reconstruction study. Thus, we evaluate the 2D multi-stain registration method using three histological image pairs with six different stains from a liver specimen, a intervertebral disc specimen, and a colon specimen. We manually annotate 20~30 regions (the number of pixels per annotation ranges 2000~5600) on each image pair. The alignment accuracy for each image pair is evaluated by measuring Hausdorff distance (μm) of corresponding annotations at full-resolution level (at which the image was originally scanned). The boxplot of registration accuracy is shown in Figure 4.
Figure 4.
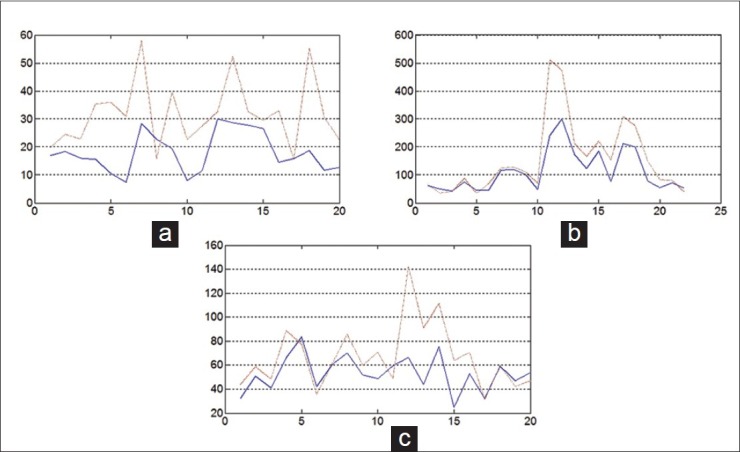
Boxplot of the alignment accuracy. x-axis indicates the annotations. y-axis is the Hausdorff distance (μm). The solid lines indicate the registration results with using content classification method. The dash lines indicate the results without using content classification method. (a) Colon specimen (H and E, Cytokeratin Immunohistochemical). (b) Vertebral specimen (Alcian Blue, EPSR). (c) Liver specimen (Reticulin, Masson trichrome)
Evaluation of 3D Reconstruction Strategies
Figure 5 illustrates the influence of different 3D reconstruction strategies (described in “Materials and Methods” section) on the reconstructed specimens by stacking all the registered images of stain A serially as when they were cut. For example, for the reconstructed Specimen A, the odd number images are those stained with H and E and the even number images are stained with Sirius Red. The Hausdorff distances (μm) are measured at 20× magnification for Specimen A. The graphs at the position n depict the distance between the n+1th images and the 1st image (i.e. accumulated error). Each line plotted in the graph corresponds to one manual annotation, as shown in Figure 1.
Figure 5.
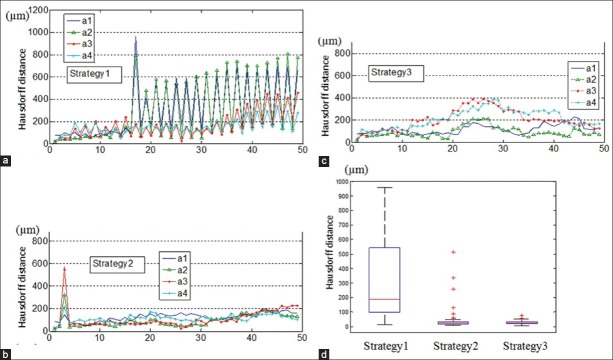
(a-c) Accumulated Hausdorff distances of reconstructed Specimen A by applying Strategy 1, 2, 3, respectively. x-axis is series number of sections. (d) Boxplot of the Hausdorff distances between successive images in each stack
Figure 5d (Strategy 1) shows large misalignments exist between successive images of different stains, due to the fact that Strategy1 is based on two sets of independent same-stain registrations. This results in a large accumulated error with respect to the first image [Figure 5a]. Strategy 2 shows better registration accuracy between stains [Figure 5d] resulted from applying same-stain registration on odd number images (H and E stain) followed by multi-stain registration to align every even number images (Sirius Red stain) to its neighboring H and E image. There is also less accumulation of errors with respect to the first image [Figure 5b]. Figure 5d illustrates the Strategy 3 also has good registration accuracy between successive images of different stains; however, accumulated error is larger than Strategy 2 [Figure 5c].
Unlike Specimen A, there are no artificial markers on the Specimen B. As the influence of anatomic changes overrides the registration errors, for Specimen B, we do not provide Hausdorff evaluation based on annotations of real anatomic structures. Instead, the smoothness of the reconstructed specimens in coronal views offers a more intuitive qualitative way of comparing the three strategies, as in Figure 6.
Figure 6.
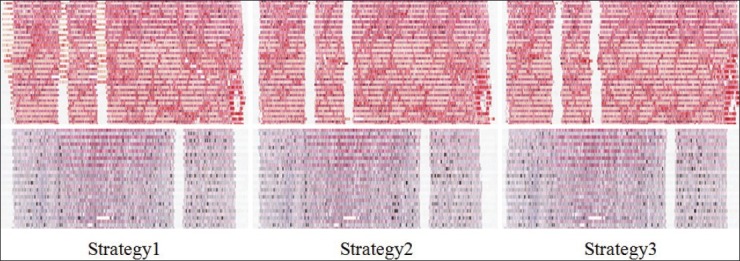
Comparison of 3D volumetric reconstructions of Specimen A, B with different strategies. The coronal views of the reconstructed Specimen A (Top). View plane locates at annotations a1, a2. The Coronal views of the reconstructed Specimen B (Bottom). View plane locates at annotations b2
Figure 6 shows a coronal view of the reconstructed specimens. For Specimen A (top), Strategy 2 gives the smoothest 3D reconstruction, however, several outliers exist. Strategy 1 has a smooth reconstruction before the first big misalignment presents, which leads to the poor reconstruction of the rest part of the specimen. Although Strategy 3 has the smallest Hausdorff distance between successive images, as illustrated in Figure 5d, the reconstructed volume is not as smooth as Strategy 2, reflecting the fact that Strategy 3 has random accumulated registration errors. For Specimen B (bottom), similar conclusions can be drawn. Strategy 1 has larger registration error at the end of the reconstructed stack than other two strategies. Strategy 2 and 3 give much smoother blood vessel walls and specimen boundary, and their difference is minor in this case.
In addition to the registration accuracy, computational efficiency is also an important factor to be considered. Table 2 exemplifies the execution times of same-stain and multi-stain 2D registrations at different resolutions. All computations were carried out on a desktop computer with the following specifications: Intel i7 dual core ×3.07 GHz, 8 GB RAM, Windows 7. The code is not yet optimized for parallel computation.
Table 2.
Computation efficiency

CONCLUSION
In our experiments, we also notice that the multi-stain 2D registration method is less sensitive to problematic sections and performs accurately on serial sections of continuous cut. However, when the gap between the two sections increases (i.e. more sections are left out of the reconstruction), the registration accuracy correspondingly decreases since larger variations in tissue structures are present between the two sections, and thus affects the result of co-occurrence statistics, and, thus, unsupervised classification performance. In summary, Strategy 3 (only involving multi-stain 2D registration) has an advantage in dealing with some problematic sections and provides good 3D reconstruction results (when only few sections in the cut are left out of 3D reconstruction), however, it requires 2×n-1 multi-stain registrations (n the number of images in each stain). Strategy 2 results in the lowest accumulated errors if those problematic sections can be discarded before the registration, but is more sensitive to these problematic sections. Moreover, it only requires n-1 same-stain 2D registrations plus n multi-stain 2D registrations, which is much more computationally efficient than Strategy 3. Both Strategy 2 and Strategy 3 are practically usable.
Footnotes
Available FREE in open access from: http://www.jpathinformatics.org/text.asp?2013/4/2/7/109864
REFERENCES
- 1.Roberts N, Magee D, Song Y, Brabazon K, Shires M, Crellin D, et al. Towards routine use of 3D histopathology as a research tool. American Journal of Pathology, 2012;180:1835–1842. doi: 10.1016/j.ajpath.2012.01.033. [DOI] [PMC free article] [PubMed] [Google Scholar]
- 2.Kurien T, Boyce RW, Paish EC, Ronan J, Maddison J, Rakha EA, et al. Three dimensional reconstruction of a human breast carcinoma using routine laboratory equipment and immunohistochemistry. Journal of Clinical Pathology. 2005;58:968–972. doi: 10.1136/jcp.2004.024794. [DOI] [PMC free article] [PubMed] [Google Scholar]
- 3.Magee D, Treanor D, Quirke P. Proceedings of the 3rd Medical Image Computing and Computer Assisted Intervention (MICCAI) Workshop on Microscopic Image Analysis with Applications in Biology (MIAAB) New York: 2008. Sep 5-6, A new image registration algorithm with application to 3D histopathology. [Google Scholar]
- 4.Pitiot A, Bardinet E, Thompson P, Malandain G. Piecewise affine registration of biological images for volume reconstruction. Medical Image Analysis. 2006;10:465–483. doi: 10.1016/j.media.2005.03.008. [DOI] [PubMed] [Google Scholar]
- 5.Can A, Bello M, Cline HM, Tao X, Ginty F, Sood A, et al. Biomedical Imaging: From Nano to Macro, 2008. ISBI 2008. Paris: 5th IEEE International Symposium; 2008. May 14-17, Multi-modal imaging of histological tissue sections. [Google Scholar]
- 6.Cooper L, Sertel O, Kong J, Lozanski G, Huang K, Gurcan M. Feature-based registration of histopathology images with different stains: An application for computerized follicular lymphoma prognosis. Computer Methods Programs in Biomedicine. 2009;96:182–92. doi: 10.1016/j.cmpb.2009.04.012. [DOI] [PMC free article] [PubMed] [Google Scholar]
- 7.Cooper L, Naidu S, Leone G, Saltzl J, Huang K. Proceedings of the 3rd Medical Image Computing and Computer Assisted Intervention (MICCAI) Workshop on Microscopic Image Analysis with Applications in Biology (MIAAB) Piscataway: 2007. Sep 21, Registering high resolution microscopic images with different histochemical staining - a tool for mapping gene expression with cellular structures. [Google Scholar]
- 8.Mueller D, Vossen D, Hulsken B. Real-time deformable registration of multi-modal whole slides for digital pathology. Computerized Medical Imaging and Graphics. 2011;35:542–556. doi: 10.1016/j.compmedimag.2011.06.006. [DOI] [PubMed] [Google Scholar]
- 9.Casasent D, Psaltis D. Position, rotation, and scale invariant optical correlation. Applied Optics. 1976;15:1795–1799. doi: 10.1364/AO.15.001795. [DOI] [PubMed] [Google Scholar]
- 10.Kuglin C, Hines D. The phase correlation image alignment method. Proceedings of IEEE International Conference Cybernetics and Society. 1975:163–165. [Google Scholar]
- 11.Hansen P. Rank-deficient and discrete ill-posed problems: Numerical aspects of linear inversion. Society for Industrial and Applied Mathematics (SIAM) 1999 [Google Scholar]


