

Supplemental digital content is available in the text.
Key Words: Glioblastoma, Glioma-initiating cells, Nestin, NG2, Patch clamp
Abstract
Glioma-initiating cells (GICs) represent a potential important therapeutic target because they are likely to account for the frequent recurrence of malignant gliomas; however, their identity remains unsolved. Here, we characterized the cellular lineage fingerprint of GICs through a combination of electrophysiology, lineage marker expression, and differentiation assays of 5 human patient-derived primary GIC lines. Most GICs coexpressed nestin, NG2 proteoglycan, platelet-derived growth factor receptor-α, and glial fibrillary acidic protein. Glioma-initiating cells could be partially differentiated into astrocytic but not oligodendroglial or neural lineages. We also demonstrate that GICs have a characteristic electrophysiologic profile distinct from that of well-characterized tumor bulk cells. Together, our results suggest that GICs represent a unique type of cells reminiscent of an immature phenotype that closely resembles but is not identical to NG2 glia with respect to marker expression and functional membrane properties.
INTRODUCTION
Malignant gliomas are the most frequent and malignant primary brain tumors in adults (1). Despite aggressive multimodal therapies consisting of surgical resection, radiotherapy, and chemotherapy with temozolomide (2), the median survival in glioblastoma multiforme (GBM), the most common malignant glioma, is less than 15 months (2). This is in part caused by the remarkable invasive potential of GBM, which makes complete resection unfeasible (3). Therefore, development of more effective therapies will require the ablation of the cellular population that retains the ability to proliferate and invade after current therapeutic strategies. However, the exact identity (and even the mere existence) of such cell type remains disputed (4).
Transgenic mouse models and gene transfer technologies have provided substantial information on the potential roles of several CNS cell types in the genesis of gliomas (5). Mutations in astrocytes (6), neural stem cells (NSCs) (7), and oligodendrocyte progenitor cells (OPCs) (8, 9) can all induce gliomagenesis, indicating that the ability to give rise to primary tumors may not be restricted to a single cell type; however, the extent to which the cell of origin in mouse models recapitulates the diverse cellular composition of human late-stage tumors remains unknown (5, 10, 11).
Markers characteristic of normal NSCs and progenitor cells, notably nestin (12), glial fibrillary acidic protein (GFAP) (13), and chondroitin sulfate proteoglycan (NG2) (14, 15) have all been demonstrated in biopsies of human GBM. Furthermore, distinct subpopulations of human glioma cells that share common characteristics with NSC/progenitors have been isolated from human neoplasms (16, 17). These populations, termed “glioma stem cells” or “glioma-initiating cells” (GICs), are characterized by the expression of NSC markers and, remarkably, by the ability to differentiate and initiate tumors that recapitulate the hallmark characteristics of the source tumor (17–19). Nevertheless, the cellular origin of GICs remains poorly understood (5, 20). The expression of markers of NSC/progenitor cells in GICs is not unequivocal evidence for an origin in transformed NSC/progenitor cells (21) because, under pathologic conditions, certain marker proteins might confer a selective advantage for glioma cells in the tumor microenvironment and thus not faithfully represent lineage (22).
Novel approaches are therefore needed to gain insight into the identity of GICs. The cellular populations of the normal brain have been thoroughly characterized based on their membrane properties, which represent an electrophysiologic signature of lineage (23–28). The robustness of this fingerprint relies on the high resolution of the patch clamp technique, which allows the measurement of the functional features of an ensemble of molecules in real time (29). This approach has successfully been applied to glioma cells (30, 31) and has allowed the identification of several types of ion channels in primary cells and tumor slices such as Ca2+-activated (31–34) and inwardly rectifying K+ channels (35, 36), chloride channels (37), Ca2+-permeable channels (38, 39), and Na+ channels (40). However, it is unknown if the electrophysiologic profile of GBM cells from the bulk of the tumor retains that of GICs.
In this study, we combined functional membrane property measurements of human GICs with lineage marker determination and differentiation potential. We describe for the first time the membrane properties of GICs and show that they possess a distinct phenotype reminiscent of an immature population and closely resemble NG2 glia with respect to lineage marker expression and electrophysiologic profile. Furthermore, we provide evidence for a cell type–specific ion-channel ensemble that is different from all previously described cell populations in the CNS, thereby presenting an alternative class of membrane-associated target molecules for potential anti-GIC therapies.
MATERIALS AND METHODS
Biopsy Collection and Glioma Sphere Culture
Human glioma sphere cultures were established from GBM specimens obtained at the University Medical Center Göttingen in accordance with the University Medical Center Göttingen Ethical Review Board. Tumors were characterized histologically according to the 2007 World Health Organization Classification of Tumors of the Central Nervous System (41) (Figure, Supplemental Digital Content 1, http://links.lww.com/NEN/A436 shows hematoxylin and eosin–stained human GBM biopsies). Tumor tissue was dissociated using the Neural Dissociation Kit (Miltenyi Biotech, Teterow, Germany), according to the manufacturer’s recommendations. Serum-free culture medium consisted of NeuroBasal medium supplemented with B27 supplement (Invitrogen, Darmstadt, Germany), 10 ng/mL fibroblast growth factor 2, and 20 ng/mL epidermal growth factor (both from R&D Systems, Abingdon, UK).
The tumorigenic potential of the cell lines was tested by orthotopic implantation in immunodeficient mice. All lines used in this study produced tumors with morphologic features of GBM (Figure, Supplemental Digital Content 1, http://links.lww.com/NEN/A436).
Cell Culture
The melanoma cell line B16-V was obtained from the German Collection of Microorganisms and Cell Cultures (DSMZ, Braunschweig, Germany). The cells were maintained in RPMI 1640 medium (Gibco, Darmstadt, Germany) supplemented with 10% fetal calf serum ([FCS] Gibco) at 37°C and 5% CO2 in a humidified atmosphere. The medium was replaced every 2 to 3 days. The cells were subcultured when 60% to 80% confluence was reached. Primary mouse hippocampal cultures were prepared as previously described (42). Primary mouse astrocyte cultures and primary mouse oligodendrocyte progenitors were kind gifts from G.M. Kuscher and Dr. N. Manrique-Hoyos and S. Schmitt, respectively (Max-Planck-Institute of Experimental Medicine, Göttingen, Germany).
Electrophysiology
Dissociated glioma spheres were plated on poly-l-lysine–coated coverslips for 24 to 48 hours before recording. Bath solution contained 140 mmol/L NaCl, 1.8 mmol/L KCl, 2 mmol/L MgCl2, 2 mmol/L CaCl2, 10 mmol/L HEPES (pH 7.3). Alternatively, for experiments in which the extracellular K+ concentration was 130 mmol/L, the bath solution contained 10 mmol/L NaCl, 130 mmol/L KCl, 2 mmol/L MgCl2, 2 mmol/L CaCl2, 10 mmol/L HEPES, ± 10 μmol/L Ba2+ (when indicated) (pH 7.3). Patch pipettes had 3 to 5 MΩ resistance. Intracellular solution contained 130 mmol/L KCl, 10 mmol/L NaCl, 2 mmol/L MgCl2, 2 mmol/L CaCl2, 10 mmol/L EGTA, and 10 mmol/L HEPES (pH 7.3). In experiments where 0 MgCl2 intracellular solution was used, EGTA was replaced with HEDTA. Currents were recorded using an EPC9 amplifier (HEKA Elektronik, Lambrecht, Germany). After achieving whole-cell configuration, cell capacity and series resistance were determined using the Cslow compensation feature of the amplifier. Cells with series resistance more than 8 MΩ before compensation were discarded. Series resistance was compensated to 70% to 80% and readjusted before each sweep. For current clamp experiments, series resistance was controlled in voltage clamp mode before and after stimulation. Cells were discarded if series resistance changes were more than 20% throughout the experiment. Unless otherwise stated, holding potential was −80 mV. Tetraethylammonium chloride (TEA), tetrodotoxin (TTX), α-amino-3-hydroxy-5-methyl-4-isoxazolepropionic acid (AMPA), and cyclothiazide (CTZ) were applied through an external perfusion system (Nanion, Munich, Germany). All toxins and chemicals were from Sigma-Aldrich (Munich, Germany). Stimulus and data acquisition were controlled using Pulse software (HEKA Elektronik). Data analysis was performed using IgorPro (Wavemetrics, Lake Oswego, OR), PulseFit (HEKA Elektronic), and Prism (GraphPad Software, La Jolla, CA).
To determine the extent of gap junctional communication, dissociated glioma spheres were cultured at confluence, and 1% Lucifer yellow (Invitrogen) in intracellular solution was injected through the patch pipette; dye coupling was followed for 30 minutes. Three images were acquired in 10-minute intervals using a Moticam 1000 digital camera and the Motic Images Plus software (Motic, Wetzlar, Germany).
Immunocytochemistry and Immunoblotting
Cells were plated on poly-l-lysine–coated (dissociated glioma spheroids and adherent cultures) or uncoated glass coverslips (primary astrocyte and mouse hippocampal cultures) and immunostained as previously described (42). TO-PRO-3 (Invitrogen) was used to counterstain cell nuclei. The following primary antibodies and the corresponding dilutions were used: anti-GFAP 1:100 (Cell Signaling Technology, Danvers, MA; Promega, Mannheim, Germany), anti–myelin basic protein ([MBP] 1:1000; Covance, Munich, Germany), anti-GluR1 (1:250; Synaptic Systems, Göttingen, Germany), anti–platelet-derived growth factor-α ([PDGFR-α] 1:250; Santa Cruz Biotechnology, Santa Cruz, CA), O4 1:200 (R&D Systems), ELAVL2-4 1:500 (Abcam, Cambridge, UK); and from Millipore (Darmstadt, Germany): anti-NG2 (1:500), anti-NeuN (1:1000), and anti-nestin (1:1000). Fluorescence signals were collected with an LSM 510 Meta confocal microscope (Carl Zeiss, Jena, Germany) using 40× or 63× oil immersion objectives. For Western blotting, primary antibodies against nestin and NG2 were used at 1:1000 dilution. An anti-calnexin antibody (1:2000; Enzo Life Sciences, Lörrach, Germany) or anti-actin antibody (1:3000; Abcam) were used as loading controls.
Real-time Polymerase Chain Reaction
Total RNA obtained from cultures using RNeasy mini kit (Qiagen, Hilden, Germany) was reverse transcribed (SuperScript; Invitrogen, Karlsruhe, Germany) with oligo-dT. Primers were designed using the Universal Probe Library (UPL) assay design center (Roche, Mannheim, Germany). Real-time polymerase chain reaction (PCR) was performed on the template using the UPL system (Roche) in a LightCycler 480 (Roche). Human actin and the human transferrin receptor were used as a control template for RNA integrity and PCR performance. Relative quantification was performed using the REST software (Relative Expression Software Tool) (43, 44). Gene names and their corresponding reference sequences, specific primers, and UPL probes are listed in Table, Supplemental Digital Content 2, http://links.lww.com/NEN/A437.
Differentiation Assays
Cells plated on glass coverslips in neurobasal medium were allowed to adhere overnight. Growth factors were then removed or medium was supplemented with 10% FCS, 100 ng/mL ciliary neurotrophic factor (CNTF), or 10 μmol/L forskolin (both from Sigma-Aldrich, Munich, Germany). Alternatively, modified SATO medium (mSATO) containing l-tyroxine and triiodothyroxine (Millipore), as described in Fitzner et al (45), was used. Cultures were analyzed 3 to 7 days later.
Flow Cytometry
Single-cell suspensions were stained with mouse monoclonal anti-human NG2/MCSP-phycoerythrin–coupled antibody (R&D Systems) according to the manufacturer’s protocol and further incubated with TO-PRO-3 for 5 minutes to document membrane integrity and analyzed in a FACSAria flow cytometer (BD Biosciences, Heidelberg, Germany). Fluorescence emission was collected using 576/26 and 660/20 filters for phycoerythrin and TO-PRO-3, respectively. Linear forward and side scatter and TO-PRO-3 gates were used to identify single viable cells, and at least 104 events were recorded. Data processing was done with FlowJo v7.5 software (Tree Star, Ashland, OR).
Statistical Analysis
Data were analyzed using Prism or IgorPro. Student t-test, χ2, or one-way analysis of variance (ANOVA) with post hoc Tukey or Dunnett method was used as appropriate. Unless otherwise stated, all data are reported as mean ± SEM. Asterisks indicate p < 0.05 (*), p < 0.01 (**), and p < 0.001 (***).
RESULTS
GIC Lines Express Markers of Neural Stem and Progenitor Cells
NG2 expression was determined by Western blot. We detected a band of the expected size (∼280 kDa) in all lines tested (n = 5) (Fig. 1A). Then, we measured the percentage of positive cells for membrane-associated NG2 by flow cytometry. We detected a single population with a shift in the fluorescence intensity of 1 to 2 orders of magnitude in all cell lines (Fig. 1B). At least 80% of the cells showed signals above background. No changes in fluorescence intensity were detected in B16, an NG2-negative mouse melanoma line (46).
FIGURE 1.

Chondroitin sulfate proteoglycan (NG2) and nestin are widely expressed in dissociated glioma spheroids. (A) Representative Western blots showing expression of NG2 (upper panel) and nestin (lower panel) in glioma-initiating cell (GIC) lines. Total mouse brain lysates (brain), B-16 mouse melanoma cell line (B-16), and total mouse liver lysates were used as controls for NG2. For nestin, U251 glioma cells and total mouse brain were used as positive and negative controls, respectively. (B) Flow cytometry indicates the membrane expression of NG2 (red) in more than 84% of the cells in all GIC lines. Black, unlabeled controls. B16 cells were used as a negative control. AU, arbitrary units.
We next determined the subcellular localization of NG2 in glioma cells by immunocytochemistry. NG2 signal was localized in a nonuniform fashion to the cell membrane. In No. 10 and No. 1034, there was strong overall staining of the membrane, with an accumulation in some cell processes. For No. 1063, No. 1095, and No. 1051, localized expression in processes was predominant and was accompanied by weaker and nonhomogeneous staining of the cell membrane (Fig. 2).
FIGURE 2.

Immunofluorescence images of glioma-initiating cells labeled with anti–chondroitin sulfate proteoglycan (NG2) (green) and anti-nestin (red) antibodies. Number 1034 is enlarged to illustrate structural details (top row). TO-PRO-3 (TP3) was used as a nuclear marker (blue). Scale bar = 20 μm.
Because NG2 is a known marker of OPC/NG2 glia, we tested the expression of another OPC-specific marker, PDGFR-α (47). All NG2-positive cells analyzed expressed PDGFR-α (No. 10, n = 141; No. 1034, n = 52; No. 1051, n = 34; No. 1063, n = 30; No. 1095, n = 25). Very few cells (<2%) expressed PDGFR-α without evident NG2 expression.
We then tested whether nestin, a protein often found in progenitors and GICs (20), was also expressed in the lines. A band of approximately 230 kDa, compatible with the molecular weight of nestin, was detected by Western blot in all lines (Fig. 1A); by immunocytochemistry, there was a strong signal in approximately 98% of the cells. Both proteins colocalized to the same cells; double labeling with anti-NG2 and anti-nestin antibodies confirmed that a vast majority of cells were NG2 positive/nestin positive (Fig. 2).
Unlike NG2 and nestin, GFAP expression was variable across lines. Numbers 10 and 1034 had a subpopulation with marked GFAP expression (41% ± 8% and 31% ± 2% cells, respectively), whereas cell lines 1063, 1095, and 1051 were nearly negative (Fig. 3A). No reactivity was observed for O4, MBP, ELAVL2-4, or NeuN in any of the lines.
FIGURE 3.
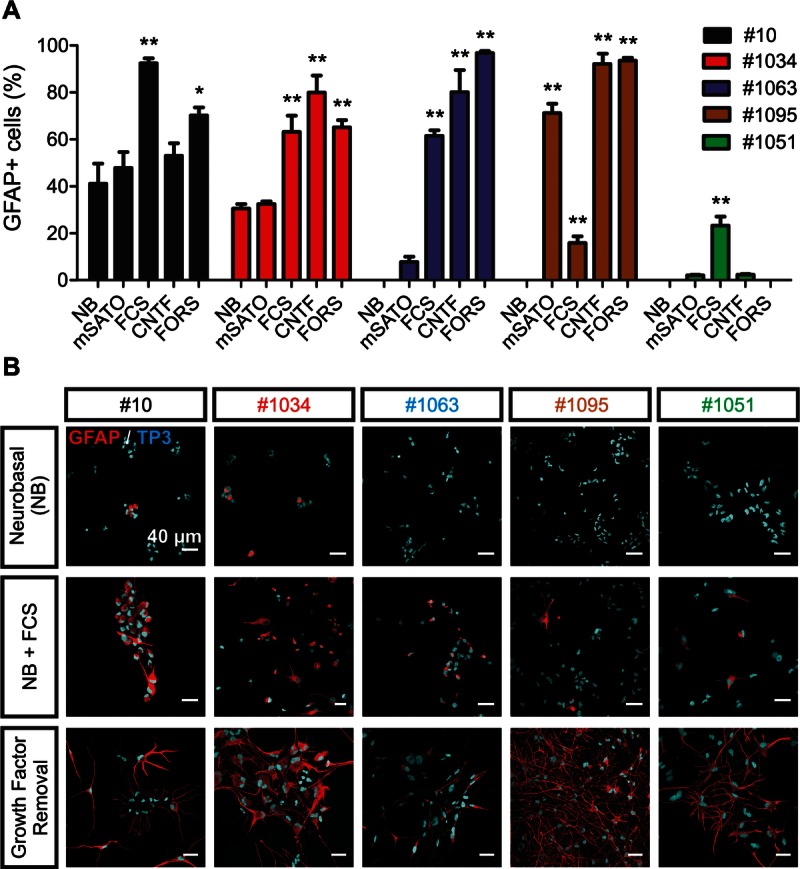
The differentiation potential of glioma-initiating cells (GICs) is restricted to the astroglial lineage. (A) Percentage of glioma cells with marked glial fibrillary acidic protein (GFAP) expression (GFAP+) in response to distinct differentiation stimuli: modified SATO medium (mSATO), ciliary neurotrophic factor (CNTF), forskolin (FORS), or fetal calf serum (FCS). Cells grown in neurobasal medium (NB) were used as a control (one-way ANOVA with Dunnet test, n ≥ 3 independent experiments). (B) Glial fibrillary acidic protein immunofluorescence of GICs. Glial fibrillary acidic protein expression increases, and the morphology changes in response to FCS (middle row) and on growth factor removal (lower row) as compared with the control condition (NB, upper row). Scale bar = 40 μm.
GICs Show Preferential Astroglial Differentiation
A central feature that NSCs and OPCs share with GICs is their ability to produce a phenotypically heterogeneous lineage (10, 17, 20). The lineage of a cell’s progeny can also shed light on the identity of a progenitor cell. To determine the differentiation capacity, we assessed the expression of markers of astroglial, oligodendroglial, and neuronal lineages in neurosphere-forming glioma cells under experimental conditions known to induce differentiation in normal NSCs and OPCs.
The addition of 10% FCS produced a significant increment in the percentage of cells with marked GFAP expression. The increase was in the range of 30% to 50% for those cell lines with initial heterogeneous GFAP expression (No. 10 and No. 1034) and between 15% and up to 63% in those cell lines with low or absent basal GFAP expression (No. 1063, No. 1095, and No. 1051) (Fig. 3A). The response to FCS was observed in all lines and was also characterized by morphologic changes, that is, the appearance of multiple cellular processes (Fig. 3B). A more dramatic effect was observed on growth factor removal, where intense GFAP expression was detected in practically all cells across lines and was accompanied by marked morphologic changes (Fig. 3B). Remarkably, GICs showed no expression of the late neuronal marker NeuN or oligodendroglial markers O4 and MBP in response to these treatments, suggesting a propensity toward an astroglial differentiation. Interestingly, in cell lines 1095 and 1051, a small percentage of cells (<5%) expressed the early neuronal marker ELAVL2-4 after 7 days of growth factor removal. To test the apparent incompetence of GICs to produce mature neurons or differentiate along the oligodendroglial lineage, we used more specific differentiation regimens. To this end, the lines were grown in the presence of CNTF, mSATO, or forskolin to promote differentiation into the oligodendroglial (45, 48) or neuronal (9) lineage, respectively.
Contrary to control OPCs, GICs did not differentiate along the oligodendroglial lineage in any of the treatments, as evidenced by a lack of MBP or the early marker O4 (data not shown). Instead, an increment in the percentage of cells with markedly enhanced GFAP expression was observed in those lines with low basal GFAP levels (8% in No. 1063, p = 0.03; 2.1% in No. 1051, p = 0.01; and 71% in No. 1095, p < 0.0001), similar to the response observed on growth factor removal and 10% FCS (Fig. 3A). In No. 1095, the increase was even more pronounced under mSATO than with 10% FCS. Cell line 10 also showed a tendency to an increase in GFAP-expressing cells on exposure to mSATO or CNTF. A similar effect was observed in No. 1034 in response to mSATO and No. 1051 in response to CNTF (Fig. 3A). No NeuN expression could be detected after 7 days with forskolin, and, as with the treatment with growth factor removal, only a small proportion of cells showed ELAVL2-4 expression after forskolin treatment in No. 1095 and No. 1051 (Figure, Supplemental Digital Content 3, http://links.lww.com/NEN/A438). A significant increase in GFAP-expressing cells was again observed in all lines, although only marginally in No. 1051 (Fig. 3A).
GICs Have Reduced Expression of Connexins and Exhibit No Dye Coupling
Concomitant expression of NG2, PDGFR-α, nestin, and GFAP and a differentiation potential preferentially oriented toward an astroglial lineage do not conform to the description of any CNS subpopulation. Therefore, we wanted to know whether glioma cells exhibit functional features attributed to normal NSCs, NG2 glia, or rather of terminally differentiated glial populations.
A distinctive feature of normal CNS subpopulations is the extent of gap junctional communication, a type of intercellular communication mediated by gap junctional channels that are formed by the docking of hemichannels from adjacent cells. The channel proteins encoded by the connexin genes exhibit preferential lineage expression. For example, connexin 30 (Cx30) and Cx43 represent typical astroglial connexins, whereas Cx47, Cx32, and Cx29 are mainly present in oligodendrocytes (49). Therefore, we determined the relative RNA expression of these connexins in GICs compared with human brain total RNA by real-time PCR. Interestingly, GICs expressed both the oligodendroglial Cx29 and the astroglial Cx43 but at significantly reduced levels (<43% and 34%, respectively) compared with human brain (Fig. 4A). Moreover, in some cell lines (No. 1063 and No. 1051), the relative expression of Cx43 was dramatically reduced (6% and <1%, respectively), and for Cx29 in No. 1034 and No. 1051, the levels were approximately 10%. Other oligo- and astroglial connexins (Cx47, Cx32, and Cx30) were undetectable (data not shown).
FIGURE 4.

Glioma-initiating cells (GICs) have reduced expression of connexins and no dye coupling. (A) Normalized expression of connexin 29 (Cx29) (upper panel) and Cx43 RNA (lower panel) showing a significant relative reduction compared with that of human brain. (B) Upper panel: Western blot for Cx43. A faint band of the expected size (∼43 kDa) was detected in most of the cell lines. No signal was observed for No. 1051. Total mouse brain was used as a positive control and β-actin as a loading control. For this experiment, 30 μg of protein was loaded in each lane. Lower panel: The Cx43 signal was normalized to β-actin intensity. An average of 3 independent experiments is shown. Error bars represent SEM. (C) Surface plot representing the acquired pixel intensity of cells at 1 and 10 minutes after loading with the fluorescent dye Lucifer yellow in different cultures. Note that, in astrocytes (upper panel), a second peak could be recorded after 10 minutes. For the same time interval, just a single peak could be recorded in GICs. hActin/hTFR, human actin/human transferrin receptor.
Given the preferential astrocytic differentiation of GICs, we tested whether the reduced expression of Cx43 at the RNA level was reflected at the protein level by performing Western blot. We detected a faint band at the expected molecular weight (∼43 kDa) for Cx43 in most GICs; no band was observed for No. 1051 (Fig. 4B).
Additional evidence for the degree of gap junctional communication was obtained at a functional level by measuring the extent of cell-to-cell transfer of fluorescent dye (dye coupling). NG2 glial cells filled with fluorescent dyes show no communication with neighboring cells (25, 50), whereas astrocytes exhibit extensive intercellular connection (51). Therefore, we imaged confluent GICs at 1, 10, and 30 minutes after successful loading of single cells with Lucifer yellow. With the exception of a single No. 10 cell, it was not possible to detect spreading of fluorescence signal to nearby cells in any of the lines tested (No. 10, n = 7; No. 1034, n = 8; No. 1063, n = 4; No. 1095, n = 9; No. 1051, n = 5) (Fig. 4C), indicating low or absent junctional coupling.
GICs Have an Intermediate Membrane Resistance and Exhibit Voltage-Dependent Outward Currents
The ensemble of ionic conductance present at the plasma membrane confers characteristic electrophysiologic signatures to the cells of different lineages (23). Consequently, to measure the ionic currents and functional membrane properties of GIC, we performed whole-cell patch clamp recordings of dissociated spheroids.
The membrane resistance of distinct CNS cellular populations lies within a characteristic range, as reported for astrocytes (∼10 MΩ), (50, 52), oligodendrocytes (<200 MΩ) (24), NG2 glia (∼0.2 and 1 GΩ) (53), and neural progenitors of the subventricular zone (up to 4 GΩ) (26). When we measured the membrane resistance of GICs, we observed an intermediate resistance (300–600 MΩ) in all lines (No. 10, 397.3 ± 36.46 MΩ, n = 8; No. 1034, 497.0 ± 158.5 MΩ, n = 4; No. 1063, 631.8 ± 45.9 MΩ, n = 15; No. 1095, 401.1 ± 44.24 MΩ, n = 8; No. 1051, 331.7 ± 39.75 MΩ, n = 10) (Table).
TABLE.
Membrane Properties and Differentiation Potential of Glioma-Initiating Cells

The complex arrangement of voltage-dependent ion channels provides the membrane of distinct cell lineages with characteristic responses to voltage stimuli (23). Thus, by applying depolarizing steps from −20 and up to 100 mV for 250 milliseconds from a holding potential of −80 mV, we recorded a complex current characterized by transient inward and outward voltage-dependent components. The outward current was present in all cells studied and could be dissected into an inactivating (IA) and a sustained (IDR) component (Fig. 5A).
FIGURE 5.

Voltage-dependent currents in glioma-initiating cells (GICs). (A) Representative current of a No. 1095 cell in response to a voltage stimulation protocol (Ai, inset) with fast inward and outward components (Ai). The outward current could be dissected into 2 components, that is, sustained IDR (Aii) and inactivating (IA) (Aiii). For IDR, a -20 mV prepulse was applied (Aii, inset). IA was isolated by subtracting IDR from the total current (Aiii, inset). (B) I–V relationship of IA. No significant differences were found in the mean activation time constants of IA. Error bars represent SEM. (C) Peak current normalized to peak at 100 mV (Ci, top panel) against prepulse potential (Ci, bottom panel) of IA is used to plot the voltage-dependent inactivation of IA (Cii). Data points are mean I/Imax values ± SEM. Continuous lines represent a fit to the data.
Sustained component IDR was isolated by applying a 200-millisecond prepulse to −20 mV that inactivated IA. To study the biophysical parameters of IA, it was isolated by digitally subtracting IDR from the total outward current elicited when the prepulse was held at −80 mV (Fig. 5A). Inactivating component IA had a fast rising phase, with a similar time to peak in all cell lines (∼2 milliseconds; p = 0.21) and a double exponential decay with fast (8.6 ± 0.6 milliseconds) and slow (97.7 ± 27.1 milliseconds) components. No significant differences were found in their inactivation time constants (fast, p = 0.96; slow, p = 0.14) (Table).
Most cells in all lines tested expressed IA as follows: 24 of 32 cells in No. 10; 19 of 20 in No. 1034; 11 of 17 in No. 1063; 26 of 28 in No. 1095; and 16 of 24 cells in No. 1051. A significant variation was observed in the IA density (p = 0.003), where the values ranged from 2.3 ± 0.8 pA/pF in No. 1051 (n = 6) to 122.9 ± 55.1 pA/pF in No. 1034 (n = 10). Despite the differences in its density, the voltage dependence of the current showed no significant differences between lines, as evidenced by a current to voltage (I–V) relationship with a global mean half activation of −33.5 ± 3.1 mV (p = 0.11) and a global mean half inactivation of −74.5 ± 1.5 mV (p = 0.13) (Fig. 5B, C).
As for IA, variations in the average steady state IDR density were measured across cell lines. It was possible to identify lines with a higher overall IDR density: No. 10, 45.2 ± 3.8 pA/pF (n = 46); No. 1034, 39.5 ± 6.4 pA7/pF (n = 18); No. 1063, 17.7 ± 4.9 pA/pF (n = 25); and others with lower values: No. 1051, 8.4 ± 1.3 pA/pF (n = 28) and No. 1095, 6.0 ± 1.0 pA/pF (n = 35) (Fig. 6B). In addition, IDR was reversibly and partially blocked (∼70%) by 10 mmol/L TEA in all cell lines tested (No. 10, n = 6; No. 1034, n = 6; No. 1063, n = 4; No. 1095, n = 7; No. 1051, n = 10), compatible with a current mediated by voltage-gated K+ channels (Fig. 6C).
FIGURE 6.

Properties of sustained current (IDR) in glioma-initiating cells (GICs). (A) Representative current traces of a No. 10 cell (upper panel) in response to variable voltage stimuli (lower panel). The steady state current is larger at 40 mV than at 100 mV (arrows). (B) IDR density at 40 mV of individual cells for all cell lines tested. Each point represents a single cell. Red lines represent the mean value. (C) Ten millimolar tetraethylammonium chloride (TEA) blocked IDR elicited by a voltage pulse to 40 mV (inset) to approximately 70%. (D) I–V relationship of IDR in all cell lines. Continuous lines represent a fit to the data. Mean ± SEM. (E) Percentage of cells with and without rectification across lines. (F) Significant differences in IDR density at 40 mV in No. 1063 and No. 1095 between cells with (white) and without (black) rectification. (G) Normalized I–V relationship of No. 10 cells in the presence (solid circles) or absence (open circles) of intracellular magnesium. Solid lines represent a fit to the data. Error bars represent SEM and are in some cases obscured by the markers. Asterisks represent p < 0.05. (H) Kv1.5 (red) immunostaining in GICs showing marked membrane pattern in all cells. Cell nuclei were counterstained with TO-PRO-3 (TP3, blue). Scale bar = 20 μm.
Despite their differences in current density, the I–V relationship of IDR revealed a similar half activation potential (approximately −13 mV) for all cell lines (p = 0.58). Moreover, a rectification of the current at approximately 40 mV was also observed in all groups (Fig. 6D). The rectification was present in more than 95% of the cells in No. 10 (100%, n = 40), No. 1034 (100%, n = 15), and No. 1051 (95%, 18 of 19 cells). For cell lines 1063 and 1095, the percentage of positive cells was approximately 60% (n = 22 and n = 17, respectively) (Fig. 6E). Cells that did show rectification had a significantly larger current density that, on average, was 3 to 6 times larger than that of cells without rectification (No. 1063, p = 0.01; No. 1095, p = 0.04), suggesting that the phenomenon was related to current magnitude (Fig. 6F). In addition, we explored the effect of intracellular Mg2+ on IDR rectification using No. 10 as a representative cell line. We observed that removal of Mg2+ from the intracellular solution abolished the rectification (n = 6), suggesting an Mg2+-dependent mechanism (Fig. 6G). This observation prompted us to test the expression of Kv1.5, a delayed rectifier potassium channel that is ubiquitously expressed in OPCs and that exhibits Mg2+-dependent rectification; it might, therefore, correspond to the major contributor of IDR in normal OPCs (54). By immunocytochemistry, we could observe an abundant expression of Kv1.5 in the cell membrane of GICs in all lines (Fig. 6H).
Voltage-Dependent Na+ Currents and Regenerative Voltage Transients
Besides the described currents, the electrophysiologic profile of glioma cells was characterized by a fast transient inward current within the first 2 milliseconds of a depolarizing pulse between −40 and 40 mV (Fig. 7A). In all cases (n = 4–7), more than 95% of the current was reversibly blocked by 500 nmol/L TTX (Fig. 7C). The I–V relationship showed no significant differences in half-maximal activation (−30 to −26 mV, p = 0.59) or reversal potential (∼50 mV, p = 0.68) (No. 10, n = 11; No. 1034, n = 12; No. 1063, n = 11; No. 1095, n = 19; No. 1051, n = 4) (Fig. 7D) (Table). The kinetic and pharmacologic characteristics indicate that voltage-gated Na+ channels mediate the inward current. The density of INa at −20 mV ranged from 1.4 ± 0.5 pA/pF in No. 1051 to 8.7 ± 0.9 pA/pF in No. 10 and significantly varied among lines (p < 0.001) (Fig. 7B). Voltage-gated Na+ channel currents were found in most cells within a line as follows: No. 10, 98% positive cells (n = 54); No. 1034, 100% (n = 23); No. 1063, 82% (n = 22); and No. 1095, 97% (n = 37), with the exception of No. 1051, where only 10 of 30 cells expressed INa. To quantify the percentage of cells expressing sodium channels, we stained the cells with a pan-sodium channel antibody. The labeling showed a signal cluster adjacent to the nucleus and, in some cases, a peripheral pattern suggestive of membrane localization. The proportion of positive cells was similar to that found by electrophysiology in most cases: No. 10, 96%; No. 1034, 93%; No. 1063, 76%. For the remaining 2 cell lines, both methods gave different results, where No. 1095 showed less (56%) and No. 1051 more (72%) positive cells than by electrophysiology (χ2 = 19.94, p = 0.0005). This might reflect a difference in the sensitivity of the 2 methods because immunocytochemistry detects channels in both the intracellular and membrane compartments, whereas electrophysiology can only detect membrane-resident functional channels.
FIGURE 7.

Fast transient inward currents are blocked by tetrodotoxin (TTX) and have similar voltage dependence across lines. (A) Complex current of a No. 1095 cell (upper panel, same as in Fig. 5) in response to a voltage protocol (lower panel). In the first 10 milliseconds, a transient inward current can be observed (*, inset). (B) Current density was similar across cell lines (Bii) as determined by the peak current at 0 mV (Bi). (C) Current traces of a single cell in standard extracellular solution (upper row), on application of 500 nmol/L TTX (middle row), and after washing (lower row). The red trace corresponds to the stimulation voltage. (D) I-V relationship of the inward current (mean ± SEM); continuous lines represent a fit to the data.
The expression of voltage-gated Na+ channels in glioma cells, astrocytes, and NG2 glia has been reported to provide cells with the ability to produce voltage spikes (23, 28, 30). After confirming the expression of voltage-gated Na+ channels in GICs, we tested the excitability of the cell membrane by measuring the voltage response to variable current injections. On current stimulation approximately 50 pA, all No. 1034 cells (n = 5) or approximately one third of the cells in other lines (No. 10, 5 of 18 cells; No. 1063, 7 of 19 cells; No. 1095, 9 of 26 cells; No. 1051, 3 of 8 cells) produced a single regenerative voltage transient (Fig. 8A). The transient was broad, with a similar width at baseline for all cell lines (range, 7.24–31.5 milliseconds; p = 0.17), and slow, with a peak maximum rate of rise (MRR) of 20.26 ± 4.3 mV per millisecond in No. 1095 (n = 7) and a peak maximum rate of fall (MRF) of −6.2 ± 2.8 mV per millisecond in No. 1034 (n = 5), not significantly different between cell lines (MRR, p = 0.06; MRF, p = 0.32) (Fig. 8B; Table). Cells in which transients could be elicited had a significantly larger INa density in No. 1095, p = 0.002, and No. 1051, p = 0.04. In the remaining cell lines, a similar tendency was observed, although no significance was reached. Voltage transients were completely abolished when 500 nmol/L TTX was applied to the extracellular solution (n = 7) (Fig. 8B). A comparison of the shape and amplitude of the transients between cell lines is depicted in Figure 8C and the Table.
FIGURE 8.

Voltage transients in glioma-initiating cells (GICs). (A) Voltage response to a stepwise current injection protocol (inset) characterized by a single regenerative voltage transient. (B) The first derivative of the voltage (Bii) showed no significant differences in the mean maximum rate of rise and maximum rate of fall (Biii) (one-way ANOVA). The transient was abolished on the application of tetrodotoxin (TTX) (Bi). (C) Representative voltage trace from a No. 1034 cell (same as in [A], [B]) showing a schematic representation of the reference points used to measure different biophysical parameters (Ci). The mean values for absolute regenerative transient peak (Cii), relative overshoot (Ciii), relative afterhyperpolarization (AHP) (Civ), and transient width (Cv) are represented for each cell line. Error bars represent SEM. * p < 0.05.
Functional AMPA Glutamate Receptors in GICs
Glutamate receptors of the AMPA type have been extensively studied in distinct populations of the normal CNS, particularly in the context of synaptic coupling between neurons and NG2 glia/astrocytes (24, 50, 55, 56), as well as in gliomas (57). To test whether GICs express functional glutamate receptors, we recorded the current response at −80 mV on application of 150 μmol/L AMPA. In all cells tested (No. 10, n = 15; No. 1063, n = 7; No. 1095, n = 7; No. 1051, n = 9; and No. 1034, n = 11), we measured an inward current with an average density between 0.5 ± 0.12 pA/pF in No. 1063 and 2.5 ± 0.9 pA/pF in No. 10 (Fig. 9A, B). The current had a mean reversal potential of 2.6 ± 3 mV for all lines. After a 4-second application of 100 μmol/L CTZ, a positive allosteric modulator of glutamate receptors of the AMPA type (58), we observed a significant 6- to 20-fold increase in the current elicited by AMPA in all cell lines (No. 10, p < 0.0001, n = 15; No. 1063, p = 0.015, n = 7; No. 1095, p = 0.03, n = 7; No. 1051, p = 0.003, n = 9; No. 1034, p = 0.001, n = 11) (Fig. 9A, B), suggesting that the current was mediated by glutamate receptors of the AMPA type. In addition, we could confirm the presence of GluR1 by immunostaining (Fig. 9C).
FIGURE 9.

α-Amino-3-hydroxy-5-methyl-4-isoxazolepropionic acid (AMPA) receptors in glioma-initiating cells. (A) An inward current was elicited on application of AMPA (left, upper panel) and further potentiated by cyclothiazide (CTZ) (left, lower panel). The current reverted close to 0 mV (right). (B) CTZ produced an increment in the AMPA currents in all cell lines (one-way ANOVA with Dunnet test). Error bars represent SEM. * p < 0.05; ** p < 0.01; *** p < 0.001. (C) Immunostaining of GluR1 (green) showing a punctate signal in all cells. Note that neuronal cultures from primary hippocampal cultures (lowermost panel, right) show heterogeneous staining. Nuclei were stained with TOPRO-3 (blue). Scale bar = 20 μm.
Differentiation Is Accompanied by Changes in the Electrophysiologic Profile of GICs
The membrane properties of GICs resemble an immature phenotype. Therefore, we wanted to test whether this electrophysiologic profile was an invariable feature of GICs irrespective of morphology and marker expression or a variable trait faithfully reflecting maturation status.
To test these possibilities, we performed patch clamp experiments of GICs after growth factor removal. By using a voltage ramp from −120 to 120 mV, we observed a current with linear voltage dependence and an overall reversal potential at −75.4 ± 3 mV, which showed no significant differences between lines (Fig. 10A). Furthermore, by increasing the extracellular K+ concentration from 2.5 to 130 mmol/L, a reversible and significant change in the global mean reversal potential to 4.9 ± 0.8 mV could be observed (Fig. 10B), suggesting K+ conductance. In this configuration, the inward current had a mean magnitude at −80 mV of −9.1 ± 1.8 nA for all lines. The inward component could be reversibly blocked (∼60%) by the application of 10 μmol/L Ba2+ to the extracellular solution (Fig. 10C, D).
FIGURE 10.

Changes in the electrophysiologic properties of glioma-initiating cells on differentiation. (A) Representative current trace of a No. 1034 cell in response to a voltage ramp from −120 to 120 mV with 2.5 mmol/L (red) or 130 mmol/L (black) K+ in the extracellular solution. (B) The change in K+ concentration produced a significant change in the reversal potential in all cell lines. (C) Representative trace of a No. 1095 cell at 130 mmol/L extracellular K+ before (red) and after (black) the application of 10 μmol/L Ba2+ in the bath solution. (D) No significant differences in the percentage of Ba2+ block of the inward component of the current shown in (A) across cell lines. Bars represent mean values ± SEM.
DISCUSSION
In this study, we addressed the question of the identity of human GICs using a combination approach based on marker expression, differentiation potential, and functional membrane properties. We show that, besides the expression of NSC and progenitor cell markers, human GICs show restricted differentiation potential and characteristic electrophysiologic properties of an immature phenotype. Furthermore, we demonstrate that the membrane properties of GICs reflect their differentiation status.
In agreement with previous reports, the cells used in this study expressed markers of neural stem and progenitors cells (10). Notably, we observed coexpression of NG2 and PDGFR-α, both distinctive markers of NG2 glia (47). Other groups have also reported that NG2-positive/PDGFR-α–positive cells constitute most of the NG2-positive populations in human GBM (14). The antigenic profile is suggestive of an OPC lineage; however, GICs in our series also expressed nestin and GFAP and hence cannot be classified as NG2 glia based solely on this criterion. First, NG2 glia do not express GFAP under normal conditions (59, 60). Also, a thorough marker analysis of the mouse SVZ did not find NG2 expression in neural progenitors (60); however, the expression of nestin has been reported in NG2 glia dissociated from the normal brain (59). In addition, the coexpression of nestin and NG2 has been reported in GBM, suggesting that the coexpression of these 2 markers might be a particular trait of glioma cells (13). Alternatively, it has been proposed that the expression of NG2 in GBM is the result of environmental selective pressure and carries no relationship with lineage (22).
Another argument that speaks against a pure OPC identity of GICs is their limited differentiation potential. The characteristic bipotential (oligo-astroglial) differentiation of OPCs observed in vitro on addition of FCS (61) was not recapitulated by GICs. Contrary to the response of control mouse OPCs (Figure, Supplemental Digital Content 3, http://links.lww.com/NEN/A438, shows O4 and MBP expression in OPCs after differentiation with mSATO), we could not observe the expression of early (O4) or late (MBP) oligodendroglial markers in GICs after several differentiation regimens. Nevertheless, in agreement with other studies, GICs did respond to most of the differentiation stimuli by increasing their GFAP expression and with characteristic morphologic changes, suggesting conserved differentiation ability of an astroglial-like lineage. Moreover, the preferential astroglial commitment is supported by the electrophysiologic changes observed during differentiation, namely, increase in K+ conductance, linearization of the current-voltage relationship, and expression of Ba2+-sensitive inward currents—all characteristic features of mature astrocytes (62).
The expression of early, but not late, markers of neuronal lineage in a few cells in just 2 lines suggests that some cells might retain the ability for multipotential differentiation. Together with the irregular GFAP expression in undifferentiated cells, this illustrates the heterogeneous nature described for GICs both between and within cultures, which might, in turn, reflect the phenotypic diversity of GBM. The question of the individual contribution of each individual population to tumor formation remains unresolved and lies out of the scope of this study.
Although incompatible with a pure OPC or NSC phenotype, the limited differentiation potential of GICs is in agreement with the antigenic properties of GBMs, which typically express GFAP and rarely express markers of mature neurons or oligodendrocytes (13).
The undetectable dye coupling (except for 1 cell in line 10) suggests reduced or absent gap junctional communication of GICs, in contrast to mature oligodendrocytes and astrocytes. However, these results must be interpreted cautiously because the characteristics of the intercellular communication in a laminar arrangement might differ from those of GIC spheroids. Also, the preparation used might lead to an underestimation of the number of cells between which dye spreading does occur particularly if the cultures retain some spheroid-like growth pattern. Nevertheless, the low RNA expression levels of the principal oligo- and astroglial connexins in GICs support the data from dye coupling experiments and suggest overall reduced gap junctional communication.
Most CNS lineages have a well-characterized robust electrophysiologic signature (23, 25). Therefore, to obtain further quantitative evidence about the identity of GICs, we measured their membrane properties using patch clamp to characterize several membrane parameters at a functional level simultaneously in real time. We determined that GICs have a membrane resistance consistent with that reported for normal NG2 glia (53) and 2- to 30-fold larger than that reported for astrocytes and oligodendrocytes (50). Because the membrane resistance was in all cases between 300 and 600 MΩ, the significant differences observed probably reflect smaller variations in the ion channel composition of the distinct GIC lines rather than a major difference in the cell lineage.
The low membrane resistance of normal astrocytes and oligodendrocytes might be caused by the presence of K+ leak channels and gap junctional communication, which may account for the linear I–V relationships observed in voltage clamp experiments (24, 25). In contrast, GIC currents were characterized by strong voltage dependence and no dye coupling. The outward IDR and IA have been described in several cell lineages. For example, IA and IDR are present in NG2 glia and astrocytes (63). In NSCs, IDR is widely expressed, and IA has been reported by 1 group (27) but 2 other groups did not detect this current in SVZ cells (26, 64). Although IA was a prominent feature of GICs, its density was variable across groups.
In contrast to IA, IDR expression was ubiquitous, although with variable characteristics regarding rectification and current density between lines. The voltage dependence of the rectifying IDR and IA suggests that the underlying ion channels share similar physiologic properties, but the presence of cells without rectification opens up the possibility that the molecular correlate of IDR is distinct, implying heterogeneity. At current densities of 4 to 6 pA/pF, changes as small as 1 to 2 pA/pF between a 100- and a 40-mV pulse might, in this context, produce a reclassification of a particular cell. Therefore, the claim that rectifying and nonrectifying cells correspond to essentially different cell types might be premature.
Furthermore, the intracellular Mg2+ dependence of rectification, together with an ubiquitous Kv1.5 membrane expression, indicates low molecular heterogeneity of the IDR correlate in GICs, analogously to normal NG2 glia, where the major molecular correlate of IDR is Kv1.5 (54), which exhibits Mg2+-dependent rectification (65).
Differences in current densities across lines were apparently consistent and proportional, irrespective of current type (IDR, INa, IAMPA). Conversely, other functional properties such as voltage dependence, blocker/modulator sensitivity, and biophysical properties of voltage transients were not significantly different between groups. These considerations suggest that the membrane of GICs may have a similar global ion channel composition, which might differ in the overall amount or conductance of the channels, depending on the particular culture.
Whether the current density reflects other biologic properties of GICs can be inferred from the dissimilar responses observed in the differentiation assays. Cells with overall lower current densities (No. 1095 and No. 1051) had concomitantly lower numbers of GFAP-positive cells in control conditions, were less responsive to differentiation with FCS, and produced few ELAVL2-4–positive cells. These features contrasted with those of cell lines with high current densities, such as No. 10 and No. 1034, whereas No. 1063 exhibited intermediate behavior.
In addition to the previously mentioned interculture variations, differences within cell lines were also observed. Notably, IA could not be detected in approximately 20% and INa in approximately 40% of the cells. Furthermore, for any given line, variations in the current magnitudes of IDR, IAMPA, and INa were also detected. In normal neural progenitors, NG2 glia, and oligodendrocytes, changes in current density of INa, IDR, and IA have been associated with differentiation status. For example, in neural progenitors and NG2 glia, INa and IA inversely correlate with cell maturity (27, 66). The coexistence of GICs of distinct differentiation states within the same culture is in line with the current knowledge of the biology of GICs. Furthermore, this opens up the possibility that the electrophysiologic profile could offer a sensitive method to detect maturational changes for which other markers are not yet available (67). However, other confounding factors such as cell cycle–related changes of channel expression (28) or genetic aberrations might as well account for the heterogeneity of the currents.
Nevertheless, the changes in the electrophysiologic profile of GICs observed on growth factor removal support the notion that the maturation status might underlie the electrophysiologic heterogeneity of glioma cells. Moreover, this finding provides functional evidence to the widespread morphologic/immunocytochemical observations that GICs differentiate into astrocyte-like cells.
In this study, we also report the ability of GICs to produce regenerative voltage transients, a feature of NG2 glia (23, 28) and astrocytes (68). Furthermore, in agreement with work on normal NG2 glia, just a fraction of GICs exhibited voltage transients (28, 69). Alternatively and irrespective of cell lineage, sodium spikes might represent a peculiar trait of glioma cells (30, 70).
We also determined the functional expression of glutamate receptors of the AMPA type in GICs. Although the expression of AMPA receptors is common for astrocytes, progenitors, and glioma cells, this observation highlights the importance of glutamate in the context of malignant glioma (57). In addition, the identification of GluR1 together with Kv1.5 as potential molecular correlates that contribute to the macroscopic currents of GICs constitute the first step toward the development of GIC-specific therapies. The most prominent example of the approach we propose (electrophysiologic characterization–channel identification–therapy design) is the work by the Sontheimer (71) who identified overexpression of CLC-3 on the membrane of glioma cells. Specific blockade of this channel by a scorpion toxin (chlorotoxin) reduced migration and proliferation of glioma cells and has progressed to clinical trials. Even when a single surface antigen does not suffice to identify a specific cell population, antigen combinations can serve as a target with the use, for example, of multispecific antibodies, such as triple bodies (72).
In this study, we provide quantitative evidence about the functional membrane properties of GICs. By performing whole-cell patch clamp recordings, we demonstrate that dissociated glioma spheroids derived from 5 different human GBMs show a common electrophysiologic phenotype. Furthermore, we show that variations in the electrophysiologic profile reflect the maturational status of GICs. Our results strongly suggest that human GICs are neither oligo- nor neuronal precursors but represent a unique type of cells reminiscent of an immature phenotype that most resembles but is not identical to NG2 glia in its marker expression and functional membrane properties.
Supplementary Material
Footnotes
Send correspondence and reprint requests to: Luis A. Pardo, MD, PhD, Max-Planck Institute of Experimental Medicine, Hermann-Rein-Str. 3, 37075 Göttingen, Germany; E-mail: pardo@em.mpg.de
This work was funded by the Max-Planck Society and the Göttingen Graduate School for Neurosciences and Molecular Biosciences (to Alonso Barrantes-Freer).
The authors declare no competing interests.
Supplemental digital content is available for this article. Direct URL citations appear in the printed text and are provided in the HTML and PDF versions of this article on the journal’s Web site (www.jneuropath.com).
REFERENCES
- 1. DeAngelis LM. Brain tumors. N Engl J Med 2001; 344: 114– 23 [DOI] [PubMed] [Google Scholar]
- 2. Stupp R, Mason WP, van den Bent MJ, et al. Radiotherapy plus concomitant and adjuvant temozolomide for glioblastoma. N Engl J Med 2005; 352: 987– 96 [DOI] [PubMed] [Google Scholar]
- 3. Cheng L, Wu Q, Guryanova OA, et al. Elevated invasive potential of glioblastoma stem cells. Biochem Biophys Res Commun 2011; 406: 643– 8 [DOI] [PMC free article] [PubMed] [Google Scholar]
- 4. Facchino S, Abdouh M, Bernier G. Brain cancer stem cells: Current status on glioblastoma multiforme. Cancers (Basel) 2011; 3: 1777– 97 [DOI] [PMC free article] [PubMed] [Google Scholar]
- 5. Huse JT, Holland EC. Targeting brain cancer: Advances in the molecular pathology of malignant glioma and medulloblastoma. Nat Rev Cancer 2010; 10: 319– 31 [DOI] [PubMed] [Google Scholar]
- 6. Bachoo RM, Maher EA, Ligon KL, et al. Epidermal growth factor receptor and Ink4a/Arf: Convergent mechanisms governing terminal differentiation and transformation along the neural stem cell to astrocyte axis. Cancer Cell 2002; 1: 269– 77 [DOI] [PubMed] [Google Scholar]
- 7. Alcantara Llaguno S, Chen J, Kwon C-H, et al. Malignant astrocytomas originate from neural stem/progenitor cells in a somatic tumor suppressor mouse model. Cancer Cell 2009; 15: 45– 56 [DOI] [PMC free article] [PubMed] [Google Scholar]
- 8. Liu C, Sage JC, Miller MR, et al. Mosaic analysis with double markers reveals tumor cell of origin in glioma. Cell 2011; 146: 209– 21 [DOI] [PMC free article] [PubMed] [Google Scholar]
- 9. Persson AI, Petritsch C, Swartling FJ, et al. Non-stem cell origin for oligodendroglioma. Cancer Cell 2010; 18: 669– 82 [DOI] [PMC free article] [PubMed] [Google Scholar]
- 10. Chen J, McKay Renée M, Parada Luis F. Malignant glioma: Lessons from genomics, mouse models, and stem cells. Cell 2012; 149: 36– 47 [DOI] [PMC free article] [PubMed] [Google Scholar]
- 11. Visvader JE. Cells of origin in cancer. Nature 2011; 469: 314– 22 [DOI] [PubMed] [Google Scholar]
- 12. Ehrmann J, Kolář Z, Mokrý J. Nestin as a diagnostic and prognostic marker: Immunohistochemical analysis of its expression in different tumours. J Clin Pathol 2005; 58: 222– 23 [DOI] [PMC free article] [PubMed] [Google Scholar]
- 13. Brat D, Prayson R, Ryken T, et al. Diagnosis of malignant glioma: Role of neuropathology. J Neuro-Oncol 2008; 89: 287– 311 [DOI] [PubMed] [Google Scholar]
- 14. Chekenya M, Rooprai HK, Davies D, et al. The NG2 chondroitin sulfate proteoglycan: Role in malignant progression of human brain tumours. Int J Dev Neurosci 1999; 17: 421– 35 [DOI] [PubMed] [Google Scholar]
- 15. Svendsen A, Verhoeff J, Immervoll H, et al. Expression of the progenitor marker NG2/CSPG4 predicts poor survival and resistance to ionising radiation in glioblastoma. Acta Neuropathol 2011; 122: 495– 510 [DOI] [PMC free article] [PubMed] [Google Scholar]
- 16. Ignatova TN, Kukekov VG, Laywell ED, et al. Human cortical glial tumors contain neural stem-like cells expressing astroglial and neuronal markers in vitro. Glia 2002; 39: 193– 206 [DOI] [PubMed] [Google Scholar]
- 17. Galli R, Binda E, Orfanelli U, et al. Isolation and characterization of tumorigenic, stem-like neural precursors from human glioblastoma. Cancer Res 2004; 64: 7011– 21 [DOI] [PubMed] [Google Scholar]
- 18. Singh SK, Hawkins C, Clarke ID, et al. Identification of human brain tumour initiating cells. Nature 2004; 432: 396– 401 [DOI] [PubMed] [Google Scholar]
- 19. Gursel DB, Shin BJ, Burkhardt JK, et al. Glioblastoma stem-like cells-biology and therapeutic implications. Cancers (Basel) 2011; 3: 2655– 66 [DOI] [PMC free article] [PubMed] [Google Scholar]
- 20. Vescovi AL, Galli R, Reynolds BA. Brain tumor stem cells. Nat Rev Cancer 2006; 6: 425. [DOI] [PubMed] [Google Scholar]
- 21. Clarke MF, Dick JE, Dirks PB, et al. Cancer stem cells—Perspectives on current status and future directions: AACR workshop on cancer stem cells. Cancer Res 2006; 66: 9339– 44 [DOI] [PubMed] [Google Scholar]
- 22. Al-Mayhani MTF, Grenfell R, Narita M, et al. NG2 expression in glioblastoma identifies an actively proliferating population with an aggressive molecular signature. Neuro-Oncol 2011; 13: 830– 45 [DOI] [PMC free article] [PubMed] [Google Scholar]
- 23. Ge W-P, Miyawaki A, Gage FH, et al. Local generation of glia is a major astrocyte source in postnatal cortex. Nature 2012; 484: 376– 80 [DOI] [PMC free article] [PubMed] [Google Scholar]
- 24. Tripathi RB, Clarke LE, Burzomato V, et al. Dorsally and ventrally derived oligodendrocytes have similar electrical properties but myelinate preferred tracts. J Neurosci 2011; 31: 6809– 19 [DOI] [PMC free article] [PubMed] [Google Scholar]
- 25. Lin S-C, Bergles DE. Physiological characteristics of NG2-expressing glial cells. J Neurocytol 2002; 31: 537– 49 [DOI] [PubMed] [Google Scholar]
- 26. Wang DD, Krueger DD, Bordey A. Biophysical properties and ionic signature of neuronal progenitors of the postnatal subventricular zone in situ. J Neurophysiol 2003; 90: 2291– 302 [DOI] [PubMed] [Google Scholar]
- 27. Schaarschmidt G, Wegner F, Schwarz SC, et al. Characterization of voltage-gated potassium channels in human neural progenitor cells. PLoS ONE 2009; 4: e6168. [DOI] [PMC free article] [PubMed] [Google Scholar]
- 28. Ge W-P, Zhou W, Luo Q, et al. Dividing glial cells maintain differentiated properties including complex morphology and functional synapses. Proc Natl Acad Sci USA 2009; 106: 328– 33 [DOI] [PMC free article] [PubMed] [Google Scholar]
- 29. Hamill OP, Marty A, Neher E, et al. Improved patch-clamp techniques for high-resolution current recording from cells and cell-free membrane patches. Pfluegers Arch 1981; 391: 85– 100 [DOI] [PubMed] [Google Scholar]
- 30. Bordey A, Sontheimer H. Electrophysiological properties of human astrocytic tumor cells in situ: Enigma of spiking glial cells. J Neurophysiol 1998; 79: 2782– 93 [DOI] [PubMed] [Google Scholar]
- 31. Liu X, Chang Y, Reinhart PH, et al. Cloning and characterization of glioma BK, a novel BK channel isoform highly expressed in human glioma cells. J Neurosci 2002; 22: 1840– 49 [DOI] [PMC free article] [PubMed] [Google Scholar]
- 32. Ransom CB, Liu X, Sontheimer H. Current transients associated with BK channels in human glioma cells. J Membr Biol 2003; 193: 201– 13 [DOI] [PubMed] [Google Scholar]
- 33. Ransom CB, Liu XJ, Sontheimer H. BK channels in human glioma cells have enhanced calcium sensitivity. Glia 2002; 38: 281– 91 [DOI] [PubMed] [Google Scholar]
- 34. Ransom CB, Sontheimer H. BK channels in human glioma cells. J Neurophysiol 2001; 85: 790– 803 [DOI] [PubMed] [Google Scholar]
- 35. Olsen ML, Sontheimer H. Mislocalization of Kir channels in malignant glia. Glia 2004; 46: 63– 73 [DOI] [PMC free article] [PubMed] [Google Scholar]
- 36. Olsen ML, Sontheimer H. Functional implications for Kir4.1 channels in glial biology: From K+ buffering to cell differentiation. J Neurochem 2008; 107: 589– 601 [DOI] [PMC free article] [PubMed] [Google Scholar]
- 37. Olsen ML, Schade S, Lyons SA, et al. Expression of voltage-gated chloride channels in human glioma cells. J Neurosci 2003; 23: 5572– 82 [DOI] [PMC free article] [PubMed] [Google Scholar]
- 38. Ishiuchi S, Tsuzuki K, Yoshida Y, et al. Blockage of Ca(2+)-permeable AMPA receptors suppresses migration and induces apoptosis in human glioblastoma cells. Nat Med 2002; 8: 971– 78 [DOI] [PubMed] [Google Scholar]
- 39. Ding X, He Z, Zhou K, et al. Essential role of TRPC6 channels in G2/M phase transition and development of human glioma. J Natl Cancer Inst 2010; 102: 1052– 68 [DOI] [PubMed] [Google Scholar]
- 40. Joshi A, Parsons D, Velculescu V, et al. Sodium ion channel mutations in glioblastoma patients correlate with shorter survival. Molecular Cancer 2011; 10: 17. [DOI] [PMC free article] [PubMed] [Google Scholar]
- 41. Louis DN, Ohgaki H, Wiestler OD, et al. WHO Classification of Tumours of the Central Nervous System. 4th ed. Lyon, France: World Health Organization, 2007 [Google Scholar]
- 42. Gómez-Varela D, Kohl T, Schmidt M, et al. Characterization of Eag1 channel lateral mobility in rat hippocampal cultures by single-particle-tracking with quantum dots. PLoS ONE 2010; 5: e8858. [DOI] [PMC free article] [PubMed] [Google Scholar]
- 43. Pfaffl MW, Horgan GW, Dempfle L. Relative expression software tool (REST) for group-wise comparison and statistical analysis of relative expression results in real-time PCR. Nucleic Acids Res 2002; 30: e36. [DOI] [PMC free article] [PubMed] [Google Scholar]
- 44. Pfaffl MW. A new mathematical model for relative quantification in real-time RT–PCR. Nucleic Acids Res 2001; 29: e45. [DOI] [PMC free article] [PubMed] [Google Scholar]
- 45. Fitzner D, Schneider A, Kippert A, et al. Myelin basic protein-dependent plasma membrane reorganization in the formation of myelin. EMBO J 2006; 25: 5037– 48 [DOI] [PMC free article] [PubMed] [Google Scholar]
- 46. Burg MA, Grako KA, Stallcup WB. Expression of the NG2 proteoglycan enhances the growth and metastatic properties of melanoma cells. J Cell Physiol 1998; 177: 299– 312 [DOI] [PubMed] [Google Scholar]
- 47. Nishiyama A, Lin XH, Giese N, et al. Colocalization of NG2 proteoglycan and PDGF α-receptor on O2A progenitor cells in the developing rat brain. J Neurosci Res 1996; 43: 299– 314 [DOI] [PubMed] [Google Scholar]
- 48. Mayer M, Bhakoo K, Noble M. Ciliary neurotrophic factor and leukemia inhibitory factor promote the generation, maturation and survival of oligodendrocytes in vitro. Development 1994; 120: 143– 53 [DOI] [PubMed] [Google Scholar]
- 49. Lutz SE, Zhao Y, Gulinello M, et al. Deletion of Astrocyte Connexins 43 and 30 Leads to a Dysmyelinating Phenotype and Hippocampal CA1 Vacuolation. J Neurosci 2009; 29: 7743– 52 [DOI] [PMC free article] [PubMed] [Google Scholar]
- 50. Bergles DE, Roberts JDB, Somogyi P, et al. Glutamatergic synapses on oligodendrocyte precursor cells in the hippocampus. Nature 2000; 405: 187– 91 [DOI] [PubMed] [Google Scholar]
- 51. Schools GP, Zhou M, Kimelberg HK. Development of gap junctions in hippocampal astrocytes: Evidence that whole cell electrophysiological phenotype is an Intrinsic property of the individual cell. J Neurophysiol 2006; 96: 1383– 92 [DOI] [PubMed] [Google Scholar]
- 52. Mueller J, Reyes-Haro D, Pivneva T, et al. The principal neurons of the medial nucleus of the trapezoid body and NG2+ glial cells receive coordinated excitatory synaptic input. J Gen Physiol 2009; 134: 115– 27 [DOI] [PMC free article] [PubMed] [Google Scholar]
- 53. Káradóttir R, Hamilton NB, Bakiri Y, et al. Spiking and nonspiking classes of oligodendrocyte precursor glia in CNS white matter. Nat Neurosci 2008; 11: 450– 56 [DOI] [PMC free article] [PubMed] [Google Scholar]
- 54. Schmidt K, Eulitz D, Veh RdW, et al. Heterogeneous expression of voltage-gated potassium channels of the shaker family (Kv1) in oligodendrocyte progenitors. Brain Res 1999; 843: 145– 60 [DOI] [PubMed] [Google Scholar]
- 55. Paukert M, Bergles DE. Synaptic communication between neurons and NG2+ cells. Curr Opin Neurobiol 2006; 16: 515– 21 [DOI] [PubMed] [Google Scholar]
- 56. McDougal DH, Hermann GE, Rogers RC. Vagal afferent stimulation activates astrocytes in the nucleus of the solitary tract via AMPA receptors: Evidence of an atypical neural-glial interaction in the brainstem. J Neurosci 2011; 31: 14037– 45 [DOI] [PMC free article] [PubMed] [Google Scholar]
- 57. de Groot J, Sontheimer H. Glutamate and the biology of gliomas. Glia 2011; 59: 1181– 89 [DOI] [PMC free article] [PubMed] [Google Scholar]
- 58. Fucile S, Miledi R, Eusebi F. Effects of cyclothiazide on GluR1/AMPA receptors. Proc Natl Acad Sci USA 2006; 103: 2943– 47 [DOI] [PMC free article] [PubMed] [Google Scholar]
- 59. Belachew S, Chittajallu R, Aguirre AA, et al. Postnatal NG2 proteoglycan-expressing progenitor cells are intrinsically multipotent and generate functional neurons. J Cell Biol 2003; 161: 169– 86 [DOI] [PMC free article] [PubMed] [Google Scholar]
- 60. Komitova M, Zhu X, Serwanski DR, et al. NG2 cells are distinct from neurogenic cells in the postnatal mouse subventricular zone. J Comp Neurol 2009; 512: 702– 16 [DOI] [PMC free article] [PubMed] [Google Scholar]
- 61. Stallcup WB, Beasley L. Bipotential glial precursor cells of the optic nerve express the NG2 proteoglycan. J Neurosci 1987; 7: 2737– 44 [DOI] [PMC free article] [PubMed] [Google Scholar]
- 62. Ransom CB, Sontheimer H. Biophysical and pharmacological characterization of inwardly rectifying K+ currents in rat spinal cord astrocytes. J Neurophysiol 1995; 73: 333– 46 [DOI] [PubMed] [Google Scholar]
- 63. Abdul M, Hoosein N. Expression and activity of potassium ion channels in human prostate cancer. Cancer letters 2002; 186: 99– 105 [DOI] [PubMed] [Google Scholar]
- 64. Lai B, Mao XO, Xie L, et al. Electrophysiological properties of subventricular zone cells in adult mouse brain. Brain Res 2010; 1340: 96– 105 [DOI] [PMC free article] [PubMed] [Google Scholar]
- 65. Claydon T, Kwan D, Fedida D, et al. Block by internal Mg2+ causes voltage-dependent inactivation of Kv1.5. Eur Biophys J 2006; 36: 23– 34 [DOI] [PubMed] [Google Scholar]
- 66. Kukley M, Nishiyama A, Dietrich D. The fate of synaptic input to NG2 glial cells: Neurons specifically downregulate transmitter release onto differentiating oligodendroglial cells. J Neurosci 2010; 30: 8320– 31 [DOI] [PMC free article] [PubMed] [Google Scholar]
- 67. Biagiotti T, D’amico M, Marzi I, et al. Cell Renewing in Neuroblastoma: Electrophysiological and Immunocytochemical Characterization of Stem Cells and Derivatives. Stem Cells 2006; 24: 443– 53 [DOI] [PubMed] [Google Scholar]
- 68. Sontheimer H. Astrocytes, as well as neurons, express a diversity of ion channels. Can J Physiol Pharmacol 1992; 70 Suppl: S223– 38 [DOI] [PubMed] [Google Scholar]
- 69. Chittajallu R, Aguirre A, Gallo V. NG2-positive cells in the mouse white and grey matter display distinct physiological properties. J Physiol 2004; 561: 109– 22 [DOI] [PMC free article] [PubMed] [Google Scholar]
- 70. Akopian G, Kressin K, Derouiche A, et al. Identified glial cells in the early postnatal mouse hippocampus display different types of Ca2+ currents. Glia 1996; 17: 181– 94 [DOI] [PubMed] [Google Scholar]
- 71. Sontheimer H. An unexpected role for ion channels in brain tumor metastasis. Exp Biol Med 2008; 233: 779– 91 [DOI] [PMC free article] [PubMed] [Google Scholar]
- 72. Schubert I, Kellner C, Stein C, et al. A single-chain triplebody with specificity for CD19 and CD33 mediates effective lysis of mixed lineage leukemia cells by dual targeting. MAbs 2011; 3: 21– 30 [DOI] [PMC free article] [PubMed] [Google Scholar]
Associated Data
This section collects any data citations, data availability statements, or supplementary materials included in this article.