

Abstract
Sandwich-cultured hepatocytes (SCH) are used commonly to investigate hepatic transport protein-mediated uptake and biliary excretion of substrates. However, little is known about the disposition of endogenous bile acids (BAs) in SCH. In this study, four endogenous conjugated BAs common to rats and humans [taurocholic acid (TCA), glycocholic acid (GCA), taurochenodeoxycholic acid (TCDCA), and glycochenodeoxycholic acid (GCDCA)], as well as two BA species specific to rodents (α- and β-tauromuricholic acid; α/β TMCA), were profiled in primary rat and human SCH. Using B-CLEAR® technology, BAs were measured in cells+bile canaliculi, cells, and medium of SCH by LC-MS/MS. Results indicated that, just as in vivo, taurine-conjugated BA species were predominant in rat SCH, while glycine-conjugated BAs were predominant in human SCH. Total intracellular BAs remained relatively constant over days in culture in rat SCH. Total BAs in control (CTL) cells+bile, cells, and medium were approximately 3.4, 2.9, and 8.3-fold greater in human than in rat. The estimated intracellular concentrations of the measured total BAs were 64.3 ± 5.85 μM in CTL rat and 183 ± 55.6 μM in CTL human SCH, while medium concentrations of the total BAs measured were 1.16 ± 0.210 μM in CTL rat SCH and 9.61 ± 6.36 μM in CTL human SCH. Treatment of cells for 24 h with 10 μM troglitazone (TRO), an inhibitor of the bile salt export pump (BSEP) and the Na+-taurocholate cotransporting polypeptide (NTCP), had no significant effect on endogenous BAs measured at the end of the 24-h culture period, potentially due to compensatory mechanisms that maintain BA homeostasis. These data demonstrate that BAs in SCH are similar to in vivo, and that SCH may be a useful in vitro model to study alterations in BA disposition if species differences are taken into account.
Keywords: sandwich-cultured hepatocytes, troglitazone, bile acids, hepatotoxicity
Introduction
Sandwich-cultured hepatocytes (SCH)—primary hepatocytes cultured in a sandwich configuration between layers of collagen or extracellular matrix—are commonly employed as an in vitro model to examine the hepatic disposition and metabolism of compounds and to determine mechanisms of hepatotoxicity. When cultured in conventional monolayer, cells dedifferentiate over time and rapidly lose hepatocyte-specific functions (Dunn et al. 1991). However, when cultured in a sandwich configuration, hepatocytes continue to synthesize and secrete hepatocyte-specific compounds such as albumin, urea, transferrin and fibrinogen; meanwhile, the synthesis and efflux of BAs into the culture medium in SCH remain relatively steady for up to 42 days in culture (Shibukawa et al. 1995). SCH begin to repolarize hours after plating, cytochrome P450 (CYP450) enzymes are expressed, transport proteins traffic to their proper membrane domains and are functional over days in culture, and over time adjacent cells form intact, bile-canaliculi-like structures sealed by tight junctions into which endogenous and exogenous compounds may be secreted (LeCluyse et al. 1994; Liu et al. 1999a; Liu et al. 1999b; Liu et al. 1999c). B-CLEAR® technology allows quantification of intracellular accumulation and bile canalicular excretion of endogenous and exogenous compounds by modulating the integrity of these tight junctions through the presence or absence of Ca2+ and Mg2+.
Recent research suggests that interference with normal BA transport may be an important mechanism of drug- and xenobiotic-induced hepatotoxicity (Pauli-Magnus and Meier 2006) through the inhibition of BA transport proteins or the retrieval of transporters from the hepatocyte plasma membrane (Zollner and Trauner 2008). The vectorial, active hepatic uptake and efflux of BAs are mediated by a number of transport proteins that are expressed on the basolateral (sinusoidal) or apical (canalicular) membrane domains. On the basolateral membrane, Na+-taurocholate cotransporting polypeptide (NTCP/Ntcp) is primarily responsible for the Na+-dependent uptake of conjugated BAs from the blood, while isoforms of organic anion transporting polypeptide (OATP/Oatp) take up conjugated and unconjugated BAs and other organic anions; OATP/Oatp isoforms also may function as bi-directional transporters (Trauner and Boyer 2003). On the apical membrane, BSEP and multidrug resistance-associated protein 2 (MRP2/Mrp2) efflux monovalent and divalent BAs, respectively, into the bile canaliculi (Keppler et al. 1999; Keppler and Konig 2000). Inhibition of transport proteins may mediate liver injury by increasing the intracellular accumulation of potentially toxic compounds (parent drug/xenobiotic and/or metabolites), as well as endogenous BAs, which can cause toxicity through detergent effects on cellular membranes, mitochondrial dysfunction, and ultimately cellular apoptosis or necrosis (Delzenne et al. 1992; Desmet 1995; Gores et al. 1998; Pauli-Magnus et al. 2005).
A number of drugs inhibit rat and/or human Bsep/BSEP-mediated biliary secretion of TCA in vitro including cyclosporin A, glibenclamide, rifampin, bosentan, ritonavir, saquinavir, efavirenz, and troglitazone (TRO) (Fattinger et al. 2001; Funk et al. 2001a; Kemp et al. 2005; McRae et al. 2006; Pauli-Magnus and Meier 2006; Stieger et al. 2000). TRO, the first thiazolidinedione drug introduced to treat type II diabetes, was removed from the market because of hepatotoxicity, but preclinical safety testing did not predict toxicity in humans. Studies have demonstrated that TRO, and particularly its major metabolite, troglitazone sulfate (TS), inhibit BA transport (Funk et al. 2001a; Funk et al. 2001b; Kemp et al. 2005; Preininger et al. 1999). TRO-induced hepatotoxicity observed in humans may not have been observed in rats during preclinical testing due to species differences in the composition of the BA pools, and differential effects on the hepatobiliary transport of BAs.
Drug-induced changes in the intra- and/or extracellular disposition of individual BAs may be indicators of the hepatotoxic potential of a compound. The goals of this study were to profile endogenous BAs in primary rat and human SCH in order to compare species differences between rat and human in the disposition of BAs common to both, to determine whether inhibition of BA transport proteins mediated by TRO treatment causes the intracellular accumulation of endogenous BAs, and to elucidate whether distinct changes in intra- and extracellular accumulation and biliary excretion of individual BA species occur such that a particular BA would be a marker for transport inhibition. In order to accomplish these goals, the mass of TCA, GCA, TCDCA, and GCDCA accumulated in cells+bile canaliculi, cells, and medium of SCH were quantified by LC-MS/MS following 24 h treatment with vehicle or 10 μM TRO. The accumulation of α/β TMCA was also included in rat SCH. Furthermore, intracellular and biliary concentrations of BAs were calculated using estimated cell volumes for human and rat hepatocytes.
Materials and Methods
Chemicals
TRO was purchased from Biomol (Plymouth Meeting, PA). Dexamethasone, Hanks’ balanced salt solution (HBSS) premix, and HBSS modified (without calcium chloride, magnesium sulfate, phenol red, and sodium bicarbonate) premix were purchased from Sigma-Aldrich (St. Louis, MO). Collagenase (type I, class I) was obtained from Worthington Biochemical (Freehold, NJ). Dimethyl sulfoxide (DMSO) was purchased from Fisher Scientific (Fairlawn, NJ). GIBCO brand Fetal bovine serum, insulin, and Dulbecco’s modified Eagle medium (DMEM) were obtained from Invitrogen (Carlsbad, CA). ITS™+ Premix (insulin, transferrin, selenium) and BD Matrigel™ Basement Membrane Matrix were purchased from BD Biosciences (Palo Alto, CA). The d8 TCA was purchased from Martrex, Inc. (Minnetonka, MN), d4 TCA was purchased from Toronto Research Chemicals, Inc. (Toronto, Ontario, Canada), and all other deuterated BAs were purchased from CDN Isotopes, Inc. (Pointe-Claire, Quebec, Canada). The bile acids α- and β-TMCA were purchased from Steraloids, Inc. (Newport, RI). All other chemicals and reagents were of analytical grade and were readily available from commercial sources.
Hepatocyte isolation and culture
Hepatocytes were isolated from male Wistar rats (250-300 g; Charles River Laboratories, Inc., Raleigh, NC) using a two-step collagenase perfusion method previously described (Liu et al., 1998; Annaert et al., 2001). Rats were maintained on a 12-hr light/dark cycle with free access to water and standard rodent chow, and were allowed to acclimate for at least 5 days before experimentation. The Institutional Animal Care and Use Committee of the University of North Carolina at Chapel Hill approved all procedures. Human hepatocytes were obtained from CellzDirect (Durham, NC) pre-plated on 6-well BioCoat plates with collagen type I substratum (BD Biosciences, Bedford, MA). Donor information is listed in Table 1.
Table 1.
Demographic data for human liver donors.
| Donor | HU0803 | HU1067 | HU1184 | HU1191 |
|---|---|---|---|---|
| Age | 42 | 61 | 73 | 19 |
| Sex | male | male | female | male |
| Race | Caucasian | Caucasian | Caucasian | Caucasian |
| Height (in) | 72 | 76 | 66 | 74 |
| Weight (lb) | 240 | 215 | 150 | 152 |
| BMI (%) | 32.6 | 26.2 | 24.2 | 19.5 |
| Smoker | no | no | no | no |
| Alcohol Use | rare | no | rare | no |
| Serology | not known | not tested | Hep B and Hep C: non- reactive |
Hep B and Hep C: non- reactive |
| HIV: not tested | HIV: not tested | |||
| Medications | not known | Zantac 300 mg QD | Hydrochlorithiazide 12.5 mg QD |
none |
| Prilosec 20 mg BID | Flagyl | |||
| Allegra 180 mg QD | ||||
| Diltiazem CD 180 mg QD | ||||
| Iron | ||||
| Multivitamin | ||||
| Vitamin D |
Rat hepatocytes were seeded at a density of 1.75 × 10⁶ cells per well on 6-well BioCoat™ plates in 1.5 ml DMEM supplemented with 5% (v/v) fetal bovine serum, 10 μM insulin, and 1 μM dexamethasone, 2 mM L-glutamine, 1% (v/v) MEM non-essential amino acids, 100 units penicillin G sodium and 100 μg streptomycin sulfate. Cells were incubated at 37°C, 5% CO2 in a humidified incubator and allowed to attach for 2 h, after which time the medium was aspirated to remove unattached cells, and replaced with fresh medium. Twenty-four hours later, on day 1 of culture, rat and human hepatocytes were overlaid with BD Matrigel™ basement membrane matrix at a concentration of 0.25 mg/mL in ice-cold DMEM supplemented with 1% (v/v) ITS™+ Premix, 0.1 μM dexamethasone, 2 mM L-glutamine, 1% (v/v) MEM non-essential amino acids, 100 units penicillin G sodium and 100 μg streptomycin sulfate. Rat and human hepatocytes were cultured for up to 3 and 6 more days, respectively, to allow for the formation of canalicular networks between cells. Culture medium was replaced daily.
Determination of BAs in cells+bile and cells of untreated rat SCH over days in culture
At 24, 48, 72, and 96 h post-seeding, 1 ml aliquots of culture medium were collected from each of 6 wells of rat SCH and stored at <−70°C until analysis. The remaining 0.5 ml of the culture medium was aspirated and duplicate wells were rinsed briefly with 1.5 ml/well of warmed HBSS containing Ca2+ (cells+bile), while two wells were rinsed with HBSS without Ca2+ (cells only), and the wash buffer was aspirated. Following the wash, 1.5 ml of HBSS with or without Ca2+ was added again to wells, and cells were incubated for 4 min at 37°C. Incubation of SCH with Ca2+-containing buffer maintained the tight junctions between cells so that the bile canalicular structures formed between cells remained intact. Incubation of cells in Ca2+-free buffer disrupted the tight junctions and opened the bile canalicular structures between cells, allowing the contents to be washed away. Following incubation, the HBSS was aspirated from each well and plates were sealed and stored at <−70°C until analysis.
Determination of cholesterol 7-alpha-hydroxylase (Cyp7a1) protein expression in cells of untreated rat SCH over days in culture
At 24, 48, 72, and 96 h post-seeding, culture medium was aspirated from duplicate wells and cell lysates were collected in 400 μl lysis buffer containing 1% sodium dodecyl sulfate (SDS), 1 mM ethylenediaminetetraacetic acid (EDTA), and protease inhibitors (Halt™ Protease Inhibitor Cocktail, Thermo Scientific, Rockford, IL). Protein concentrations were determined using the Pierce BCA™ (bicinchoninic acid) Protein Assay Kit (Thermo Scientific, Rockford, IL). Whole-cell lysates (45 μg) were resolved on a Nu-PAGE® 10% Bis-Tris Mini gel (Life Technologies™, Carlsbad, CA) and proteins were transferred to an Immobilon™ polyvinylidene fluoride (PVDF) membrane (Millipore, Bedford, MA). The membrane was blocked in 5% milk in Tris-buffered saline with Tween-20 (TBS-T) for two hours at room temperature (RT). Membranes were incubated for two hours at RT with Cyp7a1 antibody (Abgent, San Diego, CA) and β–actin (C4, Chemicon, San Francisco, CA). Following incubation with HRP-tagged secondary antibodies, chemiluminescence was detected using SuperSignal® West Dura Extended Duration Substrate (Thermo Scientific, Rockford, IL) and a Bio-Rad Chemidoc XRS imaging system. Densitometry analysis was performed using QuantityOne v.4.5.2 software (Bio-Rad Laboratories, Hercules, CA).
Accumulation of BAs in cells+bile, cells, and culture medium of rat and human SCH
On day 3 (rat) or 6 (human) of culture, medium was aspirated from each well of SCH and replaced with 1.5 ml medium containing vehicle (0.1% DMSO) or 10 μM TRO. Cells were incubated at 37°C for an additional 24 h. Following incubation, 1 ml aliquots of the culture medium were collected for analysis of BAs in the medium, and the remaining 0.5 ml was aspirated. Triplicate wells were briefly rinsed 2 times with 2 ml per well of warmed HBSS with or without Ca2+. After the washes, 2 ml of HBSS with or without Ca2+ was added, and cells were incubated at 37°C for 4 min. Following the 4-min incubation, the HBSS was aspirated, and plates were stored at <−70°C until analysis. Human and rat SCH were handled identically except that human SCH were treated on day 6 of culture, and samples were collected 24 h later on day 7.
Sample preparation for LC-MS/MS analysis of BAs in cell lysates
Calibration standards and quality controls (QCs) utilized in the quantification of unknown samples were prepared in a biological matrix containing endogenous BAs. Deuterated BA equivalents were utilized in the preparation of these calibration standards and QCs to avoid any variable background contribution from these endogenous compounds. Quantification of all BAs utilized an internal standard method wherein deuterated TCA (d4-TCA) was added during sample preparation to all standards, QCs, and unknown samples for all BAs. The specific stable isotope d8-TCA was utilized to prepare the calibration standards and QCs supporting the measurement of both TCA and α/β TMCA in the unknown samples. Ten microliters of deuterated BAs [d8-taurocholic acid (d8-TCA), d4-glycocholic acid (d4-GCA), d4-taurochenodeoxycholic acid (d4-TCDCA), and d4-glycochenodeoxycholic acid (d4-GCDCA)] solutions in methanol were added to previously frozen, untreated rat and human SCH plates. The final concentration range for rat cell lysate analysis was 0.5 - 100 pmol/well, and for human cell lysate analysis was 0.5 – 50 pmol/well for taurine conjugates and 10 – 1000 pmol/well for glycine conjugates. Lysis solution (750 μl; 70:30 methanol:water [v/v] containing 25 nM d4-TCA as an internal standard) were added to each well of study plates and to plates containing standards. Plates were shaken on a rotating plate shaker (Lab-Line Instruments Model 4625) at a speed of 500 rpm for 15 min. The total contact time of the lysis solution with cells, prior to filtration, was ~20–30 min. The cell lysates were transferred to a Whatman 96-well Unifilter Plate (Whatman, Florham Park, NJ) with 25 μm melt blown polypropylene over 0.45 μm polypropylene membrane. Lysate was filtered into a Greiner 96-well Deepwell Plate by centrifugation at 2000 rcf for 5 min. Filtrate was evaporated to dryness under nitrogen gas and then reconstituted in 200 μl of sample diluent (60:40 methanol:10 mM ammonium acetate [native pH]) and mixed for 15 min on the plate shaker at 500 rpm. Reconstituted samples were transferred to a Whatman 96-well Unifilter Plate with 0.45 μm polyvinylidene fluoride (PVDF) membrane and collected into a Costar 3956 96-well plate (Corning, Corning NY) by centrifugation at 2000 rcf for 5 min. The 96-well plate was sealed with a silicone capmat prior to LC-MS/MS analysis. Liquid handling during these procedures was accomplished using a Hamilton Microlab® STAR 12-pipetting channel liquid handling workstation and Tomtec Quadra 96® 320 96-well simultaneous pipetting workstation.
Sample preparation for LC-MS/MS analysis of BAs in culture medium
A volume of 300 μl of 100% methanol containing 25 nM d4-TCA as an internal standard was added to a well within a Millipore 96-well MultiScreen Deep Well Solvinert filter plate. This was followed by the addition of 100 μl of medium study sample and mixing on the plate shaker at a speed of 500 rpm for 15 min. Following protein precipitation, the filter plate was stacked on a deep well plate and centrifuged at 2000 × rcf for 5 minutes. Filtrate was evaporated to dryness under nitrogen gas and reconstituted in 200 μl of sample diluent (60:40 [v/v] methanol:10 mM ammonium acetate [native pH]) and mixed for 15 min on the plate shaker at 500 rpm. Reconstituted samples were transferred to a Whatman 96-well Unifilter Plate with 0.45 μm PVDF membrane and collected into a Costar 3956 96-well plate (Corning, Corning NY) by centrifugation at 2000 × rcf for 5 min. The 96-well plate was sealed with a silicone capmat prior to LC-MS/MS analysis. Liquid handling during these procedures was accomplished using a Hamilton Microlab® STAR 12-pipetting channel liquid handling workstation and Tomtec Quadra 96® 320 96-well simultaneous pipetting workstation.
Endogenous BAs were measured using standard curves prepared with stable isotope equivalents. Ten microliters of deuterated BAs (d8-TCA, d4-GCA, d4-TCDCA, d4-GCDCA) solutions in methanol were added to 300 μl of 100% methanol containing 25 nM internal standard within a Millipore 96-well filter plate. The final concentration range for rat culture medium analysis was 0.5 - 50 pmol/100 μl for each deuterated BA, and for human culture analysis was 0.5 – 50 pmol/100 μl for d8-TCA, d4-TCDCA, and d4-GCDCA, and 100 – 5000 pmol/100 μl for d4-GCA. This was followed by the addition of 90 μl cell culture medium and then mixing on the plate shaker for 15 min. Further processing of medium standard was completed as described for medium study samples described above.
LC-MS/MS analysis
Chromatographic separation of a 10 μl sample injection volume was accomplished using a Shimadzu binary high-performance liquid chromatography system (Columbia, MD) incorporating LC-10ADvp pumps, a CTO-10Avp oven, a Shimadzu HTc 96-well autosampler, and a Thermo Scientific Hypersil GOLD C18 column (100 × 1.0 mm, 3 μm) with matching guard and pre-column filter. The mobile phase was initially 70% [60% 0.5 mM ammonium acetate (native pH):40% methanol]:30% [20% 0.5 mM ammonium acetate (native pH):80% methanol]. From 2-15 min, the gradient was ramped to 100% [20% 0.5 mM ammonium acetate (native pH):80% methanol], then stepped back to initial conditions over 1 min. The flow rate through the column was 50 μl/min, and the column was maintained at 35°C. The autosampler was maintained at 4°C and rinsed with 1500 μl of 50:50 (v/v) methanol:water after aspiration. Methanol (10 μl/min) was added as a post-column solvent to the MS. A Thermo Electron TSQ Quantum Discovery MAX (Thermo Fisher Scientific) with an Ion Max ESI source in negative ion electrospray ionization mode was used for tandem mass spectrometry. The scan type was selected reaction monitoring (SRM). The transitions monitored at unit resolution are listed in Table 2. Results for unknowns were calculated using a standard curve based on internal standard processing. To assess assay variability, standards were measured at the beginning of each run and QCs were measured at the middle and end of each run. In order to be considered an acceptable analysis, values for standards and QCs typically back-calculated to within 20% of theoretical values.
Table 2.
Transitions monitored at unit resolution for LC-MS/MS analysis.
| Analyte | Molecular Weight |
Retention Time (min) |
Precursor m/z |
Product m/z |
|---|---|---|---|---|
| TCA | 515.7 | 7.5 | 514 | 124 |
| d8-TCA | 523.7 | 7.5 | 522 | 128 |
| d4-TCA (IS) | 519.7 | 7.5 | 518 | 124 |
| TCDCA | 499.7 | 10 | 498 | 80 |
| d4-TCDCA | 503.7 | 10 | 502 | 80 |
| GCA | 465.6 | 7.5 | 464 | 74 |
| d4-GCA | 469.6 | 7.5 | 468 | 74 |
| GCDCA | 449.6 | 10 | 448 | 74 |
| d4-GCDCA | 453.6 | 10 | 452 | 74 |
| α/β TMCA | 515.7 | 4.0 | 514 | 124 |
Both α- and β-TMCA have the same MS precursor and product negative ions as TCA, thus the MS data for these taurine conjugates of MCA were collected in the same analytical run as TCA. Because of the chromatographic separation utilized in this study, TCA was well resolved from α- and β-TMCA, however, the stereoisomers α- and β-TMCA were not separated from each other and were measured collectively (designated α/β TMCA). Because of the equal molar MS response of α/β TMCA relative to TCA, and the high linear dynamic range of the d8-TCA standard curve supporting measurement of TCA, α/β TMCA was measured in both lysate and medium data sets utilizing an extrapolated version of the same standard curve utilized for TCA measurement for unknown samples. Study samples could not be analyzed for glycine conjugates of α- and β-MCA because analytical standards were not available for these compounds.
Data Analysis
The amount of individual BAs per medium sample was measured in pmol/ml (nM) and lysate samples were measured in pmol/well and scaled per mg protein using a representative mean value of 0.9 mg protein per well of a six-well plate as measured using the Pierce BCA™ Protein Assay Kit (Thermo Scientific, Rockford, IL); samples below the limit of quantitation were assigned a proxy value of zero. Estimates for individual and total BA concentrations were calculated based on the amount of the BA species measured in lysates from cells+bile and cells, and estimates of hepatocyte intracellular volume and the number of cells/well (6.83 μl cells/well for rat SCH, 6.79 μl cells/well for human) (Lee and Brouwer 2010). Concentrations of BAs in the culture medium were calculated using a volume of 1.5 ml/well. The biliary excretion index (BEI), which represents the percentage of accumulated substrate that is excreted into bile canaliculi, was calculated using B-CLEAR® technology (Qualyst, Inc., Durham, NC) using the following equation: BEI = [(Accumulationstandard buffer – Accumulationcalcium-free buffer)/Accumulation standard buffer] * 100% (Liu et al. 1999). Statistical analysis (two-way ANOVA with Bonferroni’s multiple comparison test) was performed using GraphPad Prism 5.03. In all cases, a p value < 0.05 was required in order to be considered statistically significant.
Results
Determination of BAs in cells+bile and cells of untreated rat SCH over days in culture
Total BAs (sum of TCA, GCA, TCDCA, GCDCA, and α/β TMCA) were measured in cells+bile and cells in rat SCH over days 1 to 4 of culture (Figure 1A). BAs in cells+bile and in cells remained relatively constant over days 1 to 4; these data suggest that BAs do not accumulate in the cells over days in culture. Unlike cells+bile and cells, both individual and total BAs in the culture medium increased over days in culture (data not shown). Immunoblot analysis indicated that Cyp7a1 protein expression was unchanged over days in culture; expression on days 2, 3, and 4 was 96%, 90%, and 96%, respectively, of the expression on day 1 (Figure 1B).
Figure 1A.

Accumulation (pmol/mg protein) of total BAs (TCA, GCA, TCGCA, GCDCA, α/β TMCA) in cells+bile (solid bars) and cells (open bars) in rat SCH over days 1 through 4 of culture. Values represent mean ± range of duplicate determinations in n=2 experiments.
Figure 1B.

Protein expression of Cyp7a1 in CTL rat SCH cell lysates over days 1 through 4 of culture; β-actin served as the loading control. Same-day samples represent individual samples collected from duplicate wells.
Accumulation of BAs in cells+bile, cells, and medium of rat and human SCH
Experiments were designed to compare the BA pools between rat and human SCH. Figures 2 – 5 show the accumulation of TCA, GCA, TCDCA, and GCDCA, respectively, in cells+bile, cells, and medium of rat and human SCH following 24 h treatment with vehicle starting day 3 to and ending day 4. In addition, accumulation of α/β TMCA in rat SCH is shown in Figure 6. Accumulation of TCA in cells+bile, cells, and medium in rat SCH was about 3.2-fold, 1.8-fold, and 18.0-fold higher, respectively, than in human SCH (Figure 2). In contrast, accumulation of GCA in cells+bile, cells, and medium in human SCH was several orders of magnitude greater in human than in rat (Figure 3). The trends observed with TCA and GCA also were observed with TCDCA and GCDCA. Accumulation of TCDCA in cells+bile, cells, and medium in rat SCH was about 2.7-fold, 2.3-fold, and 14.6-fold higher, respectively, than in human SCH (Figure 4). GCDCA was the most abundant BA in human SCH; accumulation of GCDCA in cells+bile, cells, and medium in human SCH was 584-fold, 766-fold, and 102-fold higher, respectively, than in rat SCH (Figure 5). Accumulation of α/β TMCA in rat SCH was extensive, comprising the majority of the BAs measured in cells+bile, cells, and medium (Figure 6). Treatment with TRO for 24 h had no statistically significant effect on intracellular accumulation of any of the BAs.
Figure 2.

Accumulation in pmol/mg protein (cells+bile and cells) and nM (medium) of TCA in cells+bile (solid bars), cells (open bars), and medium (hatched bars) in rat and human SCH following 24 h treatment with vehicle (0.1% DMSO). In CTL rat SCH, values represent the mean ± SD of duplicate or triplicate measurements (cells+bile and cells) in n=4 experiments, and mean ± SD of 3-6 measurements (medium) in n=3 experiments. In human SCH, values represent mean ± SD of single or duplicate measurements (cells+bile and cells) and mean ± SD of 2-6 measurements (medium) in n=4 experiments.
Figure 5.

Accumulation in pmol/mg protein (cells+bile and cells) and nM (medium) of GCDCA in cells+bile (solid bars), cells (open bars), and medium (hatched bars) in rat and human SCH following 24 h treatment with vehicle (0.1% DMSO). In CTL rat SCH, values represent the mean ± SD of duplicate or triplicate measurements (cells+bile and cells) in n=4 experiments, and mean ± SD of 3-6 measurements (medium) in n=3 experiments. In human SCH, values represent mean ± SD of single or duplicate measurements (cells+bile and cells) and mean ± SD of 2-6 measurements (medium) in n=4 experiments. Inset shows accumulation of GCDCA in cells+bile, cells, and medium in rat SCH with the y-axis scaled for easier visualization.
Figure 6.
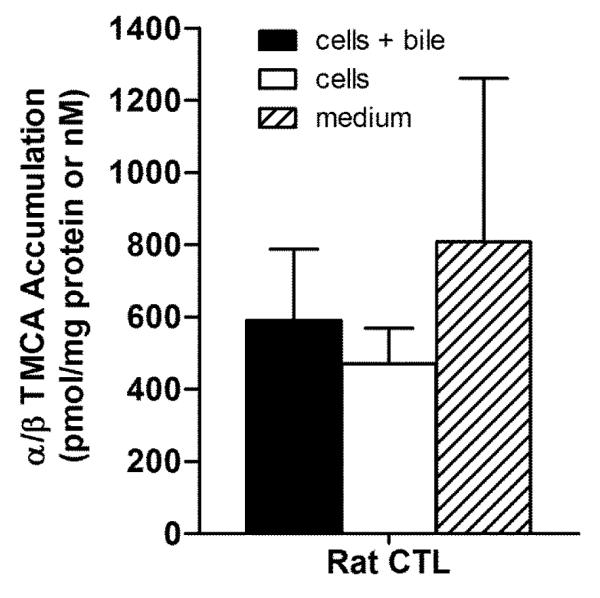
Accumulation in pmol/mg protein (cells+bile and cells) and nM (medium) of α/β TMCA measured in cells+bile (solid bar), cells (open bar), and medium (hatched bar) in rat SCH following 24 h treatment with vehicle (0.1% DMSO). Values represent the mean ± SD of duplicate or triplicate measurements (cells+bile and cells) in n=4 experiments, and mean ± SD of 3 or 6 measurements (medium) in n=3 experiments.
Figure 3.

Accumulation in pmol/mg protein (cells+bile and cells) and nM (medium) of GCA in cells+bile (solid bars), cells (open bars), and medium (hatched bars) in rat and human SCH following 24 h treatment with vehicle (0.1% DMSO). In CTL rat SCH, values represent the mean ± SD of duplicate or triplicate measurements (cells+bile and cells) in n=4 experiments, and mean ± SD of 3-6 measurements (medium) in n=3 experiments. In human SCH, values represent mean ± SD of single or duplicate measurements (cells+bile and cells) and mean ± SD of 2-6 measurements (medium) in n=4 experiments. Inset shows accumulation of GCA in cells+bile, cells, and medium in rat SCH with the y-axis scaled for easier visualization.
Figure 4.

Accumulation in pmol/mg protein (cells+bile and cells) and nM (medium) of TCDCA in cells+bile (solid bars), cells (open bars), and medium (hatched bars) in rat and human SCH following 24 h treatment with vehicle (0.1% DMSO). In CTL rat SCH, values represent the mean ± SD of duplicate or triplicate measurements (cells+bile and cells) in n=4 experiments, and mean ± SD of 3-6 measurements (medium) in n=3 experiments. In human SCH, values represent mean ± SD of single or duplicate measurements (cells+bile and cells) and mean ± SD of 2-6 measurements (medium) in n=4 experiments.
Accumulation of total BAs (the sum of all BAs measured) in human SCH and in rat SCH (which includes α/β TMCA) are shown in Figure 7. Total accumulation of BAs in CTL cells+bile, cells, and medium were approximately 3.4, 2.9, and 8.3-fold greater in human than in rat. Overall, > 99% of BAs in rat SCH were conjugated to taurine, while in human SCH, > 99% of BAs were conjugated to glycine. The biliary excretion index (BEI) for each BA species, as well as estimates for individual and total BA concentrations in cells+bile and cells were calculated as described in Materials and Methods (Tables 3 and 4). The rank order of the mean BEI values of individual BAs from highest to lowest in rat SCH was TCA > TCDCA > GCA > GCDCA > α/β TMCA. The rank order of intracellular concentrations of the individual BAs in rat were α/β TMCA >> TCDCA > TCA > GCDCA > GCA; the rank order of medium concentrations was α/β TMCA > TCA > TCDCA > GCA > GCDCA. In human, the rank order of BEIs was TCA > GCA > GCDCA > TCDCA. The rank order of intracellular concentrations in human SCH was GCDCA > GCA > TCDCA > TCA, while the rank order of medium concentrations was GCA >> GCDCA > TCA > TCDCA. BA concentrations in the bile compartment were not estimated because the volume of the bile canalicular spaces is not known.
Figure 7.

Accumulation in pmol/mg protein (cells+bile and cells) and nM (medium) of total BAs measured in cells+bile (solid bars), cells (open bars), and medium (hatched bars) in rat and human SCH following 24 h treatment with vehicle (0.1% DMSO). Inset shows accumulation of BAs in cells+bile, cells, and medium in rat SCH with the y-axis scaled for easier visualization.
Table 3.
BEI (% ± SD) and concentrations of individual BAs in cells+bile, cells, and medium in CTL (μM ± SD for cells+bile, cells, and medium) and TRO-treated (μM ± SD for cells+bile and cells, μM ± range for medium) rat SCH. Calculations assume a hepatocyte volume of 6.83 μl cells/well in a 6-well plate for rat SCH as described in Materials and Methods.
| Rat | cells+bile | cells | medium | BEI | |
|---|---|---|---|---|---|
| TCA | CTL | 2.22 ± 0.964 | 0.698 ± 0.203 | 0.262 ± 0.113 | 64.7 ± 18.3 |
| TCA | TRO | 2.17 ± 0.745 | 0.773 ± 0.195 | 0.265 ± 0.142 | 59.9 ± 23.2 |
| GCA | CTL | 0.054 ± 0.078 | 0.005 ± 0.010 | 0.030 ± 0.022 | 40.2 ± 49.1 |
| GCA | TRO | 0.086 ± 0.100 | 0.032 ± 0.029 | 0.031 ± 0.025 | 35.4 ± 35.9 |
| TCDCA | CTL | 2.39 ± 1.50 | 1.54 ± 1.43 | 0.050 ± 0.049 | 43.0 ± 20.3 |
| TCDCA | TRO | 1.64 ± 1.13 | 1.26 ± 1.17 | 0.051 ± 0.044 | 32.1 ± 21.3 |
| GCDCA | CTL | 0.242 ± 0.182 | 0.134 ± 0.141 | 0.013 ± 0.015 | 37.0 ± 30.5 |
| GCDCA | TRO | 0.197 ± 0.174 | 0.143 ± 0.134 | 0.012 ± 0.012 | 18.8 ± 18.6 |
| α/β TMCA | CTL | 77.8 ± 25.9 | 62.0 ± 13.0 | 0.808 ± 0.452 | 20.2 ± 13.8 |
| α/β TMCA | TRO | 92.0 ± 16.0 | 76.6 ± 15.8 | 0.532 ± 0.295 | 20.9 ± 18.2 |
| Total | CTL | 82.7 ± 11.6 | 64.3 ± 5.85 | 1.16 ± 0.210 | |
| Total | TRO | 96.1 ± 7.17 | 78.8 ± 7.11 | 0.891 ± 0.148 |
Table 4.
BEI (% ± SD) and individual concentrations (μM ± SD) of BAs in cells+bile, cells, and medium in human SCH. Calculations assume a hepatocyte volume of 6.79 μl cells/well in a 6-well plate for human SCH as described in Materials and Methods.
| Human | cells+bile | cells | medium | BEI (%) | |
|---|---|---|---|---|---|
| TCA | CTL | 0.703 ± 0.408 | 0.391 ± 0.189 | 0.010 ± 0.010 | 41.7 ± 16.2 |
| TCA | TRO | 0.334 ± 0.179 | 0.187 ± 0.141 | 0.008 ± 0.008 | 45.6 ± 39.7 |
| GCA | CTL | 136 ± 112 | 78.7 ± 64.1 | 8.70 ± 12.7 | 40.4 ± 11.9 |
| GCA | TRO | 59.0 ± 46.0 | 32.4 ± 26.9 | 6.59 ± 8.29 | 38.5 ± 26.0 |
| TCDCA | CTL | 0.876 ± 0.249 | 0.666 ± 0.151 | 0.002 ± 0.003 | 21.8 ± 14.3 |
| TCDCA | TRO | 0.469 ± 0.030 | 0.432 ± 0.061 | 0.003 ± 0.002 | 9.45 ± 12.3 |
| GCDCA | CTL | 142 ± 130 | 104 ± 91.0 | 0.891 ± 1.23 | 24.2 ± 8.81 |
| GCDCA | TRO | 73.8 ± 70.1 | 63.4 ± 62.4 | 0.706 ± 0.784 | 17.4 ± 18.2 |
| Total | CTL | 281 ± 85.7 | 183 ± 55.6 | 9.61 ± 6.36 | |
| Total | TRO | 134 ± 41.9 | 96.5 ± 34.0 | 7.31 ± 4.17 |
Discussion
BAs remained constant in cells+bile and cells of untreated rat SCH over days in culture
Initial experiments characterized the disposition of BAs over days in culture in the intracellular and biliary compartments of rat SCH. Total BA mass in cells+bile and cells remained constant over time. Analysis of BAs in the culture medium indicated that BAs increased over days, which may be attributed to increased BA synthesis and efflux, although immunoblot analysis indicated that protein expression of Cyp7a1, the rate-limiting enzyme in BA synthesis, remained stable over days in culture. The current studies measured BAs only in rat SCH through day 4; other investigators have reported that CYP7A1 mRNA increased several-fold from day 2 to day 4 in human hepatocytes cultured on a single layer of matrigel, suggesting increased BA synthesis capabilities (Ellis et al. 1998). Sauter et al. reported that total BA efflux from human SCH into the culture medium remained relatively constant from days 4-12 of culture (Sauter et al. 1996).
Species differences are evident in BA profiles of rat vs human SCH
BA profiles between rat and human SCH differed in two prominent ways. First, the total mass of BAs was ~7-fold greater in human SCH than in rat SCH, even when including α/β TMCA in rat, which is a rodent-specific BA. Conventionally-cultured human hepatocytes reportedly exhibited greater capacity to synthesize BAs than conventionally-cultured rat hepatocytes, even though BA synthesis in rat liver in vivo is 3- to 5-fold higher than in human liver (Ellis et al. 1998); although variability was high in human SCH in these studies, results were consistent with this observation. Variability was not unexpected; human plasma concentrations of CA and CDCA varied by 103-115% and 62-84%, respectively (Ahlberg et al. 1977; Tagliacozzi et al. 2003). In rodents, CDCA can be further hydroxylated to form muricholic acid (MCA), which is then conjugated to glycine or to taurine to form glycomuricholic acid (GMCA) or TMCA species (Botham and Boyd 1983). Analysis of α/β TMCA in rat SCH suggested that the total mass of BAs measured when including this abundant BA was still several-fold lower than in human SCH.
Second, taurine-conjugated BAs predominated in rat SCH, while glycine-conjugated BAs predominated in human SCH. Taurine-conjugated BAs, particularly α/β TMCA, comprised greater than 99% of BAs in rat SCH, consistent with reports that ~94-98% of BAs in rats are conjugated to taurine (Alvaro et al. 1986; Mizuta et al. 1999; Pellicoro et al. 2007). In human SCH, >99% of BAs were conjugated to glycine, and <1% were conjugated to taurine. These values differ from previous reports of ~75% glycine conjugates and ~25% taurine conjugates in human plasma and bile, but consistent with these previously reported concentrations of BAs, GCDCA was the most abundant BA measured in human SCH followed by GCA (Alvaro et al. 1986; Byrne et al. 2002; Tagliacozzi et al. 2003). One explanation for decreased taurine conjugation of BAs in human SCH could be depletion of available taurine; hepatic taurine concentrations are a major determinant of the proportion of BAs conjugated with taurine versus glycine (Hardison and Proffitt 1977). Because glycine is easily synthesized and not readily depleted in vivo, the concentration of available taurine determines the amount of BAs conjugated to taurine (Gottfries et al. 1966). While both rat and human SCH were exposed to the same culture conditions, rat hepatocytes were treated on day 3 and assayed on day 4, whereas human hepatocytes were treated on day 6 and assayed on day 7 due to delayed formation of bile canalicular networks in human SCH.
Intracellular and medium concentrations of BAs in rat and human SCH are comparable to reported values
Concentrations of BAs were estimated in cells+bile and cells using estimates for cell volume; BA concentrations in medium were based on a volume of 1.5 ml/well. Direct comparisons of intracellular concentrations of BAs between this study and other published values are difficult; efflux of BAs into the culture medium is reported most commonly in in vitro studies, and BAs measured in rat or human liver tissue likely also include residual BAs from bile canaliculi within the tissue. Furthermore, individual BAs are not always measured. In this study, the estimated concentration of total BAs measured (TCA + GCA + TCDCA + GCDCA + α/β TMCA) on day 4 in the medium of rat SCH (1.16 ± 0.21 μM) was 8.3-fold higher than the published concentration of total CA species + CDCA species of 0.14 ± 0.03 μM in the medium of rat conventionally-cultured hepatocytes (Ellis et al. 1998). This may reflect a greater capacity of hepatocytes cultured in sandwich-configuration to synthesize and efflux BAs. Dunn et al. (1991) quantified total BAs in the medium of rat SCH by measuring the conversion of 3α-hydroxy bile acids into 3-oxo bile acids catalyzed by 3α-hydroxysteroid dehydrogenase, based on the method of Mashige et al. (1981), and reported a BA secretion rate of ~1.2 nmol/hr in 4 ml medium; this translates to a maximum concentration of ~7 μM over a 24 h period (Dunn et al. 1991). The medium concentration of BAs in human SCH in the present study (9.61 ± 6.36 μM), also was ~2.6-fold higher than the published value of 3.68 ± 1.47 μM in the medium of human hepatocytes cultured in a conventional monolayer (Ellis et al. 1998), but is in good agreement with the estimates of ~3-10 μM in human plasma (Ahlberg et al. 1977; Tagliacozzi et al. 2003). The intracellular concentration of total BAs in humans in vivo is thought to be maintained at < 3 μM through efficient uptake and efflux (Hofmann 1999), although intracellular BA concentrations can reach 200 μM (Blitzer and Boyer 1982). The intracellular concentrations of total BAs in rat SCH (66.9 ± 6.56 μM) and human SCH (183 ± 111 μM) were within these ranges.
Exposure to TRO for 24 h caused no significant effects on BA profiles in rat or human SCH
It has been hypothesized that the hepatotoxicity of TRO may be related to inhibition of BSEP/Bsep and bile acid transport (reviewed in Masubuchi 2006). Several studies have established that TRO and its major metabolite, troglitazone sulfate (TS), inhibit BA transport (Preininger et al. 1999; Funk et al. 2001a; Funk et al. 2001b; Kemp et al. 2005). Previous reports indicated that acute (10 min) exposure to TRO, at concentrations up to 10 μM, inhibited both NTCP/Ntcp- and OATP/Oatp-mediated uptake and BSEP/Bsep-mediated canalicular excretion of exogenously administered [3H]TCA in vitro in both rat and human hepatocytes, leading to decreased intracellular [3H]TCA accumulation (Kemp et al. 2005; Marion et al. 2007; Ansede et al. 2010). Recently, however, Jemnitz et al. preloaded [3H]TCA for 1 min into rat and human SCH and subsequently measured [3H]TCA in cells + bile, cells, and medium following 10 min incubation with inhibitors; using this method, 100 μM TRO decreased biliary excretion and increased intracellular accumulation of [3H]TCA in both rat and human SCH without affecting basolateral efflux of [3H]TCA into the medium (Jemnitz et al. 2010). When primary rat and human SCH were incubated with 10 μM TRO for up to 120 min, TRO was metabolized rapidly and extensively to TS, which accumulated within hepatocytes (Lee et al., 2010). Given that TS is an even more potent inhibitor of BSEP/Bsep than parent TRO, it was hypothesized that culturing SCH for 24 h with 10 μM TRO would alter the disposition of endogenous, newly synthesized BAs, potentially causing the intracellular accumulation of one or more BAs. However, results indicated that after 24 h exposure, TRO caused no significant changes in the measured endogenous BA profiles in rat or human SCH. Further studies under different exposure scenarios are required to fully characterize the time course of alterations in BA disposition by inhibitors in SCH.
BAs may undergo basolateral efflux, and inhibition of NTCP/Ntcp- and OATP/Oatp-mediated re-uptake of effluxed BAs by TRO or TS may help maintain low intracellular BA concentrations. Compensatory mechanisms may also help maintain BA homeostasis in SCH. Multidrug resistance-associated proteins MRP3 (ABCC3) and MRP4 (ABCC4) can excrete BAs from the hepatocyte across the basolateral membrane into sinusoidal blood (Rius et al. 2006; Rius et al. 2003; Zelcer et al. 2003a; Zelcer et al. 2003b). Both MRP3 and MRP4 are induced in cholestasis, presumably as an adaptive response mechanism to compensate for increased intracellular concentrations of BAs (Assem et al. 2004; Schuetz et al. 2001; Zollner et al. 2003). Protein expression and/or membrane localization may increase in order to facilitate BA efflux; for example, the canalicular transport proteins P-glycoprotein (P-gp), BSEP, and MRP2 reside inside intracellular compartments and are capable of trafficking, within minutes, to the canalicular membrane when the demand for BA and organic anion efflux is increased (reviewed in Kipp and Arias 2002). Rapid membrane insertion of transport proteins allows faster up-regulation of transport capability than is possible through increased protein synthesis; therefore, increased membrane trafficking of transport proteins from cytosolic vesicular compartments may increase BA efflux.
Estimations of intracellular and medium concentrations are possible using B-CLEAR® technology
Data concerning the intracellular concentrations of xenobiotics (drugs, toxins, etc.) at the target organ or tissue often are limited, especially in human studies. However, intracellular concentrations may be a critical determinant of efficacy and/or toxicity. These results indicate that the rat and human SCH models can be advantageous for determining the cellular and biliary disposition of BAs, in addition to xenobiotics, since it is possible to measure BAs in the cells+bile, cells, and medium compartments directly, and the bile compartment indirectly. However, decreased expression of NTCP/Ntcp following isolation and culture of hepatocytes may affect the disposition of BAs over time in culture. Also, species differences exist in the time required for bile canaliculi formation, which indicates that rat and human SCH may not be directly comparable at the same timepoints (reviewed in Swift et al. 2010). Additionally, there are marked species differences in the BA profiles between rat and human SCH as outlined in these studies. Differences in the BA pool composition between rats and humans may influence the extent of toxicity of BA accumulation. CDCA is more hydrophobic and, thus, cytotoxic than CA; glycine-conjugated BAs are more toxic than taurine-conjugated BAs. The conversion of CDCA to MCA in rodents increases its hydrophilicity and further decreases the toxicity of CDCA (reviewed in Thomas et al. 2008). Thus, the predominance of TMCA in rat SCH compared to the predominance of GCDCA in human SCH may differentially affect the potential for toxicity caused by intracellular BA accumulation. Because individual BA species have different affinities for BA transporters, and inhibitors can have differential effects on transport kinetics based on species (Marion et al. 2011; Kis et al. 2009; Byrne et al. 2002; Gerloff et al. 1998; Noe et al. 2001), it may be necessary to take these differences into consideration when extrapolating from rat to human.
In conclusion, BA profiles in rat and human SCH were similar to those reported in the literature in other in vitro models and in vivo, suggesting that SCH may be a promising model to study the effects of xenobiotics on endogenous BA metabolism and disposition. However, clear differences in the BA pool composition (i.e. taurine versus glycine conjugation; the presence of MCA species in rodents) between rats and humans warrant consideration when attempting to compare the hepatobiliary disposition of specific BAs between species.
Highlights.
>Sandwich-cultured hepatocytes (SCH) are commonly used to study hepatic transport. >Endogenous bile acids were measured in rat and human SCH. >Bile acid profiles in SCH were similar to those reported in vivo for each species. >The relative mass of individual bile acids differed markedly between species. > 24-h troglitazone treatment had no significant effect on intracellular accumulation of bile acids.
Acknowledgments
Funding This work was supported by the National Institutes of Health, National Institute of General Medical Sciences [GM41935 to K.L.R.B] and the National Institutes of Health, National Institute of Environmental Health Sciences [T32-ES007126 to T.L.M.].
Abbreviations
- (BA)
bile acids
- (BSEP)
bile salt export pump
- (BEI)
biliary excretion index
- (CTL)
control
- (CYP450)
cytochrome P450
- (DMSO)
dimethyl sulfoxide
- (DMEM)
Dulbecco’s modified Eagle medium
- (EDTA)
ethylenediaminetetraacetic acid
- (GCDCA)
glycochenodeoxycholic acid
- (GCA)
glycocholic acid
- (GMCA)
glycomuricholic acid
- (HBSS)
Hanks’ balanced salt solution
- (LC-MS/MS)
liquid chromatography-tandem mass spectrometry
- (MRP2)
multidrug resistance-associated protein 2
- (MRP4)
multidrug resistance-associated protein 4
- (MCA)
muricholic acid
- (NTCP)
Na+-taurocholate cotransporting polypeptide
- (OATP)
organic anion transporting polypeptide
- (PVDF)
polyvinylidene fluoride
- (QCs)
quality controls
- (SCH)
sandwich cultured hepatocytes
- (SDS)
sodium dodecyl sulfate
- (TCDCA)
taurochenodeoxycholic acid
- (TCA)
taurocholic acid
- (TRO)
troglitazone
- (TS)
troglitazone sulfate
- (α/β TMCA)
α- and β-tauromuricholic acid
Footnotes
Conflict of Interest Statement K.L.R.B. is a co-founder and Chair of the Scientific Advisory Board for Qualyst, Inc., which has exclusively licensed the sandwich-cultured hepatocyte technology for quantification of biliary excretion (B-CLEAR®). T.L.M., C.H.P., and R.L.S.C., III, are currently employed by Qualyst, Inc.
Publisher's Disclaimer: This is a PDF file of an unedited manuscript that has been accepted for publication. As a service to our customers we are providing this early version of the manuscript. The manuscript will undergo copyediting, typesetting, and review of the resulting proof before it is published in its final citable form. Please note that during the production process errors may be discovered which could affect the content, and all legal disclaimers that apply to the journal pertain.
REFERENCES
- Ahlberg J, Angelin B, Bjorkhem I, Einarsson K. Individual bile acids in portal venous and systemic blood serum of fasting man. Gastroenterology. 1977;73:1377–82. [PubMed] [Google Scholar]
- Alvaro D, Cantafora A, Attili AF, Ginanni Corradini S, De Luca C, Minervini G, Di Biase A, Angelico M. Relationships between bile salts hydrophilicity and phospholipid composition in bile of various animal species. Comp Biochem Physiol B. 1986;83:551–4. doi: 10.1016/0305-0491(86)90295-6. [DOI] [PubMed] [Google Scholar]
- Ansede JH, Smith WR, Perry CH, St Claire RL, 3rd, Brouwer KR. An in vitro assay to assess transporter-based cholestatic hepatotoxicity using sandwich-cultured rat hepatocytes. Drug Metab Dispos. 2010;38:276–80. doi: 10.1124/dmd.109.028407. [DOI] [PubMed] [Google Scholar]
- Assem M, Schuetz EG, Leggas M, Sun D, Yasuda K, Reid G, Zelcer N, Adachi M, Strom S, Evans RM, Moore DD, Borst P, Schuetz JD. Interactions between hepatic Mrp4 and Sult2a as revealed by the constitutive androstane receptor and Mrp4 knockout mice. J Biol Chem. 2004;279:22250–7. doi: 10.1074/jbc.M314111200. [DOI] [PubMed] [Google Scholar]
- Blitzer BL, Boyer JL. Cellular mechanisms of bile formation. Gastroenterology. 1982;82:346–57. [PubMed] [Google Scholar]
- Botham KM, Boyd GS. The metabolism of chenodeoxycholic acid to beta-muricholic acid in rat liver. Eur J Biochem. 1983;134:191–6. doi: 10.1111/j.1432-1033.1983.tb07550.x. [DOI] [PubMed] [Google Scholar]
- Byrne JA, Strautnieks SS, Mieli-Vergani G, Higgins CF, Linton KJ, Thompson RJ. The human bile salt export pump: characterization of substrate specificity and identification of inhibitors. Gastroenterology. 2002;123:1649–58. doi: 10.1053/gast.2002.36591. [DOI] [PubMed] [Google Scholar]
- Delzenne NM, Calderon PB, Taper HS, Roberfroid MB. Comparative hepatotoxicity of cholic acid, deoxycholic acid and lithocholic acid in the rat: in vivo and in vitro studies. Toxicol Lett. 1992;61:291–304. doi: 10.1016/0378-4274(92)90156-e. [DOI] [PubMed] [Google Scholar]
- Desmet VJ. Histopathology of cholestasis. Verh Dtsch Ges Pathol. 1995;79:233–40. [PubMed] [Google Scholar]
- Dunn JC, Tompkins RG, Yarmush ML. Long-term in vitro function of adult hepatocytes in a collagen sandwich configuration. Biotechnol Prog. 1991;7:237–45. doi: 10.1021/bp00009a007. [DOI] [PubMed] [Google Scholar]
- Ellis E, Goodwin B, Abrahamsson A, Liddle C, Mode A, Rudling M, Bjorkhem I, Einarsson C. Bile acid synthesis in primary cultures of rat and human hepatocytes. Hepatology. 1998;27:615–20. doi: 10.1002/hep.510270241. [DOI] [PubMed] [Google Scholar]
- Fattinger K, Funk C, Pantze M, Weber C, Reichen J, Stieger B, Meier PJ. The endothelin antagonist bosentan inhibits the canalicular bile salt export pump: a potential mechanism for hepatic adverse reactions. Clin Pharmacol Ther. 2001;69:223–31. doi: 10.1067/mcp.2001.114667. [DOI] [PubMed] [Google Scholar]
- Funk C, Pantze M, Jehle L, Ponelle C, Scheuermann G, Lazendic M, Gasser R. Troglitazone-induced intrahepatic cholestasis by an interference with the hepatobiliary export of bile acids in male and female rats. Correlation with the gender difference in troglitazone sulfate formation and the inhibition of the canalicular bile salt export pump (Bsep) by troglitazone and troglitazone sulfate. Toxicology. 2001a;167:83–98. doi: 10.1016/s0300-483x(01)00460-7. [DOI] [PubMed] [Google Scholar]
- Funk C, Ponelle C, Scheuermann G, Pantze M. Cholestatic potential of troglitazone as a possible factor contributing to troglitazone-induced hepatotoxicity: in vivo and in vitro interaction at the canalicular bile salt export pump (Bsep) in the rat. Mol Pharmacol. 2001b;59:627–35. [PubMed] [Google Scholar]
- Gores GJ, Miyoshi H, Botla R, Aguilar HI, Bronk SF. Induction of the mitochondrial permeability transition as a mechanism of liver injury during cholestasis: a potential role for mitochondrial proteases. Biochim Biophys Acta. 1998;1366:167–75. doi: 10.1016/s0005-2728(98)00111-x. [DOI] [PubMed] [Google Scholar]
- Gottfries A, Schersten T, Ekdahl PH. The capacity of human liver homogenates to synthesize taurocholic and glycocholic acid in vitro. Scand J Clin Lab Invest. 1966;18:643–53. doi: 10.3109/00365516609049048. [DOI] [PubMed] [Google Scholar]
- Hardison WG, Proffitt JH. Influence of hepatic taurine concentration on bile acid conjugation with taurine. Am J Physiol. 1977;232:E75–9. doi: 10.1152/ajpendo.1977.232.1.E75. [DOI] [PubMed] [Google Scholar]
- Hofmann AF. Bile Acids: The Good, the Bad, and the Ugly. News Physiol Sci. 1999;14:24–29. doi: 10.1152/physiologyonline.1999.14.1.24. [DOI] [PubMed] [Google Scholar]
- Kaplowitz N. Drug-induced liver disorders: implications for drug development and regulation. Drug Saf. 2001;24:483–90. doi: 10.2165/00002018-200124070-00001. [DOI] [PubMed] [Google Scholar]
- Kemp DC, Zamek-Gliszczynski MJ, Brouwer KL. Xenobiotics inhibit hepatic uptake and biliary excretion of taurocholate in rat hepatocytes. Toxicol Sci. 2005;83:207–14. doi: 10.1093/toxsci/kfi020. [DOI] [PubMed] [Google Scholar]
- Keppler D, Cui Y, Konig J, Leier I, Nies A. Export pumps for anionic conjugates encoded by MRP genes. Adv Enzyme Regul. 1999;39:237–46. doi: 10.1016/s0065-2571(98)00015-6. [DOI] [PubMed] [Google Scholar]
- Keppler D, Konig J. Hepatic secretion of conjugated drugs and endogenous substances. Semin Liver Dis. 2000;20:265–72. doi: 10.1055/s-2000-9391. [DOI] [PubMed] [Google Scholar]
- Kipp H, Arias IM. Trafficking of canalicular ABC transporters in hepatocytes. Annu Rev Physiol. 2002;64:595–608. doi: 10.1146/annurev.physiol.64.081501.155793. [DOI] [PubMed] [Google Scholar]
- Kis E, Ioja E, Nagy T, Szente L, Herédi-Szabó K, Krajcsi P. Effect of membrane cholesterol on BSEP/Bsep activity: species specificity studies for substrates and inhibitors. Drug Metab Dispos. 2009;37:1878–86. doi: 10.1124/dmd.108.024778. [DOI] [PubMed] [Google Scholar]
- LeCluyse EL, Audus KL, Hochman JH. Formation of extensive canalicular networks by rat hepatocytes cultured in collagen-sandwich configuration. Am J Physiol. 1994;266:C1764–74. doi: 10.1152/ajpcell.1994.266.6.C1764. [DOI] [PubMed] [Google Scholar]
- Lee J, Brouwer KR. Determination of Intracellular Volume of Rat and Human Sandwich-Cultured Hepatocytes. Society of Toxicology Annual Meeting; Salt Lake City, UT, USA. 2010. [Google Scholar]
- Liu X, Chism JP, LeCluyse EL, Brouwer KR, Brouwer KLR. Correlation of biliary excretion in sandwich-cultured rat hepatocytes and in vivo in rats. Drug Metab Dispos. 1999a;27:637–44. [PubMed] [Google Scholar]
- Liu X, LeCluyse EL, Brouwer KR, Gan LS, Lemasters JJ, Stieger B, Meier PJ, Brouwer KL. Biliary excretion in primary rat hepatocytes cultured in a collagen-sandwich configuration. Am J Physiol. 1999b;277:G12–21. doi: 10.1152/ajpgi.1999.277.1.G12. [DOI] [PubMed] [Google Scholar]
- Liu X, LeCluyse EL, Brouwer KR, Lightfoot RM, Lee JI, Brouwer KL. Use of Ca2+ modulation to evaluate biliary excretion in sandwich-cultured rat hepatocytes. J Pharmacol Exp Ther. 1999c;289:1592–9. [PubMed] [Google Scholar]
- Marion TL, Leslie EM, Brouwer KLR. Use of sandwich-cultured hepatocytes to evaluate impaired bile acid transport as a mechanism of drug-induced hepatotoxicity. Mol Pharm. 2007;4:911–8. doi: 10.1021/mp0700357. [DOI] [PubMed] [Google Scholar]
- Marion TL, Perry CH, St. Claire RL, 3rd, Yue W, Brouwer KLR. Differential Disposition of Chenodeoxycholic Acid versus Taurocholic Acid in Response to Acute Troglitazone Exposure in Rat Hepatocytes. Toxicol Sci. 2011;120:371–80. doi: 10.1093/toxsci/kfr014. [DOI] [PMC free article] [PubMed] [Google Scholar]
- Mashige F, Tanaka N, Maki A, Kamei S, Yamanaka M. Direct spectrophotometry of total bile acids in serum. Clin Chem. 1981;27:1352–6. [PubMed] [Google Scholar]
- Masubuchi Y. Metabolic and non-metabolic factors determining troglitazone hepatotoxicity: a review. Drug Metab Pharmacokinet. 2006;21:347–56. doi: 10.2133/dmpk.21.347. [DOI] [PubMed] [Google Scholar]
- McRae MP, Lowe CM, Tian X, Bourdet DL, Ho RH, Leake BF, Kim RB, Brouwer KLR, Kashuba AD. Ritonavir, saquinavir, and efavirenz, but not nevirapine, inhibit bile acid transport in human and rat hepatocytes. J Pharmacol Exp Ther. 2006;318:1068–75. doi: 10.1124/jpet.106.102657. [DOI] [PubMed] [Google Scholar]
- Mizuta K, Kobayashi E, Uchida H, Ogino Y, Fujimura A, Kawarasaki H, Hashizume K. Cyclosporine inhibits transport of bile acid in rats: comparison of bile acid composition between liver and bile. Transplant Proc. 1999;31:2755–6. doi: 10.1016/s0041-1345(99)00554-0. [DOI] [PubMed] [Google Scholar]
- Pauli-Magnus C, Meier PJ. Hepatobiliary transporters and drug-induced cholestasis. Hepatology. 2006;44:778–87. doi: 10.1002/hep.21359. [DOI] [PubMed] [Google Scholar]
- Pauli-Magnus C, Stieger B, Meier Y, Kullak-Ublick GA, Meier PJ. Enterohepatic transport of bile salts and genetics of cholestasis. J Hepatol. 2005;43:342–57. doi: 10.1016/j.jhep.2005.03.017. [DOI] [PubMed] [Google Scholar]
- Pellicoro A, van den Heuvel FA, Geuken M, Moshage H, Jansen PL, Faber KN. Human and rat bile acid-CoA:amino acid N-acyltransferase are liver-specific peroxisomal enzymes: implications for intracellular bile salt transport. Hepatology. 2007;45:340–8. doi: 10.1002/hep.21528. [DOI] [PubMed] [Google Scholar]
- Preininger K, Stingl H, Englisch R, Furnsinn C, Graf J, Waldhausl W, Roden M. Acute troglitazone action in isolated perfused rat liver. Br J Pharmacol. 1999;126:372–8. doi: 10.1038/sj.bjp.0702318. [DOI] [PMC free article] [PubMed] [Google Scholar]
- Rius M, Hummel-Eisenbeiss J, Hofmann AF, Keppler D. Substrate specificity of human ABCC4 (MRP4)-mediated cotransport of bile acids and reduced glutathione. Am J Physiol Gastrointest Liver Physiol. 2006;290:G640–9. doi: 10.1152/ajpgi.00354.2005. [DOI] [PubMed] [Google Scholar]
- Rius M, Nies AT, Hummel-Eisenbeiss J, Jedlitschky G, Keppler D. Cotransport of reduced glutathione with bile salts by MRP4 (ABCC4) localized to the basolateral hepatocyte membrane. Hepatology. 2003;38:374–84. doi: 10.1053/jhep.2003.50331. [DOI] [PubMed] [Google Scholar]
- Sauter G, Fischer S, Pahernik S, Koebe HG, Paumgartner G. Formation of cholic acid and chenodeoxycholic acid from 7 alpha-hydroxycholesterol and 27-hydroxycholesterol by primary cultures of human hepatocytes. Biochim Biophys Acta. 1996;1300:25–9. doi: 10.1016/0005-2760(95)00231-6. [DOI] [PubMed] [Google Scholar]
- Schuetz EG, Strom S, Yasuda K, Lecureur V, Assem M, Brimer C, Lamba J, Kim RB, Ramachandran V, Komoroski BJ, Venkataramanan R, Cai H, Sinal CJ, Gonzalez FJ, Schuetz JD. Disrupted bile acid homeostasis reveals an unexpected interaction among nuclear hormone receptors, transporters, and cytochrome P450. J Biol Chem. 2001;276:39411–8. doi: 10.1074/jbc.M106340200. [DOI] [PubMed] [Google Scholar]
- Shibukawa A, Sawada T, Nakao C, Izumi T, Nakagawa T. High-performance frontal analysis for the study of protein binding of troglitazone (CS-045) in albumin solution and in human plasma. J Chromatogr A. 1995;697:337–43. doi: 10.1016/0021-9673(94)00929-4. [DOI] [PubMed] [Google Scholar]
- Stieger B, Fattinger K, Madon J, Kullak-Ublick GA, Meier PJ. Drug- and estrogen-induced cholestasis through inhibition of the hepatocellular bile salt export pump (Bsep) of rat liver. Gastroenterology. 2000;118:422–30. doi: 10.1016/s0016-5085(00)70224-1. [DOI] [PubMed] [Google Scholar]
- Swift B, Pfeifer ND, Brouwer KLR. Sandwich-cultured hepatocytes: an in vitro model to evaluate hepatobiliary transporter-based drug interactions and hepatotoxicity. Drug Metab Rev. 2010;42:446–71. doi: 10.3109/03602530903491881. [DOI] [PMC free article] [PubMed] [Google Scholar]
- Tagliacozzi D, Mozzi AF, Casetta B, Bertucci P, Bernardini S, Di Ilio C, Urbani A, Federici G. Quantitative analysis of bile acids in human plasma by liquid chromatography-electrospray tandem mass spectrometry: a simple and rapid one-step method. Clin Chem Lab Med. 2003;41:1633–41. doi: 10.1515/CCLM.2003.247. [DOI] [PubMed] [Google Scholar]
- Trauner M, Boyer JL. Bile salt transporters: molecular characterization, function, and regulation. Physiol Rev. 2003;83:633–71. doi: 10.1152/physrev.00027.2002. [DOI] [PubMed] [Google Scholar]
- Zelcer N, Reid G, Wielinga P, Kuil A, van der Heijden I, Schuetz JD, Borst P. Steroid and bile acid conjugates are substrates of human multidrug-resistance protein (MRP) 4 (ATP-binding cassette C4) Biochem J. 2003a;371:361–7. doi: 10.1042/BJ20021886. [DOI] [PMC free article] [PubMed] [Google Scholar]
- Zelcer N, Saeki T, Bot I, Kuil A, Borst P. Transport of bile acids in multidrug-resistance-protein 3-overexpressing cells co-transfected with the ileal Na+-dependent bile-acid transporter. Biochem J. 2003b;369:23–30. doi: 10.1042/BJ20021081. [DOI] [PMC free article] [PubMed] [Google Scholar]
- Zollner G, Fickert P, Silbert D, Fuchsbichler A, Marschall HU, Zatloukal K, Denk H, Trauner M. Adaptive changes in hepatobiliary transporter expression in primary biliary cirrhosis. J Hepatol. 2003;38:717–27. doi: 10.1016/s0168-8278(03)00096-5. [DOI] [PubMed] [Google Scholar]
- Zollner G, Trauner M. Mechanisms of cholestasis. Clin Liver Dis. 2008;12:1–26. vii. doi: 10.1016/j.cld.2007.11.010. [DOI] [PubMed] [Google Scholar]