

Abstract
The current clinical management of abdominal aortic aneurysm (AAA) disease is based to a great extent on measuring the aneurysm maximum diameter to decide when timely intervention is required. Decades of clinical evidence show that aneurysm diameter is positively associated with the risk of rupture, but other parameters may also play a role in causing or predisposing the AAA to rupture. Geometric factors such as vessel tortuosity, intraluminal thrombus volume, and wall surface area are implicated in the differentiation of ruptured and unruptured AAAs. Biomechanical factors identified by means of computational modeling techniques, such as peak wall stress, have been positively correlated with rupture risk with a higher accuracy and sensitivity than maximum diameter alone. The objective of this review is to examine these factors, which are found to influence AAA disease progression, clinical management and rupture potential, as well as to highlight on-going research by our group in aneurysm modeling and rupture risk assessment.
Key Terms: aneurysm, geometric modeling, biomechanics, rupture, finite element analysis, image segmentation
1. INTRODUCTION
An abdominal aortic aneurysm (AAA) is a focal abnormal widening of the aorta to a size larger than approximately 1.5 times the normal healthy diameter (see Fig. 1). It is associated with degradation of connective tissue in the arterial wall and is most often found with a deposition within called intra-luminal-thrombus (ILT), consisting of fibrinous blood clots and cell debris. The hollow cavity through which blood flows is called the lumen.
Figure 1.
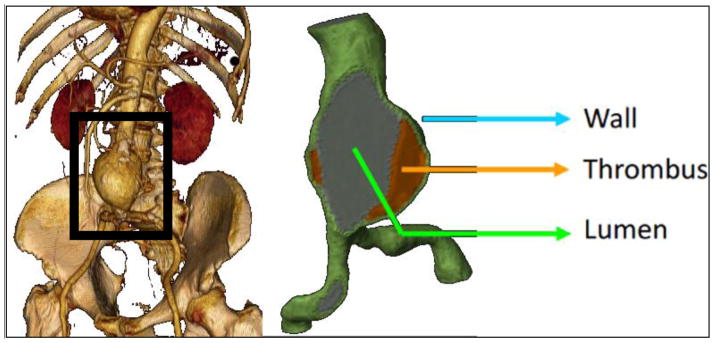
Aneurysmatic abdominal aorta (left frame is courtesy of University of California at Los Angeles).
AAAs are potentially life-threatening medical conditions often requiring surgical intervention. The underlying cause for the formation of an aneurysm can be either inherited (i.e., Marfan and Ehlers-Danlos syndromes) or acquired, with risk factors including hypertension, atherosclerosis, and smoking among others. The disorder is more common in men than in women, with prevalence rates estimated at between 1.3% and 8.9% in men and between 1.0% and 2.2% in women, accounting for more than 8,000 deaths in the United Kingdom and 15,000 deaths in the US every year.73 Only 25% of AAAs rupture in an individual’s lifetime,100 therefore clinicians compare the risk of rupture with the risk of repair, particularly because of the increased peri-operative mortality in elderly patients.87 Typical guidelines currently used in the clinical management of AAAs are based on the maximum diameter derived metrics as a criterion for deciding the course of treatment. In clinical practice fusiform aneurysms larger than 5.5 cm are recommended for surgical intervention and those smaller than 4.0 cm are considered at low risk of rupture.9 Other morphological parameters are associated with risk of rupture, e.g. AAA volume,12,65 rate of expansion,7,43 ILT volume,85 and asymmetry and tortuosity.58
Recent research has pointed to the unsuitability of recommending intervention based solely on the maximum diameter criterion.19,23,27,29,100 It is known that small AAAs can rupture and large AAAs can remain stable. In an autopsy study of four hundred and seventy-three non-resected aneurysms13, 13% of aneurysms with a maximum diameter less than 5.0 cm ruptured and 60% with diameters greater than 5.0 cm remained intact. Therefore, other rupture risk parameters are needed as an alternative to the customary AAA size and expansion rate criteria. A biomechanics based approach correlated with geometric indices may be a viable option. Recent finite element (FE) simulation studies by Gasser et al30 found that biomechanical parameters such as Peak Wall Stress (PWS) and Peak Wall Rupture Risk (PWRR) were 1.17 and 1.43 times higher in ruptured AAAs compared to those in diameter-matched unruptured aneurysms. McGloughlin and Doyle51 make a concise review on recent AAA biomechanics-based rupture risk biomarkers examining their potential for clinical decision-making tools. The scope of the present review is different from that of McGloughlin and Doyle51 and Vorp100 in that it focuses exclusively on the computational aspects involved in the evaluation of biomechanics and geometry quantification as it relates to AAA rupture risk assessment.
There are many factors implicated in vascular wall biomechanical assessment (see Fig. 2) and the modeling strategies to address these differ greatly among researchers (see Tables 1–4). This manuscript reviews factors involved in AAA development and rupture risk, considering i) geometric features that discriminate AAA population subsets, and ii) biomechanical factors implicated in the assessment of rupture risk based on the AAA patient-specific geometry, wall structure, and mechanical response. In particular, we address the relative importance of wall mechanics vs. geometry quantification in the evaluation of AAA rupture risk, as the aneurysm geometry is believed to be the primary predictor of peak wall stress.
Figure 2.

Factors affecting evaluation of computational wall mechanics (exclusive of image segmentation errors).
Table 1.
| Abbreviation | Meaning |
|---|---|
| 3DAO | 3D Active Object |
| ALE | Arbitrary Lagrangian Eulerian coupling |
| Asym | Asymmetry |
| AxiSym | Axisymmetric |
| Avg Sys | Average of systolic pressure measured for each patient |
| Bifur | Bifurcation |
| BIM | Backward integral method |
| Ca | Calcification |
| E | Linear |
| GC-circle | Gauss curve for anterior and posterior with circular c/s fitted in between |
| HE | Hyperelastic isotropic |
| HEaniso | Hyperelastic anisotroic |
| I | Idealized |
| Implicit | Modeled implicitly by varying material properties of select elements in mesh |
| N | No |
| PC | Point cloud |
| PHE | Porohyperelastic |
| PS | Patient-specific |
| PWS | Peak wall stress |
| Quad-04 | 4 noded quadrilateral element |
| S | Shell |
| S3 | 3 noded shell element |
| S4 | 4 noded shell element |
| S8 | 8 noded shell element |
| SS | Surface smoothing |
| Tri-3 | 3 noded triangle |
| Y | Yes |
Table 4.
Literature review summary – Fluid-structure interaction AAA modeling (Please refer to Table 1 for abbreviations used.)
| Year | First Author | Coupling | Wall Material | ILT Material | Fluid | InletBC | OutletBC |
|---|---|---|---|---|---|---|---|
| 2001 | Di Martino | ALE | E-2.7 MPa | E=0.11 MPa | Newtonian | 5xDia extension with Flat Velocity profile | time varying pressure |
| 2005 | Scotti | Iteratively Coupled | E-2.7 MPa | - | Newtonian | parabolic profile | time varying pressure |
| 2005 | Wolters | ALE, iterative coupling | E | - | Carreau–Yasuda model (Shear thinning) | plug profile | Zero-traction |
| 2006 | Leung | ALE, Fully Coupled | HE – 59 | - | Newtonian | plug profile | time varying pressure |
| 2007 | Papaha- rilaou | decoupled | HE – 59 | E=0.11 MPa | Newtonian | PS Womersley | Flow split (?) |
| 2007 | Scotti | ALE, Fully Coupled | HE – 59 | HE | Newtonian | plug profile | time varying pressure |
| 2006 | Frauen- felder | Fully Coupled | E-10 MPa | - | Newtonian | plug profile | Zero-traction |
| 2009 | Rissland | Fully Coupled | HEaniso | E=0.11 MPa | Newtonian | plug profile | time varying pressure |
| 2006 | Li | Fully Coupled | E-4.66 MPa | non-Newtonian | parabolic profile | time varying pressure | |
| 2009 | Bluestein | Decoupled | HE | E=0.11 MPa | Newtonian | steady plug flow | Zero-traction (?) |
2. GEOMETRIC FACTORS
2.1 Baseline diameter and predisposition for AAA development
The role of size as a geometric factor involved in the aneurysmatic condition of the aorta and progression of the disease has been the basis for clinical management of AAA. In an interesting study by Solberg et al,80 where 4,265 subjects with a normal sized aorta resulted in 116 AAAs diagnosed after 7 years, a statistical analysis revealed that the baseline diameter was a highly significant (p < 0.001), strong (95% CI: 7–76 times higher risk), and gender-independent risk factor for developing AAA. A smaller increase in diameter was noticed in patients with a smaller aorta when compared to the increase exhibited by patients with a larger aorta.80 Moreover, when adjusted for age and aortic diameter, male sex was not significantly associated with AAA. This implies that geometry is more significant than gender in AAA development. The Solberg findings are in agreement with the previously reported fact that the growth rate of larger non-aneurysmatic aortas was higher than in smaller non-aneurysmatic aortas.53
2.2 Importance of shape for wall mechanics estimation
The mechanics of the AAA wall and the resulting distribution of wall stress are influenced by the individual shape, in addition to the size, of the aneurysmal aorta. While precise soft tissue characterizations of the wall and ILT, as well as patient-specific blood flow velocity measurements, are imperative to achieve accurate computational predictions of the flow-induced wall stresses, the native, evolving AAA geometry is likely the most important feature to consider in evaluating the wall mechanics. A detailed discussion comparing various material property models in the ensuing wall stresses and strains can be found elsewhere.66,68 Limiting the characterization of this geometry to the measurement of maximum diameter or expansion rate from medical images is not the best strategy to address the at-risk status of aneurysms on an individual basis. AAA shape is complex; most aneurysms are generally tortuous, asymmetric, and with amorphous multi-layered ILT.2,22,100
Preliminary work in aneurysm biomechanics suggests that curvature quantification is more relevant than diameter for rupture risk assessment.47,63 Ruptured AAAs seem to be less tortuous and have a larger cross-sectional diameter asymmetry,28 which is consistent with FEA studies showing that the highest wall stress is obtained in AAAs with an asymmetric geometry.102 Moreover, the location of maximum stress is at the inflection point where the aneurysm curvature changes from concave to convex,27 which was also observed in symmetric models.25 Idealized fusiform and saccular models moreover yield an increase in wall stress with bulge diameter and asymmetry.71,102 The potential for geometry based indices to assess AAA rupture risk is parallel to a recent study describing the derivation of a set of global indices quantifying size and shape of cerebral aneurysms to assess their rupture potential and for choosing the appropriate clinical treatment modality.58
2.2.1 ILT as a geometric feature
ILT is a common presence in most AAAs and is known to alter the stress distribution of the aneurysmal wall100,103 and directly affect AAA growth and rupture,8,40,52,84,85,101 making it relevant for the accuracy of AAA biomechanics. Nonlinear regression models for non-invasive wall strength estimations have used local ILT thickness as a modeling parameter.96
2.2.2 Wall thickness as a geometric feature
A factor of significant importance in AAA rupture risk prediction is the individual, nonuniformity of the wall thickness. Figure 3 shows the estimation of AAA wall thickness distribution obtained from a contrast-enhanced CT scan.78 Di Martino et al,16 using a laser micrometer, measured the thickness of AAA wall specimens obtained fresh in the operating room from patients undergoing surgical repair. A significant difference was found in wall thickness between ruptured (3.6 ± 0.3 mm) and electively repaired (2.5 ± 0.1 mm) aneurysms as well as an inverse correlation between wall thickness and local tissue strength. The tensile strength of ruptured AAA tissue was found to be lower than that of electively repaired tissue (54 N/cm2 vs. 82 N/cm2), and AAA rupture was associated with aortic wall weakening, but not with wall stiffening. In an autopsy study, Raghavan et al61 analyzed the tissue properties of three un-ruptured and one ruptured AAA revealing that all aneurysms had considerable regional variation in wall thickness and there was a significant reduction in wall thickness near the rupture site. Similarly, Mower et al55 demonstrated that wall thickness is a major parameter influencing wall stress distribution compared to aneurysm maximum diameter alone. It can be argued that the pathological state of the abdominal aorta results in an overall thicker, albeit weaker wall,16 even though AAA rupture, observed to occur at thin regions of the wall,61 is a local phenomenon triggered by the local wall mechanics. This observation underscores the need for appropriate wall thickness modeling techniques as well as the inadequacy of global size metrics such as diameter for patient specific risk assessment.
Figure 3.

Estimated wall thickness distribution (in mm) as a point cloud resulting from a segmented CT dataset.68
2.2.3 Correlation of geometric features with peak wall stress
Geometric features have been shown to be significant predictors of peak wall stress (PWS) and subsequent risk of or predisposition to rupture.27,29,97 Multiple regression analysis was performed on 39 patients and 17 features to assess the influence of the features on peak wall stress.36 PWS was correlated with the mean centerline curvature, the maximum centerline curvature, and the maximum centerline torsion of the AAAs, with mean centerline curvature being the only significant predictor of PWS and subsequent rupture risk resulting from the multiple regression analysis. A multivariate analysis of 40 variables of 259 aneurysms revealed that ruptured aneurysms tend to be less tortuous and have a greater cross-sectional diameter asymmetry.28 Similarly, Georgakarakos and colleagues33 developed a linear model to associate PWS and geometric parameters. They report that the optimal predictive model can be formulated as follows: , where MaxDiameter is the maximum in-plane diameter and IntTortuosity is the internal tortuosity. While it is difficult to reconcile these conflicting observations, the study by Fillinger et al28 appears more reliable since the potential compounding effects of ILT do not play a role in the analysis, the population sample is larger, and the age, gender, and diameter matched approach makes the outcome more controlled.
2.2.4 Geometry quantification
The ability to characterize the AAA geometry non-invasively from clinical images is an attractive strategy for rupture risk assessment as it can provide detailed information on the aneurysm morphology beyond what can be achieved by simple visual inspection of the images in the Radiology suite. To this end, Somkantha et al81 trained a Naïve Bayes classifier using three features (area, perimeter, and compactness) derived from image segmentation to discriminate between healthy and diseased arteries. Using 30 images for training and 20 images for testing, they obtained accuracy levels of 95%. However, as the aneurismal aorta is larger than a healthy aorta, it is expected that these size features can accurately discriminate between healthy and diseased aortas. Shum et al78,79 developed a quantitative pipeline consisting of image segmentation and geometry quantification to compute 64 features that describe the size, shape,50 wall thickness, and curvature for a subset of ruptured and unruptured aneurysms (see Fig. 4). Utilizing these features, a decision tree model (see Fig. 5) was trained on 76 AAAs and resulted in a prediction accuracy of 87% when including sac length, surface area, tortuosity, and the ratio of ILT to AAA sac volume as the classifying features.77,79
Figure 4.

1-D size indices computed from segmented CT images: (a) maximum diameter (Dmax), proximal neck diameter (Dneck,p), distal neck diameter (Dneck,d), sac height (Hsac), neck height (Hneck), sac length (Lsac), neck length (Lneck), bulge height (Hb); (b) centroid distance at the maximum diameter (dc).68
Figure 5.

Model learned by a J48 decision tree, based on highest information gain; Lsac, length of AAA sac; S, surface area; T, tortuosity; , ratio of intraluminal thrombus volume to aneurysm sac volume.68
In addition to associating geometric features to rupture potential, five “geometric biomechanical factors” (deformation rate, asymmetry, saccular index, relative wall thickness, and growth rate) were recently combined to obtain a rupture risk qualitative indicator.98 This indicator was defined to monitor the evolution of patients with aneurysms by integrating geometric information obtained from periodic checkups in an effort to improve the accuracy of rupture risk assessment. Validation studies were performed on one clinical case and three cases obtained from the literature, and a broader study enrolling more patients is currently in progress. Results show that the deformation and growth rates influence the aneurysm rupture potential more than maximum diameter alone, and that a rupture risk qualitative indicator greater than 0.64 (nondimensional, based on the weighted averages of the five geometric biomechanical factors) indicates elective repair should be considered.
3. BIOMECHANICAL FACTORS
From a purely biomechanical viewpoint, aneurysm rupture occurs when the mechanical stress within the dilating inner wall exceeds the failure strength of the vascular tissue. Therefore, a criterion for repair based on quantifying AAA wall stress and strength could facilitate a better method to predict at-risk AAAs. Unfortunately, obtaining in vivo patient-specific measurements of tissue stresses or strength non-invasively is currently not feasible. However, mathematical and computational models that accurately compute wall stress can be utilized to evaluate the AAA biomechanical environment at the organ scale. Therefore, rupture risk biomechanical parameters can be evaluated as an alternative to the standard AAA size and expansion rate.51 Such an approach has been extensively applied as a solution for rupture risk assessment, as evident by the extent of the literature now summarized in Tables 1–4, which include some of the relevant and highly cited works in the field of solid mechanics and fluid-structure-interaction AAA analysis. We note that the isotropic hyperelastic material model proposed by Raghavan and Vorp64 has been used extensively in AAA numerical modeling.
3.1 Initial studies with idealized models
Early studies used the Law of Laplace to correlate AAA diameter and rupture.18 However, this approach ignores the complex aneurysm geometry and boundary conditions, as well as the presence of the ILT. In this regard, the calculation of peak wall stress by means of finite element analysis was first applied to a two dimensional AAA shape by Stringfellow et al.86 Their work showed that AAA models with the same diameter but different geometry had different wall stress, pointing to the importance of AAA shape and the shortfall of Laplace’s law even for an idealized approximation of complex geometries. This observation was also corroborated by others.25,39
3.2 Patient-specific AAA modeling
Fillinger et al27,29 showed the feasibility of using finite element analysis (FEA) for patient-specific wall stress calculations and reported statistically significant differences in peak stress for ruptured/symptomatic AAAs (46.8 N/cm2) in comparison with those electively repaired (38.1 N/cm2). They also demonstrated that maximum wall stress correlated more closely with risk of rupture than maximum diameter.27 In their study, wall stress was calculated by using FEA applied to a population of 103 patients, from which stress at a threshold of 44 N/cm2 had 94% sensitivity and 85% accuracy in predicting rupture, compared to 81% sensitivity and 73% accuracy with maximum diameter at a threshold of 5.5 cm. A similar study was undertaken by Venkatasubramaniam et al97 with 27 patients, from which 15 AAAs ruptured. They found that ruptured AAAs had significantly higher peak wall stress than non-ruptured AAAs (77 N/cm2 vs. 55 N/cm2). Both studies27,97 found a strong correlation between areas of high stress and the rupture site, based on quasi-static computational solid stress calculations applying a uniform intraluminal pressure directly on the wall. However, these findings were challenged by Georgakarakos et al.34 They found the location of peak wall stress may not necessarily coincide with the site of rupture. It was reasoned that the wall strength is also an important factor to be considered for rupture risk assessment.
3.2.1 Metrics for material failure criteria
A logical follow up to the aforementioned studies is to compare wall stress against tissue strength. Vande Geest et al92 proposed a statistical model involving local ILT thickness, normalized transverse diameter, gender and family history to non-invasively estimate wall strength. In their work, the Rupture Potential Index (RPI) was proposed as a metric to quantify risk based on the ratio of wall stress and wall strength. Recent work by Maier et al49 compared the efficacy of diameter, stress, and RPI to predict rupture. Maximum wall stress and maximum RPI were found to be high in symptomatic and ruptured cases compared to unruptured cases. An alternative approach in the field of hyperelasticity was proposed by Volokh99 based on the use of strain energy density as a failure criterion. Strain energy density is the product of stress and strain at a given location within a structure. Thus, this quantity takes into account both load (~ stress) and deformation (~ strain). As per this theory, it is assumed that the structure fails when at any given location the strain energy exceeds the threshold level specific of the material.
3.2.2 AAA material behavior and constitutive models
An accurate and reliable analysis of AAA biomechanics requires not only a precise three-dimensional description of the aneurysm geometry but also an appropriate constitutive law for the material. The first studies on AAA wall mechanics relied on hyperelastic isotropic models16,17,25,27,29,60,86,88,97 assuming an incompressible behavior for the arterial wall. Such models have limited accuracy for AAA stress analysis since ex vivo biaxial experiments on human AAA tissue conducted by Vande Geest et al93 demonstrated that the aneurysmal degeneration of the aorta leads to an increase in mechanical anisotropy, with the circumferential direction being the preferential stiffening direction. A number of anisotropic constitutive models have been proposed for AAA tissue,31,71,107 the implementation of which yields significantly higher peak wall stress in both idealized and patient-specific geometries.70,71,95 In this regard, anisotropic model results are more sensitive to geometric parameters such as symmetry and aneurysm length. A recent study conducted by Gasser et al30 indicates that ILT has a major impact on AAA biomechanics and rupture risk, and hence, needs to be considered in meaningful FE simulations. In addition, they also claim that inter-patient variability might reduce the importance of considering anisotropic behavior, whereas the geometry is the most critical property to be considered in a structural analysis.
3.2.3 Influence of ILT on peak wall stress
The role of intraluminal thrombus (ILT) on AAA growth and remodeling is significant as it has been suggested that ILT growth and volume may be related to AAA risk of rupture.85 ILT is found in most AAAs of clinically relevant size. A large ILT was found to be correlated with accelerated AAA growth rate but also reduced wall stress.101 Some studies have suggested that hypoxia of the AAA wall region covered by ILT causes degradation of the extracellular matrix and subsequent wall weakening, which is one of the precursors for aortic bulging.56,103 Nevertheless, inclusion of ILT introduces many complexities in FEA modeling if obtaining an accurate wall stress distribution is the ultimate objective. For example, ILT internal fissures can lead to unrealistic stress concentrations; this can also occur at a sudden change in cross-sectional area at the ILT-wall-lumen interface; ILT can act as a buffer leading to lower stresses in those regions where a thick ILT is present. Clinically, a crescent shaped blood diffusion zone inside ILT has been correlated with rupture.72
A reduced peak wall stress was found in patient-specific geometries when ILT is included in the FE model compared to the stress obtained using a wall-only model that ignores ILT.30,35,94,103 In an interesting experimental study that supports these findings, Thubrikar et al89 note that thrombus protects the aneurysm by diminishing and homogenizing strains on the aneurysm wall, although it does not restrict pressure transmission through it appreciably. A diameter matched approach was used by Gasser et al30 to emphasize the inclusion of ILT and to improve the differentiation between ruptured and non-ruptured aneurysms. However, there is still lack of consensus regarding the protective role of ILT. Despite ILT’s impact on aneurysm disease, from a biomechanics perspective, thrombus development and its relation to aneurysm rupture is still not clearly understood. Whether it increases or decreases the risk of aneurysm rupture is still subject to debate. For example, hemoglobin-rich ILT causes oxidative and proteolytic injury to the wall52 and thicker ILT regions cause localized hypoxia of the underlying wall,101 thereby weakening it; ILT internal fissures cause stress concentrations at the wall,59 while it also acts as a buffer against elevated wall stress.100
From a mechanical point of view, ILT is usually considered as a homogeneous, incompressible, hyperelastic solid.15,91,103 However, recent developments describe the ILT constitutive behavior using nonlinear viscoelasticity,91 an observation also supported by the recent work of Gasser and associates.30 In this work they also found ILT to be vulnerable against cyclic loads and showing significant decrease in strength as a function of the number of load cycles; this increases the likelihood of ILT failure and the consequent overstress of the AAA wall.59 Others have used local ILT wall thickness to model a reduction in wall strength.92 If indeed AAA geometry is the most important predictor of peak wall stress location, then the inclusion of ILT will lead to a more accurate spatial distribution of wall stress and a different spatially averaged wall stress (compared to wall-only models) without affecting significantly the statistical differences in peak wall stress. In a comparative analysis of large population groups, it is typically the statistical significance of the differences in peak wall stress of the groups that yields the assessment of rupture risk rather than the individual ILT-influenced peak wall stress estimations.
3.2.4 Influence of calcification
Most of AAAs exhibit localized calcifications in the tunica media, which have been taken into account recently for modeling of AAA biomechanics, leading to conflicting reports on whether the presence of calcification increases45,82 or decreases48 wall stress. There are challenges such as distinguishing calcification boundaries from lumen boundary during image segmentation and a 3D reconstruction becomes highly sensitive to this challenge given the relatively small size of the calcified regions compared to the extent of the lumen. Speelman et al82 modeled calcification implicitly by modifying the material property of the neighboring wall elements to account for the stiffer calcium content. Image mask operations were used by Maier et al48 to model the multi-domain geometry with calcification beneath the wall embedded in the ILT region, whereas Li et al45 modeled calcification embedded within the wall itself. Owing to the relatively thin AAA wall, such subtle differences in the modeling approaches are likely to yield significantly different wall stress estimations. In addition, constitutive material property models are scarce for calcification in the abdominal aorta.45
3.2.5 Influence of the initial AAA configuration
Most computational models used for AAA finite element analysis are typically generated from multiple CT images acquired at one instant (gated) or multiple instants within the cardiac cycle, hence these models do not correspond to the geometry of the aorta in the unloaded state or at zero internal pressure. Thus, the application of a physiological pressure boundary condition to these pre-deformed geometries may have a significant effect on the wall stress distribution. Ideally, the boundary condition should be applied to either the unloaded geometry or a prestressed geometry to obtain physiologically realistic stresses.
A number of numerical techniques have been developed to recover the approximate zero pressure configuration of an aneurysm.14,46,62,83 These conclude that not accounting for the zero pressure configuration may lead to an overestimation of the maximum peak wall stress. The presence of the ILT has been neglected in these models and the AAA modeled as an isotropic material. Instead of focusing on the zero pressure geometry, the initial stress was estimated by Gee et al32 using a modified updated Lagrangian formulation while Hsu and Bazilevs38 used an additive decomposition of the second Piola-Kirchoff stress tensor. A simulation based on the diastolic geometry without prestress consideration tends to overinflate the artery resulting in a significant difference in wall shear stress and wall tension.38 In our laboratory, a new algorithm has been developed for zero pressure geometry estimation and applied to patient-specific AAA models that include ILT and regional variations of wall thickness.11 Our two stage algorithm is designed to utilize the finite element mesh of an image based model (representing the geometry at diastolic pressure) and the outcome of FEA or FSI simulations for deriving the zero pressure geometry. In the first stage, the algorithm develops an initial approximation of the zero pressure geometry by extrapolating the nodal displacements of the outer wall mesh. In the second stage, a fixed point iterative algorithm is implemented to make incremental corrections to the nodal coordinates to minimize the error between the pressurized (at diastolic pressure) zero pressure geometry and the CT image based geometry. We tested this algorithm on three patient-specific models and were successful in deriving the zero pressure geometry in 5–9 iterations. Additional FEA simulations with peak systolic pressure were performed with the CT image based and zero pressure geometries of the three AAA models, and the displacements and stresses compared (as shown in Fig. 6). Assuming a nonlinear isotropic material for both the wall and the ILT, these results indicate that not accounting for the unloaded configuration may overestimate the maximum displacement of the AAA wall and underestimate the peak wall stress by as much as 20%.
Figure 6.

Displacement and stress distribution in three patient-specific geometries for both the CT image based analysis and the zero pressure configuration. Analysis based on the zero pressure configuration yielded a larger peak wall stress (reproduced from unpublished data).
Noteworthy is how an algorithm arrives at the geometry at zero pressure using the reference diastolic geometry. In particular, how the saddle shaped curvature regions are handled during this process may influence the ensuing maximum stress. Observing that local displacements are found to increase with the local characteristic radial distance and are less sensitive to local surface curvature66 may be helpful when assessing the relative errors in implementation of zero pressure algorithms. In addition, it is desirable to use clinical images acquired at diastole using ECG gating rather than randomly acquired during the cardiac cycle and patient-specific diastolic blood pressure to increase the predictive accuracy of the algorithm.
3.2.6 Effect of blood flow
Most of the AAA wall stress calculations have been obtained from structural models by applying a uniform pressure on the inner surface of the aneurysm sac. The limitation of this approach is that the hemodynamics of blood flow through the aneurysm and the compliant nature of the AAA wall are not accounted for. One of the pioneering works that account for the effect of blood flow on the AAA peak wall stress was conducted by Di Martino et al.17 Their fluid-structure interaction (FSI) analysis of a realistic aneurysmatic aorta showed that the complex hemodynamics considerably affects the stress distribution, but also reported on the cushioning effect of ILT on the wall. However, in their work, the wall and ILT were considered linearly elastic materials. The nonlinear behavior of the wall and ILT as well as more complex pulsatile flow conditions were modeled in a series of studies conducted by Scotti et al,74–76 which demonstrated the importance of considering the nonlinear elastic behavior of the structural domain. Moreover, the comparative study between FSI (coupled and decoupled) and structural analysis of patient-specific AAA performed by Scotti et al75 show that the non-uniform pressure distribution on the inner AA surface due to the flow yielded a maximum peak wall stress up to 20% higher compared to that obtained with a static FEA when a uniform systolic pressure of 117 mmHg is applied. In these studies it is concluded that FSI analysis has the potential to capture the fluid dynamics inside a complex AAA structure accurately and hence is a better approach for calculating wall stress and studying rupture risk. Leung et al44 also compared the stresses obtained from an FSI model and an FEA model, and reported that the combination of pulsatile fluid flow and a compliant wall can change the local stresses slightly but has a negligible effect on the peak wall stress. However, they created the wall domain by offsetting the lumen boundary, thereby ignoring ILT in the model, which therefore affected both the wall geometry as well as its mechanical contribution to the ensuing mechanics. One of the main conclusions that can be derived from these studies is that using a non-uniform pressure distribution on the AAA sac can substantially improve the accuracy of the structural analysis thereby avoiding a computationally extensive FSI analysis for assessing AAA rupture risk. Similar findings were reported by others using idealized and patient-specific geometries.41,42,57
A recent study by Chandra et al10 demonstrates the effect of MRI derived inlet flow boundary conditions on AAA FSI modeling with ILT. The objective was to identify the effect of different inlet velocity distributions (Vwom: Womersley velocity profile, Vz: profile with longitudinal velocity component, Vxyz: profile with inclusion of all velocity components) on the computational assessment of stress and strain, and further draw comparisons with structural only (FEA) simulations. The study revealed that the contribution of the MRI derived longitudinal velocity component is significant in comparison to the in-plane components at the model inlet, and that a Womersley velocity profile leads to underestimation of wall stress. A comparison between fully coupled FSI, decoupled FSI, and transient FEA simulations revealed that the wall stress and strain distributions are largely influenced by the inclusion of the flow dynamics, as FEA underestimates both peak wall stress and strain. Further, the study demonstrates that peak stress and strain are not achieved at peak systolic pressure (see Fig. 7), therefore structural only simulations are inadequate for an accurate assessment of AAA biomechanics. The influence of material anisotropy in FSI simulations has been investigated by Rissland et al69 and Xenos et al.106 In their work, Rissland and colleagues introduced a new anisotropic material model of the AAA wall to perform FSI simulations of patient-specific AAA geometries to develop a more reliable predictor for the risk of rupture. With the ILT still modeled as a linearly elastic compressible material, these studies indicate that isotropic wall material properties yield a lower peak wall stress compared to anisotropic wall properties, resulting in an underestimation of the rupture risk.
Figure 7.

Maximum and average principal stress and strain waveforms for a patient-specific AAA obtained using direct FSI, uncoupled FSI, and transient FEA. The stress and strain follow the inlet velocity waveform rather than the pressure waveform boundary condition (reproduced from unpublished data).
4. MODELING CONSIDERATIONS AND RECOMMENDATIONS
If not performed accurately, numerical modeling can mislead AAA clinical management and pre-surgical planning recommendations. The following is an overview of the importance of computer aided analysis and its different stakeholders in AAA rupture risk assessment.
4.1 On the rationale for high stress and saddle shape correlation
AAA wall stress is typically maximum at a location that features the combined effects of large diameter and a local surface saddle point (i.e., a wall surface region that has local concavity when traversed along one direction and local convexity when traversed in a relatively perpendicular direction along the surface). The rationale for such behavior, under the assumption of a uniform wall thickness, can be explained by considering the schematic of Fig. 8. Consider two points A and B. A is located at a locally convex region in almost any plane passing through A. B is locally convex when a section cut by horizontal plane passing through B is considered; however, B is also locally concave when a section cut by vertical plane is considered, i.e. B represents a local saddle point. Consider a small region of wall near A and B isolated in space and forces acting on it as shown in Fig. 8. The in-plane forces (membrane forces) acting on this small region longitudinally have a component in the radial direction that augments the radially outward normal force acting from inside the AAA sac at point B. Hence, to maintain force equilibrium along the radial direction there is an increased demand on the membrane forces at B in the horizontal plane since those have a radially inward component acting on the small region under consideration. This scenario results in a higher wall stress. On the other hand, in-plane membrane forces in the vertical direction at A ease the load in the horizontal plane because of their radially inward component acting against the normal force. Thus higher stresses result from a combined and favorable action of local in-plane forces. Hence, stresses are also dependent on size since in-plane membrane stresses are simply dependent on the local diameter. Therefore, it is the combination of the local transverse dimension and local curvature that govern the wall stress distribution under the assumption that the wall thickness is uniform. This underscores the importance of quantifying accurately and non-invasively the individual AAA surface geometry and, evidently, regional variations of wall thickness from existing clinical imaging modalities, to obtain an accurate wall stress prediction.
Figure 8.

Rationale behind high stresses in saddle shaped surface region; (a) Typical stress distribution obtained by FE analysis under a uniform wall thickness assumption a cut section showing high stresses in the saddle shaped region; (b) Schematic with force directions explaining rationale behind saddle shape and high stress correlation.
4.2 On image based geometry reconstruction
It is evident that AAA geometry, especially its characterization by means of surface curvature and regionally varying wall thickness has a remarkable influence on computed biomechanical parameters such as stresses and strains. Consequently, the need for an accurate and realistic image based 3D reconstruction is emphasized in this work as a research opportunity. Some open questions remain in this regard, e.g. what is the extent of the error the image resolution introduces in the ensuing wall mechanics? Can it be ignored when performing numerical modeling? How is the accuracy of the 3D reconstruction affected by the unequal spacing of the image data originated from the in-plane resolution (pixel size) being small compared to the out-of-plane resolution (slice spacing)? Does the use of different image processing filters introduce additional uncertainty in the AAA geometry reconstruction? How much smoothing makes the reconstructed anatomy “smooth enough”? What is an appropriate metric to quantify smoothing-induced distortion of the geometry? Many of these questions arise in biomechanics modeling and are left either unanswered or as an end user’s judgment call, but can be addressed by quantifying inter-operator and intra-operator variations in the repeatability of 3D reconstructions. Our recent work66 suggests that the sensitivity of linear tessellated surface representations toward smoothness-induced distortion caused by common Laplace and Taubin smoothing algorithms is higher for vessel regions with high curvature and larger element size. This implies that while the smoothing iterations are applied uniformly to the geometry, the ensuing changes in the surface are non-uniform and vary regionally.
4.3 On convergence assessment
The field of computational biomechanics has remarkable implications in the clinical management of vascular disease; however, it is important to understand the responsible use of the tools generated by researchers for this purpose. With accessibility to these tools, both in terms of software availability and hardware capabilities, a plethora of results without substantial thought on the proper setup of the simulations may attenuate the importance of the tools. Appropriate conventions and codes may be established in the near future for computational biomechanics similar to the ASTM international standards; such aspect is covered in more detail by Erdemir et al.26 To this end, an analysis of numerical convergence poses a challenge for patient-specific modeling. There is no unique guideline that indicates the need to evaluate specifically stress or displacement or wall shear stress, etc., for convergence assessment. In biomedical applications, as the mesh element size is reduced, achieving convergence of the numerical solution to the governing equations, may not yield geometric accuracy (under the assumption of a consistent mesh quality during the mesh refinement process), making it difficult to arrive at some standard protocol. Ideally, a mesh refined for numerical convergence should be embedded within a coarser mesh,6 which is intricate to achieve in patient-specific modeling due to limitations related to high computational costs and parallelization of the solvers. For example, the number of elements in a hexahedral mesh would increase 8–27 times for a single step of isotropic refinement. Another problem of importance is the consideration given to the spatial location of the variables probed for convergence. In the case of patient-specific blood vessels with branches and bifurcations, it is not simple to define the probing location for different mesh resolutions due to the lack of mathematical equations that can define the tessellated geometry with precision. Preferably, mesh independence should be performed for each simulation; however, at least one reference mesh independence study should be completed for each combination of simulations parameters per patient-specific geometry.
4.4 On factors affecting wall mechanics
Computational assessment of wall mechanics is dependent on many factors, as shown previously in Fig. 2. Improved image segmentation algorithms are needed as current strategies do an inadequate job in identifying small features that have an impact on the wall mechanics, e.g. the inner wall boundary, extent of the calcified regions, etc. There are user dependent controls during 3D reconstruction such as image filters, morphological operation sequences, and mesh smoothing, for which there is no standard protocol to follow particularly in multi-domain vessel structures. Attempts to address inter-operator and intra-operator variability could improve reliability of these controls.37,78 The use of shell vs. tetrahedral meshes and the inclusion of ILT were addressed by Doyle et al;20 however, additional work is warranted by evaluating other features in AAA mechanics such as the geometry of the aorto-iliac bifurcation, patient-specific material properties, smoothness of the multi-domain interfaces, etc. Investigations such as the one reported by Doyle and colleagues,21 which verify computational techniques against experimental measurements or, alternatively, a peer-to-peer comparison of results for a common test problem that closely imitates the physiological environment should be encouraged as it would bring more credibility for computational biomechanics among the medical community. Moreover, the absence of a method for non-invasive, in vivo assessment of intraluminal pressure waveforms often leads to the use of simplified boundary conditions in the computational simulations. For patient-specific AAA rupture risk assessment, it would appear necessary to estimate the individual constitutive material properties of the vascular wall by means of nondestructive, in vivo methods as the aorta grows and remodels. This would lead to an unprecedented AAA multi-scale modeling approach, which would entail spatio-temporal variations of the wall mechanical properties as a function of the contributing cellular and subcellular components of the media and adventitia. Nevertheless, if the time rate of change of peak wall stress with respect to a baseline configuration (e.g., at the initial diagnosis of the AAA) is ultimately the sought-after biomechanical parameter that largely influences the rupture potential of an aneurysm, will complex growth and remodeling constitutive models lead to an increased accuracy in rupture risk assessment? In our laboratory, we have hypothesized that wall stress is largely influenced by the AAA shape and to a lesser extent by the constitutive material model used to represent the wall tissue properties. As wall stress computation is the result of force equilibrium equations, regionally-varying growth and remodeling constitutive models would presumably also play a limited role in the ensuing wall stresses compared to the driving time-course, evolving aneurysm shape. To this end, geometry reconstruction has a profound influence on the wall mechanics and hence preprocessing steps such as image segmentation, 3D reconstruction, and meshing require careful consideration.1,3,66
Other important factors remain relatively unexplored as it relates to AAA wall stress estimation. First, the measurement and implementation of patient-specific non-uniform thickness of the arterial wall is a complex task, due primarily to limitations in the current technology to measure this parameter non-invasively. Patient-specific wall thickness variations based on ILT covered and uncovered regions of the wall30 and truly image-derived variable wall thickness66,67 have been implemented recently. Second is our limited knowledge regarding in vivo material property characterization, which will require in vivo intraluminal pressure measurement and 3D strain estimation. In this regard, 4D CT/MR images have been used to assess blood vessel deformation.4,24,54 Recent work by Tierney et al90 evaluates 2D strains in AAA cross sections and our own laboratory has contributed to 3D strain calculations using ECG gated MR images.66 Consideration given to material properties subject to growth and remodeling (G&R theory)5,104,105 remains an open research opportunity.
4.5 Clinical perspective
A computational tool that can calculate the regional and time-course variations of local surface curvatures automatically from segmented clinical images on the same day of AAA diagnosis or follow-up would be a resource with great translational potential in the vascular clinic. In our laboratory, local curvatures are believed to be the most important predictors of wall stress, which can be computed using membrane equilibrium equations on a patient-specific basis without the need to perform FEA (which would require specifying tissue material properties). Such a tool would need prior validation using a thorough biomechanics based approach to gain credibility in the medical community. Nevertheless, the comparative analysis of the various types of AAA (surveillance, electively repaired, symptomatic, and ruptured) by means of non-invasive, regional surface curvature quantification should yield the necessary metrics for rupture risk assessment without the need to derive population-based or individual constitutive material models.
Table 2.
Literature review summary - solid mechanics AAA modeling – Part 1 (Please refer to Table 1 for abbreviations used.)
| First Author (year) | Focus | PS/I | Cases | Reconstruction Strategy | Bifur | ILT | Ca | FEA Solver | Pressure | Residual Stress | Element Type | Material Model |
|---|---|---|---|---|---|---|---|---|---|---|---|---|
| Fillinger (2003) | Rupture risk vs Max Dia | PS | 103 | PC, Decimation, SS | Y | N | N | ABAQUS | PS | N | S3 (?) | HE 59 |
| Raghavan (2000) | Patient specific AAA analysis | PS | 7 | PC, Decimation, SS | N | N | N | ANSYS | PS | N | S4 | HE 59 |
| Fillinger (2002) | Wall stress and rupture risk | PS | 48 | PC, Decimation, SS | Y | N | N | ABAQUS | PS | N | S3 (?) | HE 59 |
| Vorp (1998) | Geometry effect | I | 10 | GC-circle | N | N | N | ANSYS | 120 mmHg | N | S4 | E-5 MPa |
| Wang (2002) | ILT effect | PS | 4 | PC, decimation, SS, 3D Solid (Pro-E), Wall by extrusion const thk, PATRAN for meshing | N | Y | N | ABAQUS | PS | N | Tet-10 | HE 59 |
| Venkasubramaniam (2004) | rupture Vs non-rupture using PWS | PS | 27 | PC, Rhino Surface | N | N | N | ANSYS | 120 mmHg | N | S6 | HE 59 |
| Inzoli (1993) | PWS and ILT | I | 1 | Axisym 2D | N | Y | N | BRAVO3 | 120 mmHg | N | Quad-04 | E-2 MPa |
| Di Martino (1998) | ILT effect on AAA biomechanics (Expt+Sim) | I | 1 | 2D, plane stress | N | Y | N | Patran | 120 mmHg | N | Quad-04 | E, HE |
| Elger (1996) | Shape and PWS | I | 1 | 2D axisym | N | N | N | Analytical membrane theory | parameter | N | No FEM | E |
Table 3.
Literature review summary - solid mechanics AAA modeling – Part 2 (Please refer to Table 1 for abbreviations used.)
| First Author (year) | Focus | PS/I | Cases | Reconstruction Strategy | Bifur | ILT | Ca | FEA Solver | Pressure | Residual Stress | Element Type | Material Model |
|---|---|---|---|---|---|---|---|---|---|---|---|---|
| Stringfellow (1987) | PWS and geometry | I | 2 | Cyl and Sphere | N | N | N | Nastran | 100 mmHg | N | Hex-08 | E-3 MPa |
| Di Martino (2003) | Effect of ILT mat. prop. variation | I | 1 | Bell Curve Shaped | N | Y | N | ABAQUS | 120 mmHg | N | Hex-08 | HE |
| Speelman (2007) | Ca effect on AAA biomechanics | PS | 6 | ? | N | Y | Y | ABAQUS | 16 kPa | N | Quad-04 | HE - 59 |
| Truijers (2007) | PWS | PS | 30 | PC, decimation, SS Gaussian variation | N | N | N | ABAQUS | PS | N | S3 (?) | HE - 59 |
| Rodriguez (2008) | Diameter, asym. and mat. Prop. | I | 1 | in Diameter and location of center | N | N | N | ABAQUS | 16 KPa | N | Hex-08 | HE , HEaniso |
| Doyle (2007) | Comparison of Modeling techniques | I | 3 | Marching Cube (Mimics) | N | Y | N | ABAQUS | 120 mmHg | N | S3 | E-4.66 MPa, HE 59 |
| Li (2008) | ILT and Ca effect on AAA biomechanics | PS | 20 | Marching Cube (Simpleware) | Y | Y | Y | ABAQUS | AvgSys | N | Tet-4 (?) | HE - 59 |
| Doyle (2009) | Vessel asym. as diagnostic tool | PS | 15 | Marching Cube (Mimics) | N | N | N | ABAQUS | 120 mmHg | N | S3 (?) | HE - 59 |
| Heng (2008) | PWS in rAAA and eAAA | PS | 70 | PC, Rhino Surface | N | N | N | ANSYS | PS | N | S8 | HE - 59 |
Acknowledgments
The authors would like to acknowledge research funding from NIH Grants R21EB007651, R15HL087268, and R21EB008804. The content is solely the responsibility of the authors and does not necessarily represent the official views of the National Institutes of Health. We are also thankful to Dr. Satish Muluk of the Western Pennsylvania Allegheny Health System for his insightful discussions on clinical management of vascular disease and peri-operative AAA risk factors.
References
- 1.Antiga L, Piccinelli M, Botti L, Ene-Iordache B, Remuzzi A, Steinman DA. An image-based modeling framework for patient-specific computational hemodynamics. Med Biol Eng Comput. 2008;46:1097–1112. doi: 10.1007/s11517-008-0420-1. [DOI] [PubMed] [Google Scholar]
- 2.Ashton JH, Geest JPV, Simon BR, Haskett DG. Compressive mechanical properties of the intraluminal thrombus in abdominal aortic aneurysms and fibrin-based thrombus mimics. Journal of Biomechanics. 2009;42:197–201. doi: 10.1016/j.jbiomech.2008.10.024. [DOI] [PMC free article] [PubMed] [Google Scholar]
- 3.Auer M, Gasser TC. Reconstruction and finite element mesh generation of abdominal aortic aneurysms from computerized tomography angiography data with minimal user interactions. IEEE Trans Med Imaging. 2010;29:1022–1028. doi: 10.1109/TMI.2009.2039579. [DOI] [PubMed] [Google Scholar]
- 4.Avril S, Schneider F, Boissier C, Li ZY. In vivo velocity vector imaging and time-resolved strain rate measurements in the wall of blood vessels using MRI. J Biomech. 2011;44:979–983. doi: 10.1016/j.jbiomech.2010.12.010. [DOI] [PubMed] [Google Scholar]
- 5.Baek S, Rajagopal KR, Humphrey JD. A theoretical model of enlarging intracranial fusiform aneurysms. J Biomech Eng. 2006;128:142–149. doi: 10.1115/1.2132374. [DOI] [PubMed] [Google Scholar]
- 6.Bathe K-JR. Finite element procedures. Prentice Hall; 1996. [Google Scholar]
- 7.Brown LC, Epstein D, Manca A, Beard JD, Powell JT, Greenhalgh RM. The UK Endovascular Aneurysm Repair (EVAR) trials: design, methodology and progress. Eur J Vasc Endovasc Surg. 2004;27:372–381. doi: 10.1016/j.ejvs.2003.12.019. [DOI] [PubMed] [Google Scholar]
- 8.Brown LC, Powell JT. Risk factors for aneurysm rupture in patients kept under ultrasound surveillance. UK Small Aneurysm Trial Participants. Ann Surg. 1999;230:289–296. doi: 10.1097/00000658-199909000-00002. discussion 296–287. [DOI] [PMC free article] [PubMed] [Google Scholar]
- 9.Chaikof EL, Brewster DC, Dalman RL, Makaroun MS, Illig KA, Sicard GA, Timaran CH, Upchurch GR, Jr, Veith FJ S. Society for Vascular. . The care of patients with an abdominal aortic aneurysm: the Society for Vascular Surgery practice guidelines. J Vasc Surg. 2009;50:S2–49. doi: 10.1016/j.jvs.2009.07.002. [DOI] [PubMed] [Google Scholar]
- 10.Chandra S, Raut SS, Jana A, Beiderman R, Doyle M, Muluk SC, Finol EA. Fluid-structure interaction modeling of abdominal aortic aneurysms: the impact of patient specific inflow conditions and fluid/solid coupling. J Biomech Eng. doi: 10.1115/1.4024275. (submitted) [DOI] [PMC free article] [PubMed] [Google Scholar]
- 11.Chandra S, Rodriguez J, Finol EA. Methodology for the derivation of unloaded vascular geometry with hyperelastic isotropic tissue properties. J Biomech. (submitted) [Google Scholar]
- 12.Choke E, Cockerill G, Wilson WR, Sayed S, Dawson J, Loftus I, Thompson MM. A review of biological factors implicated in abdominal aortic aneurysm rupture. Eur J Vasc Endovasc Surg. 2005;30:227–244. doi: 10.1016/j.ejvs.2005.03.009. [DOI] [PubMed] [Google Scholar]
- 13.Darling RC, Messina CR, Brewster DC, Ottinger LW. Autopsy study of unoperated abdominal aortic aneurysms. The case for early resection. Circulation. 1977;56:II161–164. [PubMed] [Google Scholar]
- 14.de Putter S, Wolters BJ, Rutten MC, Breeuwer M, Gerritsen FA, van de Vosse FN. Patient-specific initial wall stress in abdominal aortic aneurysms with a backward incremental method. J Biomech. 2007;40:1081–1090. doi: 10.1016/j.jbiomech.2006.04.019. [DOI] [PubMed] [Google Scholar]
- 15.Di Martino E, Mantero S, Inzoli F, Melissano G, Astore D, Chiesa R, Fumero R. Biomechanics of abdominal aortic aneurysm in the presence of endoluminal thrombus: experimental characterisation and structural static computational analysis. Eur J Vasc Endovasc Surg. 1998;15:290–299. doi: 10.1016/s1078-5884(98)80031-2. [DOI] [PubMed] [Google Scholar]
- 16.Di Martino ES, Bohra A, Vande Geest JP, Gupta N, Makaroun MS, Vorp DA. Biomechanical properties of ruptured versus electively repaired abdominal aortic aneurysm wall tissue. J Vasc Surg. 2006;43:570–576. doi: 10.1016/j.jvs.2005.10.072. discussion 576. [DOI] [PubMed] [Google Scholar]
- 17.Di Martino ES, Guadagni G, Fumero A, Ballerini G, Spirito R, Biglioli P, Redaelli A. Fluid-structure interaction within realistic three-dimensional models of the aneurysmatic aorta as a guidance to assess the risk of rupture of the aneurysm. Med Eng Phys. 2001;23:647–655. doi: 10.1016/s1350-4533(01)00093-5. [DOI] [PubMed] [Google Scholar]
- 18.Dobrin PB. Pathophysiology and pathogenesis of aortic aneurysms. Current concepts. The Surgical clinics of North America. 1989;69:687–703. doi: 10.1016/s0039-6109(16)44876-0. [DOI] [PubMed] [Google Scholar]
- 19.Doyle BJ, Callanan A, Burke PE, Grace PA, Walsh MT, Vorp DA, McGloughlin TM. Vessel asymmetry as an additional diagnostic tool in the assessment of abdominal aortic aneurysms. J Vasc Surg. 2009;49:443–454. doi: 10.1016/j.jvs.2008.08.064. [DOI] [PMC free article] [PubMed] [Google Scholar]
- 20.Doyle BJ, Callanan A, McGloughlin TM. A comparison of modelling techniques for computing wall stress in abdominal aortic aneurysms. Biomedical engineering online. 2007;6:38. doi: 10.1186/1475-925X-6-38. [DOI] [PMC free article] [PubMed] [Google Scholar]
- 21.Doyle BJ, Cloonan AJ, Walsh MT, Vorp DA, McGloughlin TM. Identification of rupture locations in patient-specific abdominal aortic aneurysms using experimental and computational techniques. J Biomech. 2010;43:1408–1416. doi: 10.1016/j.jbiomech.2009.09.057. [DOI] [PMC free article] [PubMed] [Google Scholar]
- 22.Doyle BJ, Grace PA, Kavanagh EG, Burke PE, Wallis F, Walsh MT, McGloughlin TM. Improved assessment and treatment of abdominal aortic aneurysms: the use of 3D reconstructions as a surgical guidance tool in endovascular repair. Ir J Med Sci. 2009;178:321–328. doi: 10.1007/s11845-009-0318-4. [DOI] [PubMed] [Google Scholar]
- 23.Doyle BJ, Molony DS, Walsh MT, McGloughlin TM. Abdominal Aortic Aneurysms: New Approaches to Rupture Risk Assessment. Nova Science Publishers; 2010. [Google Scholar]
- 24.Draney MT, Herfkens RJ, Hughes TJ, Pelc NJ, Wedding KL, Zarins CK, Taylor CA. Quantification of vessel wall cyclic strain using cine phase contrast magnetic resonance imaging. Ann Biomed Eng. 2002;30:1033–1045. doi: 10.1114/1.1513566. [DOI] [PubMed] [Google Scholar]
- 25.Elger DF, Blackketter DM, Budwig RS, Johansen KH. The influence of shape on the stresses in model abdominal aortic aneurysms. J Biomech Eng. 1996;118:326–332. doi: 10.1115/1.2796014. [DOI] [PubMed] [Google Scholar]
- 26.Erdemir A, Guess TM, Halloran J, Tadepalli SC, Morrison TM. Considerations for reporting finite element analysis studies in biomechanics. J Biomech. 2012;45:625–633. doi: 10.1016/j.jbiomech.2011.11.038. [DOI] [PMC free article] [PubMed] [Google Scholar]
- 27.Fillinger MF, Marra SP, Raghavan ML, Kennedy FE. Prediction of rupture risk in abdominal aortic aneurysm during observation: wall stress versus diameter. J Vasc Surg. 2003;37:724–732. doi: 10.1067/mva.2003.213. [DOI] [PubMed] [Google Scholar]
- 28.Fillinger MF, Racusin J, Baker RK, Cronenwett JL, Teutelink A, Schermerhorn ML, Zwolak RM, Powell RJ, Walsh DB, Rzucidlo EM. Anatomic characteristics of ruptured abdominal aortic aneurysm on conventional CT scans: Implications for rupture risk. J Vasc Surg. 2004;39:1243–1252. doi: 10.1016/j.jvs.2004.02.025. [DOI] [PubMed] [Google Scholar]
- 29.Fillinger MF, Raghavan ML, Marra SP, Cronenwett JL, Kennedy FE. In vivo analysis of mechanical wall stress and abdominal aortic aneurysm rupture risk. J Vasc Surg. 2002;36:589–597. doi: 10.1067/mva.2002.125478. [DOI] [PubMed] [Google Scholar]
- 30.Gasser TC, Auer M, Labruto F, Swedenborg J, Roy J. Biomechanical rupture risk assessment of abdominal aortic aneurysms: model complexity versus predictability of finite element simulations. Eur J Vasc Endovasc Surg. 2010;40:176–185. doi: 10.1016/j.ejvs.2010.04.003. [DOI] [PubMed] [Google Scholar]
- 31.Gasser TC, Ogden RW, Holzapfel GA. Hyperelastic modelling of arterial layers with distributed collagen fibre orientations. Journal of the Royal Society, Interface / the Royal Society. 2006;3:15–35. doi: 10.1098/rsif.2005.0073. [DOI] [PMC free article] [PubMed] [Google Scholar]
- 32.Gee MW, Reeps C, Eckstein HH, Wall WA. Prestressing in finite deformation abdominal aortic aneurysm simulation. J Biomech. 2009;42:1732–1739. doi: 10.1016/j.jbiomech.2009.04.016. [DOI] [PubMed] [Google Scholar]
- 33.Georgakarakos E, Ioannou CV, Kamarianakis Y, Papaharilaou Y, Kostas T, Manousaki E, Katsamouris AN. The role of geometric parameters in the prediction of abdominal aortic aneurysm wall stress. Eur J Vasc Endovasc Surg. 2010;39:42–48. doi: 10.1016/j.ejvs.2009.09.026. [DOI] [PubMed] [Google Scholar]
- 34.Georgakarakos E, Ioannou CV, Papaharilaou Y, Kostas T, Tsetis D, Katsamouris AN. Peak wall stress does not necessarily predict the location of rupture in abdominal aortic aneurysms. Eur J Vasc Endovasc Surg. 2010;39:302–304. doi: 10.1016/j.ejvs.2009.11.021. [DOI] [PubMed] [Google Scholar]
- 35.Georgakarakos E, Ioannou CV, Volanis S, Papaharilaou Y, Ekaterinaris J, Katsamouris AN. The influence of intraluminal thrombus on abdominal aortic aneurysm wall stress. Int Angiol. 2009;28:325–333. [PubMed] [Google Scholar]
- 36.Giannoglou G, Giannakoulas G, Soulis J, Chatzizisis Y, Perdikides T, Melas N, Parcharidis G, Louridas G. Predicting the risk of rupture of abdominal aortic aneurysms by utilizing various geometrical parameters: revisiting the diameter criterion. Angiology. 2006;57:487–494. doi: 10.1177/0003319706290741. [DOI] [PubMed] [Google Scholar]
- 37.Heng MS, Fagan MJ, Collier JW, Desai G, McCollum PT, Chetter IC. Peak wall stress measurement in elective and acute abdominal aortic aneurysms. J Vasc Surg. 2008;47:17–22. doi: 10.1016/j.jvs.2007.09.002. discussion 22. [DOI] [PubMed] [Google Scholar]
- 38.Hsu MC, Bazilevs Y. Blood vessel tissue prestress modeling for vascular fluid-structure interaction simulation. Finite Elem Anal Des. 2011;47:593–599. [Google Scholar]
- 39.Inzoli F, Boschetti F, Zappa M, Longo T, Fumero R. Biomechanical factors in abdominal aortic aneurysm rupture. Eur J Vasc Surg. 1993;7:667–674. doi: 10.1016/s0950-821x(05)80714-5. [DOI] [PubMed] [Google Scholar]
- 40.Kazi M, Thyberg J, Religa P, Roy J, Eriksson P, Hedin U, Swedenborg J. Influence of intraluminal thrombus on structural and cellular composition of abdominal aortic aneurysm wall. J Vasc Surg. 2003;38:1283–1292. doi: 10.1016/s0741-5214(03)00791-2. [DOI] [PubMed] [Google Scholar]
- 41.Khanafer KM, Bull JL, Berguer R. Fluid-structure interaction of turbulent pulsatile flow within a flexible wall axisymmetric aortic aneurysm model. Eur J Mech B-Fluid. 2009;28:88–102. [Google Scholar]
- 42.Kim YH, Kim JE, Ito Y, Shih AM, Brott B, Anayiotos A. Hemodynamic analysis of a compliant femoral artery bifurcation model using a fluid structure interaction framework. Ann Biomed Eng. 2008;36:1753–1763. doi: 10.1007/s10439-008-9558-0. [DOI] [PubMed] [Google Scholar]
- 43.Lederle FA, Johnson GR, Wilson SE, Ballard DJ, Jordan WD, Jr, Blebea J, Littooy FN, Freischlag JA, Bandyk D, Rapp JH, Salam AA, Veterans I Affairs Cooperative Study. Rupture rate of large abdominal aortic aneurysms in patients refusing or unfit for elective repair. JAMA : the journal of the American Medical Association. 2002;287:2968–2972. doi: 10.1001/jama.287.22.2968. [DOI] [PubMed] [Google Scholar]
- 44.Leung JH, Wright AR, Cheshire N, Crane J, Thom SA, Hughes AD, Xu Y. Fluid structure interaction of patient specific abdominal aortic aneurysms: a comparison with solid stress models. Biomedical engineering online. 2006;5:33. doi: 10.1186/1475-925X-5-33. [DOI] [PMC free article] [PubMed] [Google Scholar]
- 45.Li ZY, U-King-Im J, Tang TY, Soh E, See TC, Gillard JH. Impact of calcification and intraluminal thrombus on the computed wall stresses of abdominal aortic aneurysm. J Vasc Surg. 2008;47:928–935. doi: 10.1016/j.jvs.2008.01.006. [DOI] [PubMed] [Google Scholar]
- 46.Lu J, Zhou X, Raghavan ML. Inverse elastostatic stress analysis in pre-deformed biological structures: Demonstration using abdominal aortic aneurysms. J Biomech. 2007;40:693–696. doi: 10.1016/j.jbiomech.2006.01.015. [DOI] [PubMed] [Google Scholar]
- 47.Ma B, Harbaugh RE, Raghavan ML. Three-dimensional geometrical characterization of cerebral aneurysms. Ann Biomed Eng. 2004;32:264–273. doi: 10.1023/b:abme.0000012746.31343.92. [DOI] [PubMed] [Google Scholar]
- 48.Maier A, Gee MW, Reeps C, Eckstein HH, Wall WA. Impact of calcifications on patient-specific wall stress analysis of abdominal aortic aneurysms. Biomech Model Mechanobiol. 2010;9:511–521. doi: 10.1007/s10237-010-0191-0. [DOI] [PubMed] [Google Scholar]
- 49.Maier A, Gee MW, Reeps C, Pongratz J, Eckstein HH, Wall WA. A comparison of diameter, wall stress, and rupture potential index for abdominal aortic aneurysm rupture risk prediction. Ann Biomed Eng. 2010;38:3124–3134. doi: 10.1007/s10439-010-0067-6. [DOI] [PubMed] [Google Scholar]
- 50.Martufi G, Di Martino ES, Amon CH, Muluk SC, Finol EA. Three-dimensional geometrical characterization of abdominal aortic aneurysms: image-based wall thickness distribution. J Biomech Eng. 2009;131:061015. doi: 10.1115/1.3127256. [DOI] [PubMed] [Google Scholar]
- 51.McGloughlin TM, Doyle BJ. New approaches to abdominal aortic aneurysm rupture risk assessment: engineering insights with clinical gain. Arterioscler Thromb Vasc Biol. 2010;30:1687–1694. doi: 10.1161/ATVBAHA.110.204529. [DOI] [PubMed] [Google Scholar]
- 52.Michel JB, Martin-Ventura JL, Egido J, Sakalihasan N, Treska V, Lindholt J, Allaire E, Thorsteinsdottir U, Cockerill G, Swedenborg J, Consortium FE. Novel aspects of the pathogenesis of aneurysms of the abdominal aorta in humans. Cardiovasc Res. 2011;90:18–27. doi: 10.1093/cvr/cvq337. [DOI] [PMC free article] [PubMed] [Google Scholar]
- 53.Mizowaki T, Sueyoshi E, Sakamoto I, Uetani M. Expansion rate of nonaneurysmatic abdominal aorta: over 10 years of follow-up CT studies. Comput Med Imaging Graph. 2009;33:17–22. doi: 10.1016/j.compmedimag.2008.09.003. [DOI] [PubMed] [Google Scholar]
- 54.Morrison TM, Choi G, Zarins CK, Taylor CA. Circumferential and longitudinal cyclic strain of the human thoracic aorta: age-related changes. J Vasc Surg. 2009;49:1029–1036. doi: 10.1016/j.jvs.2008.11.056. [DOI] [PMC free article] [PubMed] [Google Scholar]
- 55.Mower WR, Baraff LJ, Sneyd J. Stress distributions in vascular aneurysms: factors affecting risk of aneurysm rupture. The Journal of surgical research. 1993;55:155–161. doi: 10.1006/jsre.1993.1123. [DOI] [PubMed] [Google Scholar]
- 56.Mower WR, Quinones WJ, Gambhir SS. Effect of intraluminal thrombus on abdominal aortic aneurysm wall stress. J Vasc Surg. 1997;26:602–608. doi: 10.1016/s0741-5214(97)70058-2. [DOI] [PubMed] [Google Scholar]
- 57.Papaharilaou Y, Ekaterinaris JA, Manousaki E, Katsamouris AN. A decoupled fluid structure approach for estimating wall stress in abdominal aortic aneurysms. J Biomech. 2007;40:367–377. doi: 10.1016/j.jbiomech.2005.12.013. [DOI] [PubMed] [Google Scholar]
- 58.Pappu S, Dardik A, Tagare H, Gusberg RJ. Beyond fusiform and saccular: a novel quantitative tortuosity index may help classify aneurysm shape and predict aneurysm rupture potential. Ann Vasc Surg. 2008;22:88–97. doi: 10.1016/j.avsg.2007.09.004. [DOI] [PubMed] [Google Scholar]
- 59.Polzer S, Gasser TC, Swedenborg J, Bursa J. The impact of intraluminal thrombus failure on the mechanical stress in the wall of abdominal aortic aneurysms. Eur J Vasc Endovasc Surg. 2011;41:467–473. doi: 10.1016/j.ejvs.2010.12.010. [DOI] [PubMed] [Google Scholar]
- 60.Raghavan D, VanLandingham M, Gu X, Nguyen T. Characterization of heterogeneous regions in polymer systems using tapping mode and force mode atomic force microscopy. Langmuir. 2000;16:9448–9459. [Google Scholar]
- 61.Raghavan ML, Kratzberg J, Castro de Tolosa EM, Hanaoka MM, Walker P, da Silva ES. Regional distribution of wall thickness and failure properties of human abdominal aortic aneurysm. J Biomech. 2006;39:3010–3016. doi: 10.1016/j.jbiomech.2005.10.021. [DOI] [PubMed] [Google Scholar]
- 62.Raghavan ML, Ma B, Fillinger MF. Non-invasive determination of zero-pressure geometry of arterial aneurysms. Ann Biomed Eng. 2006;34:1414–1419. doi: 10.1007/s10439-006-9115-7. [DOI] [PubMed] [Google Scholar]
- 63.Raghavan ML, Ma B, Harbaugh RE. Quantified aneurysm shape and rupture risk. J Neurosurg. 2005;102:355–362. doi: 10.3171/jns.2005.102.2.0355. [DOI] [PubMed] [Google Scholar]
- 64.Raghavan ML, Vorp DA. Toward a biomechanical tool to evaluate rupture potential of abdominal aortic aneurysm: identification of a finite strain constitutive model and evaluation of its applicability. J Biomech. 2000;33:475–482. doi: 10.1016/s0021-9290(99)00201-8. [DOI] [PubMed] [Google Scholar]
- 65.Raghavan ML, Vorp DA, Federle MP, Makaroun MS, Webster MW. Wall stress distribution on three-dimensionally reconstructed models of human abdominal aortic aneurysm. J Vasc Surg. 2000;31:760–769. doi: 10.1067/mva.2000.103971. [DOI] [PubMed] [Google Scholar]
- 66.Raut SS. PhD Thesis. Carnegie Mellon University; 2012. Patient-Specific 3D Vascular Reconstruction and Computational Assessment of Biomechanics – an Application to Abdominal Aortic Aneurysm. [Google Scholar]
- 67.Raut SS, Jana A, De Oliveira V, Muluk SC, Finol EA. The effect of regional variations in wall thickness on the abdominal aortic aneurysm biomechanics. J Biomech Eng. doi: 10.1115/1.4024578. (submitted) [DOI] [PMC free article] [PubMed] [Google Scholar]
- 68.Raut SS, Jana A, Finol EA. Evaluation of the effects of aneurysm geometry and vascular wall material properties on the AAA wall mechanics. J Biomech Eng. (submitted) [Google Scholar]
- 69.Rissland P, Alemu Y, Einav S, Ricotta J, Bluestein D. Abdominal aortic aneurysm risk of rupture: patient-specific FSI simulations using anisotropic model. J Biomech Eng. 2009;131:031001. doi: 10.1115/1.3005200. [DOI] [PubMed] [Google Scholar]
- 70.Rodriguez JF, Martufi G, Doblare M, Finol EA. The effect of material model formulation in the stress analysis of abdominal aortic aneurysms. Ann Biomed Eng. 2009;37:2218–2221. doi: 10.1007/s10439-009-9767-1. [DOI] [PMC free article] [PubMed] [Google Scholar]
- 71.Rodriguez JF, Ruiz C, Doblare M, Holzapfel GA. Mechanical stresses in abdominal aortic aneurysms: influence of diameter, asymmetry, and material anisotropy. J Biomech Eng. 2008;130:021023. doi: 10.1115/1.2898830. [DOI] [PubMed] [Google Scholar]
- 72.Roy J, Labruto F, Beckman MO, Danielson J, Johansson G, Swedenborg J. Bleeding into the intraluminal thrombus in abdominal aortic aneurysms is associated with rupture. J Vasc Surg. 2008;48:1108–1113. doi: 10.1016/j.jvs.2008.06.063. [DOI] [PubMed] [Google Scholar]
- 73.Sakalihasan N, Limet R, Defawe OD. Abdominal aortic aneurysm. Lancet. 2005;365:1577–1589. doi: 10.1016/S0140-6736(05)66459-8. [DOI] [PubMed] [Google Scholar]
- 74.Scotti CM, Finol EA. Compliant biomechanics of abdominal aortic aneurysms: A fluid-structure interaction study. Computers & Structures. 2007;85:1097–1113. [Google Scholar]
- 75.Scotti CM, Jimenez J, Muluk SC, Finol EA. Wall stress and flow dynamics in abdominal aortic aneurysms: finite element analysis vs. fluid-structure interaction. Comput Methods Biomech Biomed Engin. 2008;11:301–322. doi: 10.1080/10255840701827412. [DOI] [PubMed] [Google Scholar]
- 76.Scotti CM, Shkolnik AD, Muluk SC, Finol EA. Fluid-structure interaction in abdominal aortic aneurysms: effects of asymmetry and wall thickness. Biomedical engineering online. 2005;4:64. doi: 10.1186/1475-925X-4-64. [DOI] [PMC free article] [PubMed] [Google Scholar]
- 77.Shum J. PhD Thesis. Carnegie Mellon University; 2011. Risk Assessment of Abdominal Aortic Aneurysms by Geometry Quantification Measures. [Google Scholar]
- 78.Shum J, DiMartino ES, Goldhamme A, Goldman DH, Acker LC, Patel G, Ng JH, Martufi G, Finol EA. Semiautomatic vessel wall detection and quantification of wall thickness in computed tomography images of human abdominal aortic aneurysms. Med Phys. 2010;37:638–648. doi: 10.1118/1.3284976. [DOI] [PubMed] [Google Scholar]
- 79.Shum J, Martufi G, Di Martino E, Washington CB, Grisafi J, Muluk SC, Finol EA. Quantitative assessment of abdominal aortic aneurysm geometry. Ann Biomed Eng. 2011;39:277–286. doi: 10.1007/s10439-010-0175-3. [DOI] [PMC free article] [PubMed] [Google Scholar]
- 80.Solberg S, Forsdahl SH, Singh K, Jacobsen BK. Diameter of the infrarenal aorta as a risk factor for abdominal aortic aneurysm: the Tromso Study, 1994–2001. Eur J Vasc Endovasc Surg. 2010;39:280–284. doi: 10.1016/j.ejvs.2009.10.017. [DOI] [PubMed] [Google Scholar]
- 81.Somkantha K, PP International Conference on Computer and Information Technology; Tokyo, Japan. 2009. [Google Scholar]
- 82.Speelman L, Bohra A, Bosboom EM, Schurink GW, van de Vosse FN, Makaorun MS, Vorp DA. Effects of wall calcifications in patient-specific wall stress analyses of abdominal aortic aneurysms. J Biomech Eng. 2007;129:105–109. doi: 10.1115/1.2401189. [DOI] [PubMed] [Google Scholar]
- 83.Speelman L, Bosboom EM, Schurink GW, Buth J, Breeuwer M, Jacobs MJ, van de Vosse FN. Initial stress and nonlinear material behavior in patient-specific AAA wall stress analysis. J Biomech. 2009;42:1713–1719. doi: 10.1016/j.jbiomech.2009.04.020. [DOI] [PubMed] [Google Scholar]
- 84.Speelman L, Schurink GW, Bosboom EM, Buth J, Breeuwer M, van de Vosse FN, Jacobs MH. The mechanical role of thrombus on the growth rate of an abdominal aortic aneurysm. J Vasc Surg. 2010;51:19–26. doi: 10.1016/j.jvs.2009.08.075. [DOI] [PubMed] [Google Scholar]
- 85.Stenbaek J, Kalin B, Swedenborg J. Growth of thrombus may be a better predictor of rupture than diameter in patients with abdominal aortic aneurysms. Eur J Vasc Endovasc Surg. 2000;20:466–469. doi: 10.1053/ejvs.2000.1217. [DOI] [PubMed] [Google Scholar]
- 86.Stringfellow MM, Lawrence PF, Stringfellow RG. The influence of aorta-aneurysm geometry upon stress in the aneurysm wall. The Journal of surgical research. 1987;42:425–433. doi: 10.1016/0022-4804(87)90178-8. [DOI] [PubMed] [Google Scholar]
- 87.Thompson SG, Ashton HA, Gao L, Scott RA, Multicentre G Aneurysm Screening Study. Screening men for abdominal aortic aneurysm: 10 year mortality and cost effectiveness results from the randomised Multicentre Aneurysm Screening Study. Bmj. 2009;338:b2307. doi: 10.1136/bmj.b2307. [DOI] [PMC free article] [PubMed] [Google Scholar]
- 88.Thubrikar M, Jal-Soudi J, Robicsek F. Wall stress studies of abdominal aortic aneurysm in a clinical model. Ann Vasc Surg. 2001;15:355–366. doi: 10.1007/s100160010080. [DOI] [PubMed] [Google Scholar]
- 89.Thubrikar MJ, Robicsek F, Labrosse M, Chervenkoff V, Fowler BL. Effect of thrombus on abdominal aortic aneurysm wall dilation and stress. J Cardiovasc Surg (Torino) 2003;44:67–77. [PubMed] [Google Scholar]
- 90.Tierney AP, Callanan A, McGloughlin TM. Use of regional mechanical properties of abdominal aortic aneurysms to advance finite element modeling of rupture risk. J Endovasc Ther. 2012;19:100–114. doi: 10.1583/11-3456.1. [DOI] [PubMed] [Google Scholar]
- 91.van Dam EA, Dams SD, Peters GW, Rutten MC, Schurink GW, Buth J, van de Vosse FN. Non-linear viscoelastic behavior of abdominal aortic aneurysm thrombus. Biomech Model Mechanobiol. 2008;7:127–137. doi: 10.1007/s10237-007-0080-3. [DOI] [PMC free article] [PubMed] [Google Scholar]
- 92.Vande Geest JP, Di Martino ES, Bohra A, Makaroun MS, Vorp DA. A biomechanics-based rupture potential index for abdominal aortic aneurysm risk assessment: demonstrative application. Ann N Y Acad Sci. 2006;1085:11–21. doi: 10.1196/annals.1383.046. [DOI] [PubMed] [Google Scholar]
- 93.Vande Geest JP, Sacks MS, Vorp DA. The effects of aneurysm on the biaxial mechanical behavior of human abdominal aorta. J Biomech. 2006;39:1324–1334. doi: 10.1016/j.jbiomech.2005.03.003. [DOI] [PubMed] [Google Scholar]
- 94.Vande Geest JP, Sacks MS, Vorp DA. A planar biaxial constitutive relation for the luminal layer of intra–luminal thrombus in abdominal aortic aneurysms. J Biomech. 2006;39:2347–2354. doi: 10.1016/j.jbiomech.2006.05.011. [DOI] [PubMed] [Google Scholar]
- 95.Vande Geest JP, Schmidt DE, Sacks MS, Vorp DA. The effects of anisotropy on the stress analyses of patient-specific abdominal aortic aneurysms. Ann Biomed Eng. 2008;36:921–932. doi: 10.1007/s10439-008-9490-3. [DOI] [PMC free article] [PubMed] [Google Scholar]
- 96.Vande Geest JP, Wang DH, Wisniewski SR, Makaroun MS, Vorp DA. Towards a noninvasive method for determination of patient-specific wall strength distribution in abdominal aortic aneurysms. Ann Biomed Eng. 2006;34:1098–1106. doi: 10.1007/s10439-006-9132-6. [DOI] [PubMed] [Google Scholar]
- 97.Venkatasubramaniam AK, Fagan MJ, Mehta T, Mylankal KJ, Ray B, Kuhan G, Chetter IC, McCollum PT. A comparative study of aortic wall stress using finite element analysis for ruptured and non-ruptured abdominal aortic aneurysms. Eur J Vasc Endovasc Surg. 2004;28:168–176. doi: 10.1016/j.ejvs.2004.03.029. [DOI] [PubMed] [Google Scholar]
- 98.Vilalta G, Vaquero NF, Vilalta CJA. Quantitative indicator of abdominal aortic aneurysm rupture risk based on its geometric parameter parameters. World Academy of Science, Engineering and Technology. 2010:181–185. [Google Scholar]
- 99.Volokh KY. Comparison of biomechanical failure criteria for abdominal aortic aneurysm. J Biomech. 2010;43:2032–2034. doi: 10.1016/j.jbiomech.2010.03.024. [DOI] [PubMed] [Google Scholar]
- 100.Vorp DA. Biomechanics of abdominal aortic aneurysm. J Biomech. 2007;40:1887–1902. doi: 10.1016/j.jbiomech.2006.09.003. [DOI] [PMC free article] [PubMed] [Google Scholar]
- 101.Vorp DA, Lee PC, Wang DH, Makaroun MS, Nemoto EM, Ogawa S, Webster MW. Association of intraluminal thrombus in abdominal aortic aneurysm with local hypoxia and wall weakening. J Vasc Surg. 2001;34:291–299. doi: 10.1067/mva.2001.114813. [DOI] [PubMed] [Google Scholar]
- 102.Vorp DA, Raghavan ML, Webster MW. Mechanical wall stress in abdominal aortic aneurysm: influence of diameter and asymmetry. J Vasc Surg. 1998;27:632–639. doi: 10.1016/s0741-5214(98)70227-7. [DOI] [PubMed] [Google Scholar]
- 103.Wang DH, Makaroun MS, Webster MW, Vorp DA. Effect of intraluminal thrombus on wall stress in patient-specific models of abdominal aortic aneurysm. J Vasc Surg. 2002;36:598–604. doi: 10.1067/mva.2002.126087. [DOI] [PubMed] [Google Scholar]
- 104.Watton PN, Hill NA. Evolving mechanical properties of a model of abdominal aortic aneurysm. Biomech Model Mechanobiol. 2009;8:25–42. doi: 10.1007/s10237-007-0115-9. [DOI] [PubMed] [Google Scholar]
- 105.Watton PN, Hill NA, Heil M. A mathematical model for the growth of the abdominal aortic aneurysm. Biomech Model Mechanobiol. 2004;3:98–113. doi: 10.1007/s10237-004-0052-9. [DOI] [PubMed] [Google Scholar]
- 106.Xenos M, Rambhia SH, Alemu Y, Einav S, Labropoulos N, Tassiopoulos A, Ricotta JJ, Bluestein D. Patient-based abdominal aortic aneurysm rupture risk prediction with fluid structure interaction modeling. Ann Biomed Eng. 2010;38:3323–3337. doi: 10.1007/s10439-010-0094-3. [DOI] [PubMed] [Google Scholar]
- 107.Zeinali-Davarani S, Choi J, Baek S. On parameter estimation for biaxial mechanical behavior of arteries. J Biomech. 2009;42:524–530. doi: 10.1016/j.jbiomech.2008.11.022. [DOI] [PubMed] [Google Scholar]