
Figure 2.
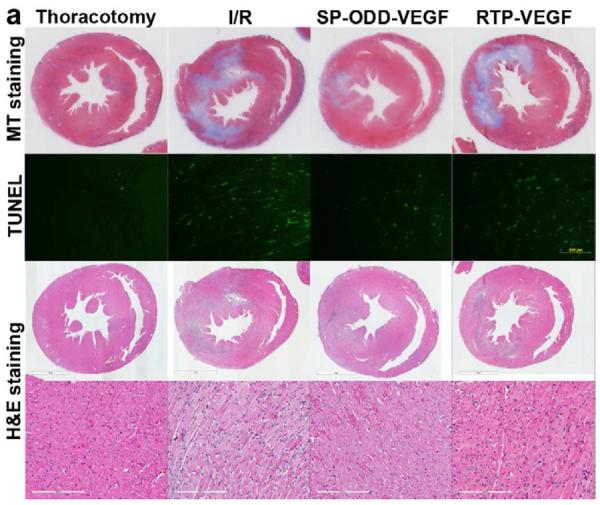
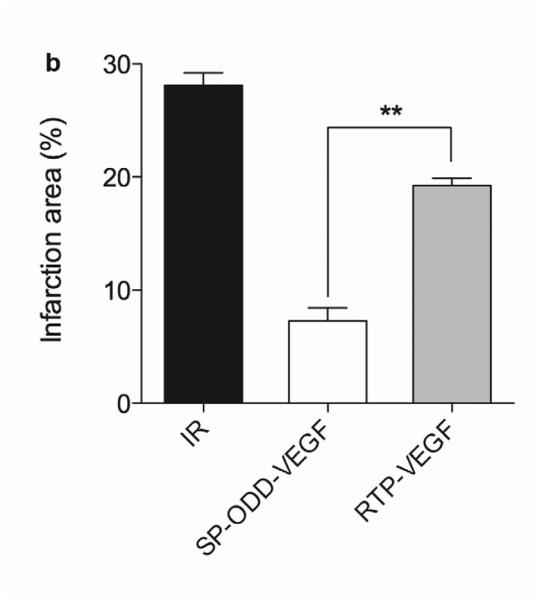
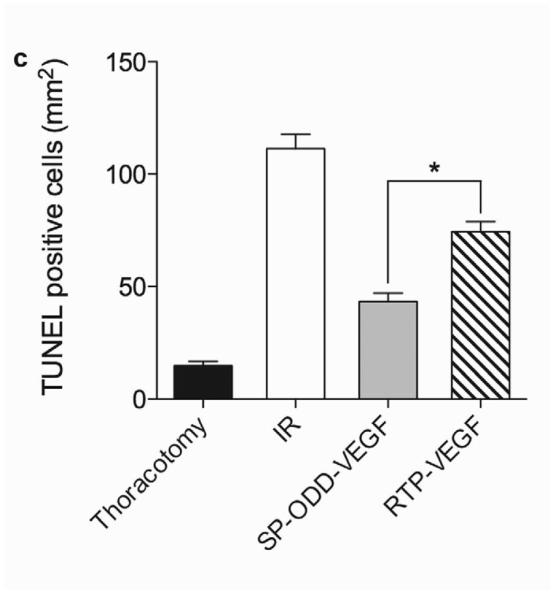
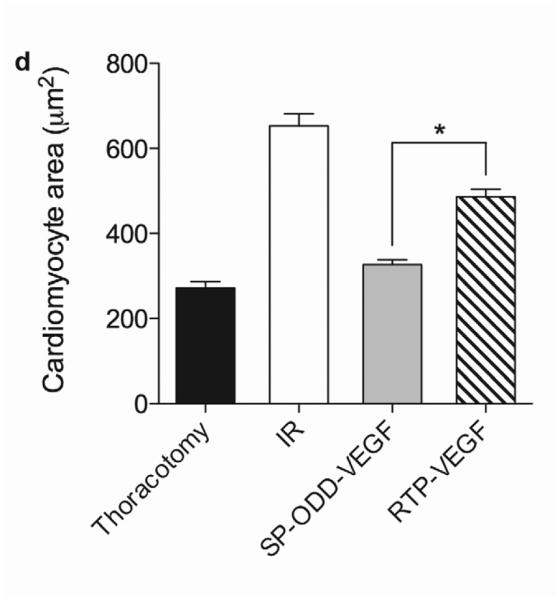
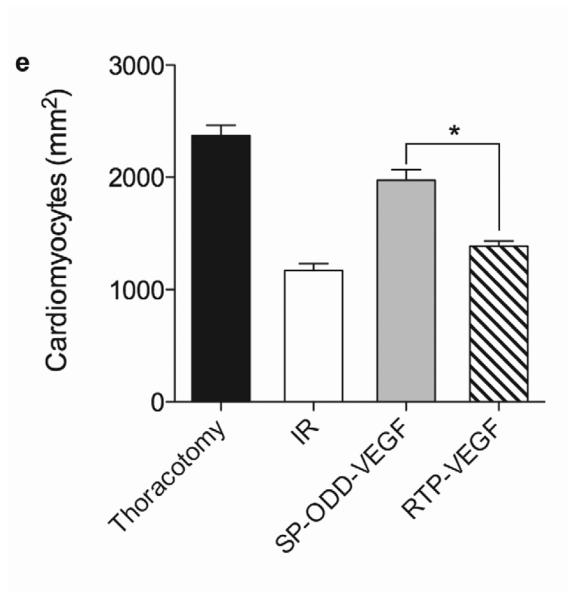
Myocardial infarction, cardiomyocyte hypertrophy, and density. (a) Masson's trichrome (MT), TUNEL, and H&E staining. MT staining to visualize the area of infarction, TUNEL staining to determine apoptotic cardiomyocyte death, and H&E staining for general histological analysis were performed two weeks after surgery. (b) Analysis of the area of infarction. The infarct size was calculated as the percentage of infarcted tissue of the total area of the left ventricle. The data are presented as the mean ± the standard deviation (SD) of five animals per group (*p<0.05). (c) The number of TUNEL-positive cells. The TUNEL positive cells were counted in five random regions per sample in the ischemic border zone. (d) Cardiomyocyte hypertrophy. (e) Cardiomyocyte density. (*p<0.05, **p<0.01).