
Figure 3.
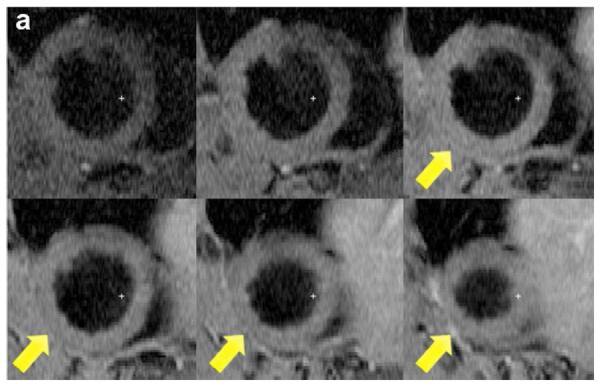
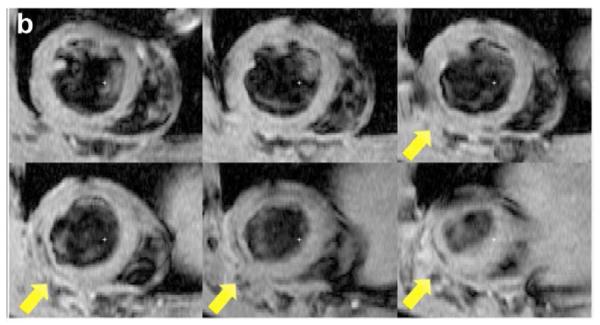
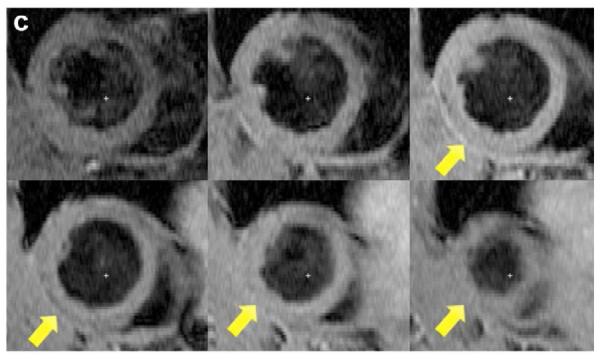
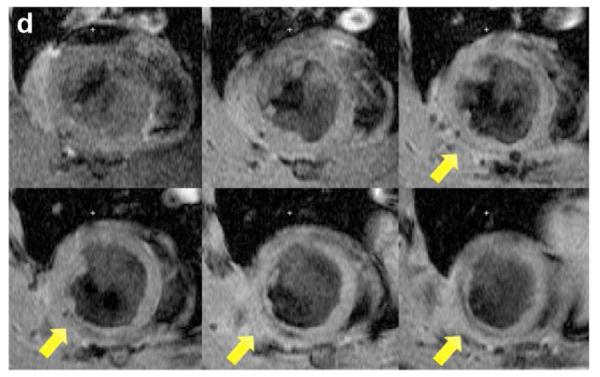
Short axis MRI images of the left ventricles of the experimental groups. (a) Thoracotomy only, (b) Ischemia/Reperfusion (I/R), (c) pβ-SP-ODD-VEGF treatment, and (d) RTP-VEGF treatment groups. MRI analysis was performed to determine cardiac structure and function two weeks after surgery. Arrows indicate the regions of infarction in the left ventricles.