

Abstract
Direct conversion of fibroblasts to induced cardiomyocytes (iCMs) has great potential for regenerative medicine. Recent publications have reported significant progress, but the evaluation of reprogramming has relied upon non-functional measures such as flow cytometry for cardiomyocyte markers or GFP expression driven by a cardiomyocyte-specific promoter. The issue is one of practicality: the most stringent measures - electrophysiology to detect cell excitation and the presence of spontaneously contracting myocytes - are not readily quantifiable in the large numbers of cells screened in reprogramming experiments. However, excitation and contraction are linked by a third functional characteristic of cardiomyocytes: the rhythmic oscillation of intracellular calcium levels. We set out to optimize direct conversion of fibroblasts to iCMs with a quantifiable calcium reporter to rapidly assess functional transdifferentiation. We constructed a reporter system in which the calcium indicator GCaMP is driven by the cardiomyocyte-specific Troponin T promoter. Using calcium activity as our primary outcome measure, we compared several published combinations of transcription factors along with novel combinations in mouse embryonic fibroblasts. The most effective combination consisted of Hand2, Nkx2.5, Gata4, Mef2c, and Tbx5 (HNGMT). This combination is >50-fold more efficient than GMT alone and produces iCMs with cardiomyocyte marker expression, robust calcium oscillation, and spontaneous beating that persists for weeks following inactivation of reprogramming factors. HNGMT is also significantly more effective than previously published factor combinations for the transdifferentiation of adult mouse cardiac fibroblasts to iCMs. Quantification of calcium function is a convenient and effective means for the identification and evaluation of cardiomyocytes generated by direct reprogramming. Using this stringent outcome measure, we conclude that HNGMT produces iCMs more efficiently than previously published methods.
Keywords: direct reprogramming, transdifferentiation, induced cardiomyocytes, calcium imaging, regenerative medicine
1. Introduction
Generation of cardiomyocytes by direct cellular reprogramming provides a valuable source of cells for use in cardiovascular disease research and treatment. Induced cardiomyocytes, or iCMs, may be used for patient-specific drug toxicology screens, transplantations to replace cells lost via myocardial infarction, and to model cardiac development and disease in vitro. Unlike pluripotent cell-based strategies, direct reprogramming also offers the tantalizing prospect of direct in situ conversions in the target organ. Great progress toward these goals has been reported by several groups [1–5], however the effectiveness of cardiac reprogramming remains controversial [6, 7]. Published reports on the in vitro generation of iCMs have relied upon some combination of GFP reporters, flow cytometry, and RT-PCR for cardiomyocyte-specific markers to evaluate the effectiveness of reprogramming procedures, with highly variable results. We set out to optimize the conversion of fibroblasts to iCMs using a more stringent outcome measure - the calcium oscillation that links excitation to contraction in functional cardiomyocytes.
Genetically-encoded calcium indicators (GECIs) are powerful tools for the visualization of changes in intracellular calcium levels [8–10]. GCaMP is a well-characterized GECI whose activity is comparable to traditional calcium indicator dyes such as Fura-2 and Rhodamine-3 [11]. Unlike indicator dyes, however, GECIs can be targeted specifically to cells or tissues of interest using lineage-restricted gene promoters. Although most widely used in the field of neuroscience to study the calcium oscillations that underlie neural activity [12–16], transgenic mice have been engineered to specifically express GCaMP in smooth muscle [17] and cardiomyocytes [18]. More recently, GCaMP was used to demonstrate that human embryonic stem cell-derived cardiomyocytes can electrically couple with host myocytes upon transplantation to infarcted hearts [19]. In this report, we describe the first use of GCaMP as functional tool for the optimization of cardiac reprogramming.
The present study uses mouse embryonic fibroblasts (MEFs) as the starting cell population for initial reprogramming experiments. MEFs were chosen for their ease of isolation from transgenic mouse lines and their extensive history as a starting material for direct reprogramming to a wide range of targets including pluripotent stem cells [20], skeletal muscle [21], neurons [13, 22, 23], neural progenitor cells [24], blood cells [25], hepatocytes [26, 27], 3 Sertoli cells [28], and cardiomyocyte-like cells [3, 29]. After determining the optimal factor combination for MEF transdifferentiation, we extend this method to the conversion of adult mouse cardiac fibroblasts to iCMs.
2. Materials and methods
2.1 Plasmid construction
TroponinT-GCaMP5-Zeo vector: The ubiquitin promoter-rtTA cassette of FUdeltaGW-rtTA (Addgene plasmid 19780) was excised and replaced with the human TNNT2 gene promoter (PCR-amplified from System Biosciences plasmid SR10012PA-1) and a Gateway cassette (PCR-amplified from pEF-DEST51, Invitrogen) to create TroponinT-Gateway. The GCaMP5-2A-Zeo cassette was built by using recombinant PCR to link the GCaMP5 sequence of pCMV-GCaMP5G [14] (Addgene plasmid 31788) to the T2A-Zeocin sequence of System Biosciences plasmid SR10012PA-1. The GCaMP5-2A-Zeo cassette was cloned into pDONR221 (Invitrogen), and subsequently into TroponinT-Gateway, via Gateway recombination. All lentiviral backbone plasmids were amplified in STBL3 bacteria (Invitrogen). Transcription factor open reading frames (listed in supplemental Table S1) were cloned into the doxycycline-inducible (Tet-on) destination vector FU-tetO-Gateway [13] using LR Clonase II (Invitrogen).
2.2 Lentivirus production
Second-generation lentiviral vectors were packaged in Lenti-X 293T cells (Clontech) using Lipofectamine 2000 (Invitrogen) to deliver 12 μg of the lentiviral backbone plasmid, 7.7 μg psPAX2 (Addgene plasmid 12260) and 4.3 μg pMD2.G (Addgene plasmid 12259) in 3 mL OPTI-MEM (Invitrogen) to ~90% confluent 100 mm plates of 293T cells with 10 mL fresh MEF medium. Viral supernatant (13 mL) was collected at 24 and 48 hours post-transfection, combined, and aliquoted for storage at −80°C. Viral titer was determined using Lenti-X GoStix (Clontech). Lentiviruses used for all experiments had a minimum titer of 5×10⁵ IFU/mL. The TroponinT-GCaMP5-Zeo reporter lentivirus was validated by transducing primary embryonic cardiomyocytes (E14.5) on a poly-D-lysine-coated 35 mm FluoroDish (World Precision Instruments) with 500 uL (≥ 2.5×10⁵ IFU) of virus. GCaMP activity was recorded 48 hours post-transduction.
2.3 Preparation of primary cells
To prepare MEFs, embryos were harvested from mice of mixed background at 14.5 dpc followed by decapitation and removal of internal visceral organs, including the heart. The tissue was minced, then digested with trypsin and trituration, followed by resuspension of the cells in DMEM with 10% fetal bovine serum and 2 mM L-glutamine (MEF medium). The cells were plated on a 100 mm plate at a ratio of one embryo per plate and allowed to expand for 24 hours, at which time they were passaged 1:3 for further expansion (passage 1). MEFs were used at passages 3–5 for reprogramming experiments.
Primary embryonic cardiomyocytes were isolated at 14.5 dpc as previously described [30].
Cardiac fibroblasts were isolated from adult mice (8–11 weeks old) using a method adapted from Chen et al [6]. Hearts were removed and minced in cold PBS and then transferred to 4 mg/mL collagenase IV (Sigma) and 10 U/mL deoxyribonuclease I (Worthington Biochemical Corporation) and agitated at 37°C for 10 minutes. Samples were spun down and resuspended in TrypLE (Invitrogen) at 37°C with agitation. After 5 minutes, medium (DMEM supplemented with 15% FBS, 1% NEAA) was added and the resulting solution was added to gelatin-coated 6 well plates. After 7 days, any remaining pieces of tissue were removed and the cells were passaged 1:5 and frozen when confluent. Cardiac fibroblasts were used at passage 3 for reprogramming experiments.
2.4 Direct conversion of fibroblasts to iCMs
An outline of the reprogramming protocol is shown in Figure 2A. MEFs or adult mouse cardiac fibroblasts were plated into poly-L-lysine-coated glass-bottomed 6 well dishes (MatTek P06G-1.0-20-F) at 75,000 cells/well on Day -2, with 500 μL (≥ 2.5×10⁵ IFU) each of rtTA lentivirus (FUdeltaGW-rtTA, Addgene plasmid 19780) and TroponinT-GCaMP-Zeo reporter lentivirus per well with 2 mL MEF medium. The following day (Day -1), culture medium was replaced with 2 mL fresh MEF medium and cells were transduced with 500 μL (≥ 2.5×10⁵ IFU) of each tetO-transcription factor lentivirus (thus, 2.5 mL total volume of lentiviruses for HNGMT-mediated reprogramming). The next day (Day 0), medium was switched to 3 mL/well Reprogramming Medium consisting of AGM (Lonza CC-3186) without EGF, supplemented with 2 μg/mL doxycycline (Sigma). Fibroblasts were transduced on Day 0 with 200 μL (≥ 1×10⁵ IFU) of PGK-H2B-mCherry [31] virus (Addgene plasmid 21217), which constitutively expresses nuclear-localized mCherry red fluorescent protein. Reprogramming Medium was changed every 2–3 days.
Figure 2. Functional quantification of direct fibroblast reprogramming to induced cardiomyocytes.

A) Schematic of direct fibroblast reprogramming to induced cardiomyocytes (iCMs).
B) GCaMP activity in beating iCMs, 14 days post-induction. The left panel corresponds to a single frame of supplemental Movie S4, which shows Ca2+ flux in spontaneously beating iCMs generated by HNGMT treatment, overlaid with a red fluorescent image to show the PGK-H2B-mCherry vector that was used to quantify total cells. The right panel traces oscillations in GCaMP fluorescence, corresponding to oscillations in intracellular Ca2+, at the regions marked by the white arrows. Scale bar 50μm. RFU, Relative Fluorescence Units calculated using the “Intensity v Time Monitor” in ImageJ software.
C) Quantification of functional iCMs using GCaMP activity. Functional iCMs were identified on the basis of repeated GCaMP oscillation in 10s movies made at 14 days post-induction. Activity is expressed as the percentage of cells displaying repeated GCaMP oscillation in 10s movies divided by the total number of cells per field. Data are presented as means ± SEM. *denotes p<0.05 in comparison to GMT.
2.5 Live Imaging and Quantification of functional iCMs
Quantification of GCaMP+ cells was achieved by comparing the number of flashing cells to the total cell number, the latter indicated by the constitutively-expressed nuclear red fluorescent marker, PGK-H2B-mCherry [31]. To facilitate fluorescent imaging of live cells, reprogramming was performed on MEFs grown in glass-bottomed 6 well dishes (MatTek P06G-1.0-20-F). To permit counting of total cell number, MEFs were transduced on Day 0 with 200 μL (≥ 1×10⁵ IFU) of PGK-H2B-mCherry [31] virus (Addgene plasmid 21217), which constitutively expresses nuclear-localized mCherry red fluorescent protein. For GCaMP and mCherry imaging, medium was replaced with Tyrode’s Salt Solution (Sigma T2397). 10 second movies were made of 10–12 unique fields of view in a single well of a 6 well dish with a 10X Apo objective. After collecting video with the GFP filter to view GCaMP, a brief segment of video was recorded with the mCherry filter to visualize all nuclei. GCaMP+ cells were counted in ImageJ and total cell number was obtained using the Nucleus Counter plugin (MacBiophotonics ImageJ). A minimum of 3000 total cells were counted per replicate, per condition. All GCaMP quantification data is the result of a minimum of 3 separate reprogramming experiments. Imaging was performed on an Olympus iX-81 microscope with Metamorph software. Movies were obtained using HyperCam software (Hyperionics Technology). Statistical analysis (shown in supplemental Table S2) was conducted using a one-way ANOVA with Tukey’s post-hoc testing. The GCaMP intensity traces shown in Figures 1B, 2B, 4C, and 6B were made using the “Intensity v Time Monitor” plugin in ImageJ.
Figure 1. The TroponinT-GCaMP5 calcium reporter.
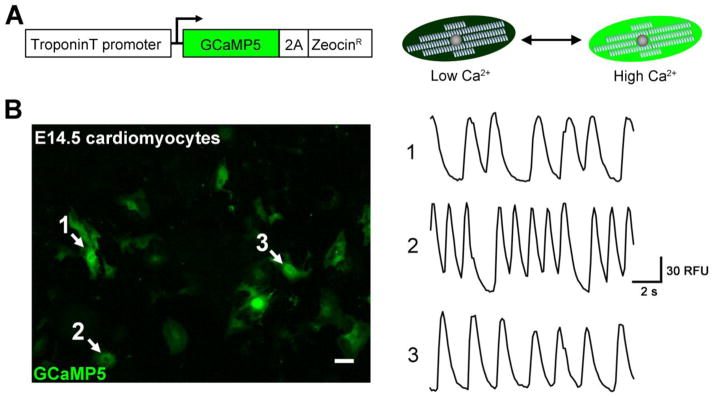
A) The Troponin T (TNNT2) gene promoter drives expression of the genetically-encoded calcium indicator, GCaMP5, and a zeocin resistance cassette. The GCaMP protein consists of a Ca2+-sensitive calmodulin domain fused to GFP. When intracellular Ca2+ is low, the calmodulin domain blocks proper folding of GFP, resulting in a low level of GFP fluorescence. When intracellular Ca2+ is high, the calmodulin domain shifts to permit GFP folding and bright fluorescence.
B) Validation of the TroponinT-GCaMP5 reporter in embryonic cardiomyocytes. Ventricular cardiomyocytes were isolated from mouse embryos at 14.5 dpc and transduced with reporter lentivirus. GCaMP activity was recorded 48 hours post-transduction. The left panel corresponds to a single frame of supplemental Movie S1. White arrows indicate regions examined for oscillating fluorescence, shown in the right panel. RFU, Relative Fluorescence Units calculated using the “Intensity v Time Monitor” in ImageJ software.
Figure 4. Stability of the reprogrammed iCM phenotype.
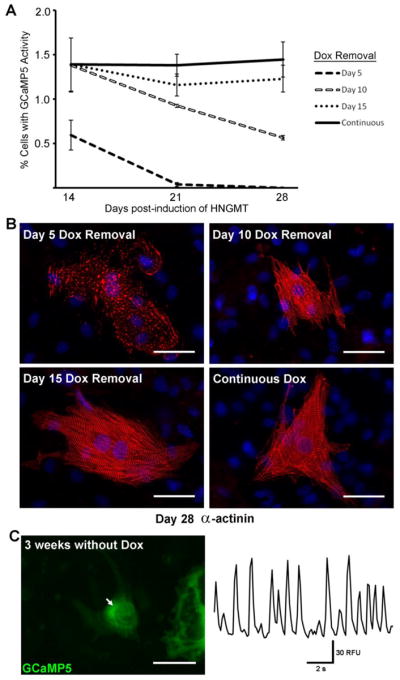
A) GCaMP activity was quantified at 14, 21, and 28 days post-induction, comparing HNGMT-treated cells with doxycycline applied continuously or withdrawn at 5, 10, or 15 days post-induction. Data are presented as means ± SEM. Beating, GCaMP+ iCMs could be detected on Day 28 for all conditions excepting Day 5 Dox removal.
B) Immunostaining for sarcomeric α-actinin (red) in representative HNGMT-iCMs, 28 days post-induction. DAPI stain (blue) marks nuclei. Scale bars 50μm.
C) GCaMP activity recorded on Day 36 post-induction, with doxycycline removed on Day 15 (thus 3 weeks without exogenous transcription factor induction). Right panel shows oscillation in GCaMP fluorescence at the region indicated by the white arrow, left. Left panel is a single frame of supplemental Movie S6, which shows both GCaMP activity and robust cell contraction. Scale bar 50μm.
Figure 6. iCMs derived from adult cardiac fibroblasts.

A) Quantification of functional cardiac fibroblast-derived iCMs using GCaMP activity. Functional iCMs were identified on the basis of repeated GCaMP oscillation in 10s movies made at 14 days post-induction. Activity is expressed as the percentage of cells displaying repeated GCaMP oscillation in 10s movies divided by the total number of cells per field. Data are presented as means ± SEM. * denotes p<0.05 in comparison to GMT. # denotes p<0.05 in comparison to HGMT.
B) GCaMP activity recorded in a typical cardiac fibroblast-derived iCM on Day 14 post-induction. Top panel is a single frame of supplemental Movie S7, which shows both GCaMP activity and spontaneous contraction. Lower panel shows oscillation in GCaMP fluorescence at the region indicated by the white arrow, above. Scale bar 50μm.
C) Immunocytochemical analysis of cardiac fibroblast-derived iCMs, 14 days post-induction. Cardiomyocyte markers cardiac Troponin T (cTnT), α-myosin heavy chain (α-MHC), and sarcomeric α-actinin are expressed in HNGMT-iCMs. Regions in white boxes are enlarged in insets to show sarcomere structure. Putative smooth muscle cells were also detected by staining for smooth muscle myosin heavy chain (smMHC, Myh11). DAPI stain (blue) marks nuclei. Scale bars 50μm.
2.6 Immunocytochemistry
Immunostaining was performed as previously described [13]. Briefly, cells for immunostaining were grown on 12mm glass coverslips coated with poly-L-lysine (BD Biocoat 354085), with 4–5 coverslips per well of a 6 well dish. The following primary antibodies were used: mouse anti-cardiac Troponin T (Thermo MS-295-P, 1:200); mouse anti-myosin heavy chain clone MF20 (eBioscience 53-6503-82, 1:200); mouse anti-sarcomeric α-actinin (clone EA-53, Sigma A7811, 1:200); rabbit anti-smooth muscle myosin heavy chain (Abcam ab53219, 1:200); goat anti-Mesp1 (Santa Cruz Biotechnology sc-163078, 1:100); rabbit anti-von Willebrand factor (Abcam ab6994, 1:100); rabbit anti-Isl1 (Abcam ab20670, 1:100); rabbit anti-CD31 (Abcam ab28364, 1:100); goat anti-Nkx2.5 (Santa Cruz Biotechnology sc-8697, 1:100).
2.7 Microarray
Mouse genome-wide expression analyses were performed using the Affymetrix Mouse Gene 1.0 ST Array. iCMs were enriched by selecting for zeocin resistance driven by the TroponinT-GCaMP5-Zeo reporter and collected in Trizol at Day 21 post-transduction (7 days after initiation of zeocin selection, 300 μg/mL). Non-transduced MEFs were cultured and collected at Day 21. Samples were collected in triplicate from independent biological replicates and total RNA was prepared by the University of Pennsylvania Molecular Profiling Facility. Microarray analyses were performed with standard Affymetrix GeneChip Expression protocols. Initial data analysis was performed using Affymetrix Microarray Suite 5.0 and further analyzed using PartekGS software. The heat map in Figure 5A was generated using Multi Experiment Viewer (http://www.tm4.org/). Complete microarray dataset has been deposited in the GEO database (Accession # GSE45274). Expression levels of selected genes identified via microarray analysis were validated using quantitative RT-PCR.
Figure 5. iCM gene expression analysis and assessment of components of excitation-contraction coupling.

A) Heat map showing expression data for selected genes in microarray analysis. Microarrays were performed on RNA collected from putative iCMs on Day 21 post-induction. Expression is normalized to untreated MEFs, with positive fold changes indicated in red and negative fold changes in green.
B) Key components of the excitation-contraction system: Action potential firing causes an inward Ca2+ current to enter the myocyte via CaV1.2 channels. The influx of Ca2+ ions stimulates Ryanodine receptors (RyR) to release additional Ca2+ into the cytosol from the calsequestrin stores of the sarcoplasmic reticulum (SR), causing the activation of Troponin C and the troponin-tropomyosin complex that mediates contraction. Cytosolic Ca2+ levels are then rapidly reduced by a combination of mechanisms including Na+/Ca2+ exchange by NCX and pumping into the SR by the Phospoholamban (PLN)-regulated sarcoendoplasmic reticulum calcium ATPase (SERCA). Junctophilin helps to tether the SR to the sarcolemma. Diagram was made with Servier Medical Art, with permission.
C) Expression of excitation-contraction genes in iCMs. Gene expression data obtained via microarray analysis was confirmed using quantitative RT-PCR and normalized to expression levels present in embryonic cardiomyocytes (E14.5). Calsequestrin, CaV1.2, and Phospholamban are most highly expressed in iCMs generated by HGMT and HNGMT, the factor combinations that produced the most GCaMP+ cells. Data are presented as means ± SEM. * denotes p<0.05 for increase in expression compared to GMT.
2.8 Quantitative RT-PCR
RNA was collected using the RNeasy Mini Kit (Qiagen) and first-strand cDNA synthesis was performed using Superscript III reverse transcriptase (Invitrogen) with random hexamer primers. Quantitative real-time PCR was performed on an ABI 7900HT system (Applied Biosystems) using the following TaqMan gene expression assays: beta actin (Mm00607939_s1), 18S RNA (Hs99999901_s1), Mesp1 (Mm00801883_g1), Isl1 (Mm00627860_m1), Nkx2.5 (Mm00657783_m1), Cacna1c (Mm01188822_m1), Casq2 (Mm00486742_m1), Jph2 (Mm00517621_m1), Pln (Mm04206541_m1), Ryr2 (Mm00465877_m1), and Atp2a2 (Mm01201431_m1).
2.9 Generation of Cardiac Progenitor Cells and Cardiomyocytes from Embryonic Stem Cells
To generate CPCs for use as a positive control in RT-PCR studies, mouse embryonic stem cells (line D3, passage 27) were differentiated as descried by Kattman et al [32]. Briefly, cells at passage 25 were transitioned to serum-free growth medium (Knockout DMEM/F12 (Invitrogen) supplemented with 0.5X of both N2 and B27 supplements (Invitrogen), 1X Glutamax (Invitrogen), 1X penicillin-streptomycin (Invitrogen), 0.05% BSA (Invitrogen), 1000 U/mL LIF (Millipore), 0.15 mM 1-thioglycerol (Sigma), and 10 ng/mL BMP4 (R&D Systems)) for two passages onto gelatin-coated 100 mm plates without feeders. On Day 0, ES cells were dissociated using TrypLE Express (Invitrogen) and differentiated as embryoid bodies in serum-free medium consisting of 75% Iscove’s modified Dulbecco’s medium (Invitrogen) and 25% Ham’s F12 medium (Invitrogen) supplemented with 0.5X N2 and B27 without retinoic acid supplements (Invitrogen), 1X penicillin-streptomycin, 0.05% BSA, 4.5 mM 1-thioglycerol and 50 μg/mL ascorbic acid (Sigma) at 100,000 cells/mL in non-tissue culture-treated 100 mm plates without addition of any growth factors. After 48 hours, the embryoid bodies were dissociated and reaggregated at 150,000 cells/mL in the aforementioned differentiation medium supplemented with 5 ng/mL human VEGF (R&D Systems), 0.5 ng/mL human BMP4 (R&D Systems), and 8 ng/mL human Activin A (R&D Systems). Unsorted and Flk-1+/PDGFRα+ cells were collected at Day 3.75 for RNA isolation.
To generate ES-derived cardiomyocytes for validation of the TroponinT-GCaMP vector, whole embryoid bodies were plated on Day 3.75 onto fibronectin-coated FluoroDishes in ES Differentiation Medium consisting of StemPro34 with StemPro Nutrient Supplement (Invitrogen), 1X Glutamax, 1mM ascorbic acid (Sigma), 2.5 μM XAV939 (Cayman Chemical), 5 ng/mL VEGF (R&D Systems), 10 ng/mL bFGF (R&D Systems), and 12.5 ng/mL FGF10 (R&D Systems). Cells were transduced on Day 4 with 500 uL (≥ 2.5×10⁵ IFU) of TroponinT-GCaMP5-Zeo reporter lentivirus. GCaMP activity in ES-derived cardiomyocytes was imaged on Day 9, when beating cells were readily identifiable.
3. Results
3.1 Validation of the TroponinT-GCaMP Calcium Reporter
We constructed a GCaMP reporter lentivirus that allows for real-time detection of calcium flux in live cells driven by the cardiomyocyte-specific Troponin T (TNNT2) promoter (Figure 1A). The effectiveness of the TroponinT-GCaMP5-Zeo reporter lentivirus was tested in ventricular cardiomyocytes isolated from mouse embryos at 14.5 dpc. As shown in Figure 1B and supplemental Movie S1, the reporter vector drives cardiomyocyte-specific expression of GCaMP5, a protein that exhibits bright green fluorescence in the presence of high intracellular Ca2+ levels and dim fluorescence with low Ca2+. Thus, the rhythmic oscillation of intracellular Ca2+ that couples excitation and contraction in cardiomyocytes can be readily observed using a standard GFP filter on a fluorescent microscope. The TroponinT-GCaMP5 vector was also effective for visualizing calcium flux in embryonic atrial cardiomyocytes as well as embryonic stem cell-derived cardiomyocytes (shown in supplemental Figure S1 and Movies S2 and S3).
3.2 Evaluation of Transcription Factor Combinations for their Capacity to Convert Fibroblasts into induced Cardiomyocytes
Mouse embryonic fibroblasts were transduced with doxycycline-inducible lentiviral vectors to drive expression of cardiac transcription factors. In combination with the reverse tetracycline transactivator (rtTA), these vectors allow for the activation and inactivation of transgene expression using Tet-on regulation. Each lentiviral vector contains a single transcription factor Open Reading Frame (listed in supplemental Table S1). Viral transduction efficiency was determined to be >95% using immunostaining for the V5 epitope tag present at the C-terminus of transcription factors in the tetO-Gateway vector (shown in supplemental Figure S2). Initial studies compared the previously published 3-factor combination of Gata4, Mef2c, and Tbx5 (GMT)[1] with a 4-factor combination consisting of GMT plus Nkx2.5 (NGMT). NGMT proved more effective than GMT for the generation of putative iCMs, as indicated by immunostaining for α-myosin heavy chain, cardiac Troponin T, and sarcomeric α-actinin (Figures S3 and S4). NGMT also produced functional cardiomyocytes, with 0.7 ± 0.3% of cells exhibiting GCaMP activity at 14 days post-induction compared to 0.03 ± 0.02% for GMT (Figure 2C), a 22.5-fold increase over GMT. When we compared the more recently published combination of GMT plus Hand2 (HGMT)[5], an increased number of functional iCMs (1.3 ± 0.1%) was detected. To determine whether the enhancing effects of Nkx2.5 and Hand2 were overlapping, we added both factors to GMT and found greater enhancement of functional iCM generation (HNGMT, 1.6 ± 0.3% GCaMP+), a 52-fold increase over GMT alone. In addition, we compared the recently published combination of Myocardin, Mef2c, and Tbx5 (DMT, 0.06 ± 0.01%)[3] and DMT plus Nkx2.5 (DMNT, 0.4 ± 0.2%). Representative GCaMP+ iCMs generated with HNGMT are shown in Figure 2B, which is a single frame of supplemental Movie S4 overlaid with a red fluorescent image to show the PGK-H2B-mCherry vector that was used to quantify all cells in a given field of view. GCaMP activity was detected as early as 6 days post-induction, with robust calcium flux and spontaneous beating evident by Day 14, as shown in supplemental Movie S5. In MEFs that were not transduced with transcription factor lentiviruses, rare (fewer than 1 in 1000) cells exhibited steady green fluorescence, likely due to integration of the reporter vector in genomic regions of high transcriptional activity. However, no oscillations in GCaMP fluorescence were detected in MEFs that did not receive transcription factors, with greater than 2 × 10⁷ cells analyzed.
3.3 Immunocytochemical Analysis of induced Cardiomyocytes
Immunostaining for cardiomyocyte markers revealed expression of α-myosin heavy chain, cardiac Troponin T, and α-actinin, with sarcomere structure clearly visible (Figure 3). α-actinin staining was performed using antibody clone EA-53, which does not recognize smooth muscle actinin [33]. Staining for smooth muscle myosin heavy chain (Myh11), a marker that exclusively labels smooth muscle cells during mouse embryonic development [34], revealed that all combinations tested produced putative smooth muscle cells in addition to iCMs (Figure 3B and supplemental Figure S4). No expression of α-myosin heavy chain, cardiac Troponin T, α-actinin, or smooth muscle myosin heavy chain was detected in cells that were not transduced with transcription factor lentiviruses (supplemental Figures S3 and S4) or in cells that were singly transduced with individual transcription factor vectors (data not shown). Vascular endothelial markers (CD31 and von Willebrand factor) were not detected, suggesting that the reprogramming process did not involve a tripotent cardiac progenitor cell intermediate. In HNGMT-treated wells, rare cells were identified that stained double-positive for markers of smooth muscle and cardiomyocytes (as seen in supplemental Figure S4). Combinations DMT and DMNT induced widespread expression of smooth muscle myosin heavy chain, a finding that is consistent with the known role of Myocardin as a key regulator of smooth muscle development [35].
Figure 3. Immunocytochemical analysis of Day 14 iCMs.
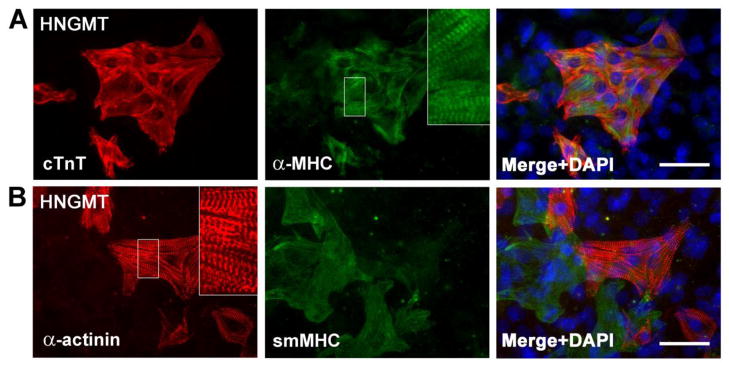
Cardiomyocyte markers cardiac Troponin T (cTnT), α-myosin heavy chain (α-MHC), and sarcomeric α-actinin are expressed in HNGMT-iCMs. Regions in white boxes are enlarged in insets to show sarcomere structure. Putative smooth muscle cells were also detected by staining for smooth muscle myosin heavy chain (smMHC, Myh11). DAPI stain (blue) marks nuclei. Scale bars 50μm.
3.4 Proliferation of iCMs was not Detected
To evaluate whether iCMs were proliferative, we performed immunocytochemistry for the proliferation marker Ki67 along with the cardiomyocyte marker cardiac Troponin T beginning on Day 0 and continuing for every other day until Day 14 (shown in supplemental Figure S5). Both GMT- and HNGMT-treated MEFs were analyzed. Although Ki67+ cells (presumably proliferating fibroblasts) could be detected for several days following factor induction, no Ki67+/cTnT+ cells were detected at any time point, suggesting that iCMs do not proliferate. Therefore, percentages of GCaMP+ cells at Day 14 post-induction are likely an underrepresentation of conversion efficiency given the continued proliferation of non-reprogrammed MEFs. Wells that began with 75,000 cells at initial plating contained an average of 2.04 × 10⁶ cells on Day 14 (across all reprogramming conditions).
3.5 Markers of Cardiac Progenitor Cells were not Detected in MEFs
Although MEFs were prepared from embryos following removal of the viscera, including the developing cardiovascular system, we considered the possibility that other embryonic tissues, such as the neural crest, might contribute migratory cardiac progenitors to the MEF population [36, 37]. We evaluated untreated MEFs for their expression of Isl1, a gene expressed by cardiac progenitor cells of both second heart field and neural crest origin [36], as well as Mesp1, a master regulator of cardiac cell fate [38], and Nkx2.5. None of these markers were detected via either quantitative RT-PCR (as shown in supplemental Figure S6) or immunocytochemistry (data not shown).
3.6 Analysis of iCM Stability upon Inactivation of Reprogramming Factors
To determine the stability of the reprogrammed iCM phenotype as well as the minimum duration of factor expression required to drive reprogramming, we examined the effect of turning off exogenous HNGMT at various timepoints. We compared continuous factor expression (in the continued presence of doxycycline) to doxycycline removal after 5, 10, and 15 days (Figure 4A). Although induction for 5 days was sufficient to generate GCaMP+ cells (0.6 ± 0.2% at Day 14 post-induction), functional iCMs could not be detected at later timepoints. This suggests that short-term factor expression produces cells that are only partially reprogrammed. With 10 or more days of factor induction, however, functional iCMs persisted after the inactivation of exogenous transcription factor expression. This was further demonstrated by immunostaining for sarcomeric α-actinin 28 days post-induction (Figure 4B). No iCMs with sarcomeric structure were detected in the condition with 5 days of HNGMT expression. Although 10 days of factor induction was sufficient to generate iCMs, the percentage of GCaMP+ cells in this condition declined over time, a trend not observed in cells that received 15 days of factor induction. GCaMP+, beating iCMs could still be found 3 weeks following doxycycline removal (shown in Figure 4C and supplemental Movie S6).
3.7 Microarray Analysis and Assessment of Genes that Encode the Excitation-Contraction Complex
To generate an enriched population of iCMs, we made use of the zeocin resistance gene present in the TroponinT-GCaMP reporter by adding zeocin to the culture medium on Day 14 post-induction and collecting RNA for microarray analysis on Day 21. Expression data for selected genes are presented in Figure 5A, with genes that are down-regulated relative to untransduced MEFs depicted in green and up-regulated genes in red. For all transcription factor combinations tested, expression of fibroblast genes [26] was down-regulated, consistent with the loss of fibroblast identity. All combinations also exhibited up-regulation of cardiomyocyte genes, with some of the highest expression levels detected in combinations that included Myocardin (DMT and DMNT). This is in agreement with a previous report of the effectiveness of DMT at up-regulating cardiomyocyte markers [3]. However, DMT and DMNT also showed substantial up-regulation of smooth muscle markers including smooth muscle myosin heavy chain (Myh11), transgelin (Sm22/Tagln), and calponin (Cnn1). As noted above, these results are indicative of the dual role of Myocardin in promoting both cardiomyocyte and smooth muscle cell fates.
To gain insight into the mechanism by which certain factor combinations produce greater numbers of functional iCMs, we examined the expression of genes encoding the complex set of proteins that mediate Ca2+ flux to couple excitation with contraction (a diagram of these proteins is presented as a visual aid in Figure 5B, adapted from [39] and [40]). Gene expression data obtained via microarray analysis was confirmed using quantitative RT-PCR and normalized to expression levels present in embryonic cardiomyocytes (E14.5). As shown in Figure 5C, key components of the excitation-contraction complex were expressed in iCMs. In particular, calsequestrin and phospholamban were most highly up-regulated in the transcription factor combinations that produced the largest percentages of functional iCMs (HGMT and HNGMT), with statistically significant increases versus GMT (p<0.05).
3.8 HNGMT Effectively Converts Adult Cardiac Fibroblasts to iCMs
Having established that HNGMT was the optimal factor combination for MEF reprogramming, we tested whether this method was also effective in adult mouse cardiac fibroblasts (aMCFs), cells that are the target of in vivo transdifferentiation strategies. HNGMT was compared to GMT and HGMT, two combinations that have been previously shown to convert cardiac fibroblasts to iCMs [1, 5]. As shown in Figure 6A, all three combinations successfully generated functional iCMs. HNGMT yielded the highest percentage of cells with GCaMP oscillation at Day 14 post-induction (4.5 ± 0.3%), a statistically significant increase over both GMT (p = 9.1e−5) and HGMT (p = 0.017). A typical beating, GCaMP+ iCM derived from aMCFs is shown in Figure 6B and supplemental Movie S7. As was the case in MEF-derived iCMs, aMCF-derived iCMs exhibit robust expression of cardiomyocyte markers cTnT, α-MHC, and α-actinin, with sarcomeric organization (Figure 6C and 6D). Putative smooth muscle cells (determined by immunostaining for smMHC) were also detected (Figure 6D).
4. Discussion and Conclusions
Our work demonstrates a robust, convenient method for the quantification of fibroblast reprogramming to functional cardiomyocytes. The TroponinT-GCaMP reporter is scalable; it can be used to monitor calcium oscillations in a single cell or to evaluate the functionality of thousands of cells simultaneously. Calcium activity cannot be directly equated to spontaneous contraction – although every contracting iCM exhibited GCaMP oscillation, not every GCaMP positive cell is overtly contracting. Cells may begin to cycle calcium before excitation-contraction coupling or sarcomere assembly are complete. It is therefore most accurate to consider calcium oscillation to be a functional outcome measure in its own right. Since it requires an orchestrated process involving multiple proteins, it is a more stringent measure than the activation of a single gene or marker. Our technique allows for quantitative comparisons between different protocols in a mid-throughput system.
The present study focused on mouse embryonic fibroblasts; future work will determine whether the HNGMT combination is effective at direct in situ reprogramming of cardiac fibroblasts. The finding that iCMs remain stably reprogrammed long after the removal of exogenous reprogramming factors is encouraging. The minimum requirement of approximately ten days of factor expression to effect reprogramming is consistent with reports of transdifferentiation to other cell types [13, 41]. However, it is also evident that short-term exposure to reprogramming factors can produce unstable cells that are not fully converted. Furthermore, the beating iCMs generated in this study are likely immature, given that adult cardiomyocytes do not beat spontaneously in cell culture [42–44]. These findings raise potential concerns for the safety of in vivo reprogramming strategies that will need to be evaluated. Future work will determine whether iCMs generated both in vitro and in vivo can undergo maturation to adult cardiomyocytes. It will also be important to identify the subtype of iCMs (i.e. atrial, ventricular, or nodal) and investigate whether different combinations of reprogramming factors produce iCMs of different subtypes. Interestingly, the shape of GCaMP traces appears to be slightly different in embryonic cardiomyocytes isolated from atria and ventricles. It will be necessary to combine GCaMP phenotyping with electrophysiology to determine whether cardiomyocyte subtypes can be identified by calcium traces alone.
Consistent with a previous study of reprogramming in MEFs [3], factor combinations that included Myocardin exhibited substantial upregulation of cardiomyocyte markers. However, very little calcium oscillation was detected and immunostaining revealed simultaneous expression of cardiomyocyte and smooth muscle proteins in virtually all putative iCMs. It is possible that the concurrent expression of cardiomyocyte and smooth muscle transcriptional programs prevents either cell fate from being fully adopted. Indeed, ectopic expression of Myocardin alone has been shown to simultaneously activate transcription of both cardiomyocyte and smooth muscle genes [45]. Since smooth muscle cells also exhibit calcium oscillations [17], we cannot rule out the possibility that the GCaMP activity seen in cells treated with DMT and DMNT is consistent with a smooth muscle, rather than cardiomyocyte, phenotype. It is likely that reprogramming strategies using Myocardin will require active suppression of the smooth muscle phenotype in order to produce functional iCMs.
Previous publications reported an inhibitory role of Nkx2.5 in screens for cardiac reprogramming factors [1, 5]. Since the great majority of iCMs generated in these screens were not functional (i.e. not beating), it is conceivable that Nkx2.5 may decrease the overall number of cells that express a given marker while increasing the proportion that are functional. Although we demonstrated the effectiveness of HNGMT in both MEFs and adult mouse cardiac fibroblasts, it may still be the case that different cell types - or cells from different species - are most effectively reprogrammed by differing sets of factors. This could be due to the presence or absence of endogenous cofactors, the relative accessibility of crucial regions of chromatin, or differences in proliferative capacity and metabolic state among cell sources. Given the array of variables, the ability to quantify functional iCMs will be essential to the advancement of the field.
Supplementary Material
Highlights.
TroponinT-GCaMP calcium reporter allows quantification of functional cardiomyocytes
This report is the first to screen reprogramming methods for functional outcome
The 5-factor combination HNGMT transdifferentiates MEFs into induced cardiomyocytes
iCMs remain functional for weeks following removal of reprogramming factors
HNGMT also effectively converts adult mouse cardiac fibroblasts to iCMs
Acknowledgments
Sources of Funding
NIH U01 HL100405; American Heart Association – Jon Holden DeHaan Foundation Cardiac Myogenesis Research Center; Pennsylvania Health Research Formula Fund. S.R. holds a Career Award for Medical Scientists from the Burroughs Wellcome Fund and NIH K08 HL107449. This project is funded, in part, under a grant with the Pennsylvania Department of Health. The Department specifically disclaims responsibility for any analyses, interpretations or conclusions.
Glossary
- aMCFs
adult mouse cardiac fibroblasts
- α-MHC
alpha-myosin heavy chain
- cTnT
cardiac Troponin T
- GCaMP
genetically encoded calcium indicator, composite of GFP and CaM
- GECI
genetically encoded calcium indicator
- iCM
induced cardiomyocyte
- IFU/mL
infectious units per milliliter
- MEFs
mouse embryonic fibroblasts
- rtTA
reverse tetracycline transactivator
- smMHC
smooth muscle myosin heavy chain
Footnotes
Disclosures
None
Publisher's Disclaimer: This is a PDF file of an unedited manuscript that has been accepted for publication. As a service to our customers we are providing this early version of the manuscript. The manuscript will undergo copyediting, typesetting, and review of the resulting proof before it is published in its final citable form. Please note that during the production process errors may be discovered which could affect the content, and all legal disclaimers that apply to the journal pertain.
References
- 1.Ieda M, Fu JD, Delgado-Olguin P, Vedantham V, Hayashi Y, Bruneau BG, et al. Direct reprogramming of fibroblasts into functional cardiomyocytes by defined factors. Cell. 2010;142:375–86. doi: 10.1016/j.cell.2010.07.002. [DOI] [PMC free article] [PubMed] [Google Scholar]
- 2.Jayawardena TM, Egemnazarov B, Finch EA, Zhang L, Payne JA, Pandya K, et al. MicroRNA-mediated in vitro and in vivo direct reprogramming of cardiac fibroblasts to cardiomyocytes. Circ Res. 2012;110:1465–73. doi: 10.1161/CIRCRESAHA.112.269035. [DOI] [PMC free article] [PubMed] [Google Scholar]
- 3.Protze S, Khattak S, Poulet C, Lindemann D, Tanaka EM, Ravens U. A new approach to transcription factor screening for reprogramming of fibroblasts to cardiomyocyte-like cells. J Mol Cell Cardiol. 2012 doi: 10.1016/j.yjmcc.2012.04.010. [DOI] [PubMed] [Google Scholar]
- 4.Qian L, Huang Y, Spencer CI, Foley A, Vedantham V, Liu L, et al. In vivo reprogramming of murine cardiac fibroblasts into induced cardiomyocytes. Nature. 2012;485:593–8. doi: 10.1038/nature11044. [DOI] [PMC free article] [PubMed] [Google Scholar]
- 5.Song K, Nam YJ, Luo X, Qi X, Tan W, Huang GN, et al. Heart repair by reprogramming non-myocytes with cardiac transcription factors. Nature. 2012;485:599–604. doi: 10.1038/nature11139. [DOI] [PMC free article] [PubMed] [Google Scholar]
- 6.Chen JX, Krane M, Deutsch MA, Wang L, Rav-Acha M, Gregoire S, et al. Inefficient reprogramming of fibroblasts into cardiomyocytes using gata4, mef2c, and tbx5. Circ Res. 2012;111:50–5. doi: 10.1161/CIRCRESAHA.112.270264. [DOI] [PMC free article] [PubMed] [Google Scholar]
- 7.Chien KR, Yi BA, Xu H, Mummery CL. Cardiomyocyte reprogramming and the new age of cellular alchemy. J Mol Cell Cardiol. 2012;53:311–3. doi: 10.1016/j.yjmcc.2012.06.010. [DOI] [PubMed] [Google Scholar]
- 8.McCombs JE, Palmer AE. Measuring calcium dynamics in living cells with genetically encodable calcium indicators. Methods. 2008;46:152–9. doi: 10.1016/j.ymeth.2008.09.015. [DOI] [PMC free article] [PubMed] [Google Scholar]
- 9.Zhao Y, Araki S, Wu J, Teramoto T, Chang YF, Nakano M, et al. An expanded palette of genetically encoded Ca(2)(+) indicators. Science. 2011;333:1888–91. doi: 10.1126/science.1208592. [DOI] [PMC free article] [PubMed] [Google Scholar]
- 10.Grienberger C, Konnerth A. Imaging calcium in neurons. Neuron. 2012;73:862–85. doi: 10.1016/j.neuron.2012.02.011. [DOI] [PubMed] [Google Scholar]
- 11.Tian L, Hires SA, Mao T, Huber D, Chiappe ME, Chalasani SH, et al. Imaging neural activity in worms, flies and mice with improved GCaMP calcium indicators. Nat Methods. 2009;6:875–81. doi: 10.1038/nmeth.1398. [DOI] [PMC free article] [PubMed] [Google Scholar]
- 12.Hires SA, Tian L, Looger LL. Reporting neural activity with genetically encoded calcium indicators. Brain Cell Biol. 2008;36:69–86. doi: 10.1007/s11068-008-9029-4. [DOI] [PMC free article] [PubMed] [Google Scholar]
- 13.Addis RC, Hsu FC, Wright RL, Dichter MA, Coulter DA, Gearhart JD. Efficient conversion of astrocytes to functional midbrain dopaminergic neurons using a single polycistronic vector. PLoS One. 2011;6:e28719. doi: 10.1371/journal.pone.0028719. [DOI] [PMC free article] [PubMed] [Google Scholar]
- 14.Akerboom J, Chen TW, Wardill TJ, Tian L, Marvin JS, Mutlu S, et al. Optimization of a GCaMP Calcium Indicator for Neural Activity Imaging. J Neurosci. 2012;32:13819–40. doi: 10.1523/JNEUROSCI.2601-12.2012. [DOI] [PMC free article] [PubMed] [Google Scholar]
- 15.Chen Q, Cichon J, Wang W, Qiu L, Lee SJ, Campbell NR, et al. Imaging neural activity using Thy1-GCaMP transgenic mice. Neuron. 2012;76:297–308. doi: 10.1016/j.neuron.2012.07.011. [DOI] [PMC free article] [PubMed] [Google Scholar]
- 16.Pologruto TA, Yasuda R, Svoboda K. Monitoring neural activity and [Ca2+] with genetically encoded Ca2+ indicators. J Neurosci. 2004;24:9572–9. doi: 10.1523/JNEUROSCI.2854-04.2004. [DOI] [PMC free article] [PubMed] [Google Scholar]
- 17.Ji G, Feldman ME, Deng KY, Greene KS, Wilson J, Lee JC, et al. Ca2+-sensing transgenic mice: postsynaptic signaling in smooth muscle. J Biol Chem. 2004;279:21461–8. doi: 10.1074/jbc.M401084200. [DOI] [PubMed] [Google Scholar]
- 18.Tallini YN, Ohkura M, Choi BR, Ji G, Imoto K, Doran R, et al. Imaging cellular signals in the heart in vivo: Cardiac expression of the high-signal Ca2+ indicator GCaMP2. Proc Natl Acad Sci U S A. 2006;103:4753–8. doi: 10.1073/pnas.0509378103. [DOI] [PMC free article] [PubMed] [Google Scholar]
- 19.Shiba Y, Fernandes S, Zhu WZ, Filice D, Muskheli V, Kim J, et al. Human ES-cell-derived cardiomyocytes electrically couple and suppress arrhythmias in injured hearts. Nature. 2012;489:322–5. doi: 10.1038/nature11317. [DOI] [PMC free article] [PubMed] [Google Scholar]
- 20.Takahashi K, Yamanaka S. Induction of pluripotent stem cells from mouse embryonic and adult fibroblast cultures by defined factors. Cell. 2006;126:663–76. doi: 10.1016/j.cell.2006.07.024. [DOI] [PubMed] [Google Scholar]
- 21.Davis RL, Weintraub H, Lassar AB. Expression of a single transfected cDNA converts fibroblasts to myoblasts. Cell. 1987;51:987–1000. doi: 10.1016/0092-8674(87)90585-x. [DOI] [PubMed] [Google Scholar]
- 22.Vierbuchen T, Ostermeier A, Pang ZP, Kokubu Y, Sudhof TC, Wernig M. Direct conversion of fibroblasts to functional neurons by defined factors. Nature. 2010;463:1035–41. doi: 10.1038/nature08797. [DOI] [PMC free article] [PubMed] [Google Scholar]
- 23.Caiazzo M, Dell’anno MT, Dvoretskova E, Lazarevic D, Taverna S, Leo D, et al. Direct generation of functional dopaminergic neurons from mouse and human fibroblasts. Nature. 2011 doi: 10.1038/nature10284. [DOI] [PubMed] [Google Scholar]
- 24.Kim J, Efe JA, Zhu S, Talantova M, Yuan X, Wang S, et al. Direct reprogramming of mouse fibroblasts to neural progenitors. Proc Natl Acad Sci U S A. 2011;108:7838–43. doi: 10.1073/pnas.1103113108. [DOI] [PMC free article] [PubMed] [Google Scholar]
- 25.Feng R, Desbordes SC, Xie H, Tillo ES, Pixley F, Stanley ER, et al. PU.1 and C/EBPalpha/beta convert fibroblasts into macrophage-like cells. Proc Natl Acad Sci U S A. 2008;105:6057–62. doi: 10.1073/pnas.0711961105. [DOI] [PMC free article] [PubMed] [Google Scholar]
- 26.Huang P, He Z, Ji S, Sun H, Xiang D, Liu C, et al. Induction of functional hepatocyte-like cells from mouse fibroblasts by defined factors. Nature. 2011;475:386–9. doi: 10.1038/nature10116. [DOI] [PubMed] [Google Scholar]
- 27.Sekiya S, Suzuki A. Direct conversion of mouse fibroblasts to hepatocyte-like cells by defined factors. Nature. 2011;475:390–3. doi: 10.1038/nature10263. [DOI] [PubMed] [Google Scholar]
- 28.Buganim Y, Itskovich E, Hu YC, Cheng AW, Ganz K, Sarkar S, et al. Direct Reprogramming of Fibroblasts into Embryonic Sertoli-like Cells by Defined Factors. Cell Stem Cell. 2012;11:373–86. doi: 10.1016/j.stem.2012.07.019. [DOI] [PMC free article] [PubMed] [Google Scholar]
- 29.Efe JA, Hilcove S, Kim J, Zhou H, Ouyang K, Wang G, et al. Conversion of mouse fibroblasts into cardiomyocytes using a direct reprogramming strategy. Nat Cell Biol. 2011;13:215–22. doi: 10.1038/ncb2164. [DOI] [PubMed] [Google Scholar]
- 30.Rentschler S, Yen AH, Lu J, Petrenko NB, Lu MM, Manderfield LJ, et al. Myocardial Notch signaling reprograms cardiomyocytes to a conduction-like phenotype. Circulation. 2012;126:1058–66. doi: 10.1161/CIRCULATIONAHA.112.103390. [DOI] [PMC free article] [PubMed] [Google Scholar]
- 31.Kita-Matsuo H, Barcova M, Prigozhina N, Salomonis N, Wei K, Jacot JG, et al. Lentiviral vectors and protocols for creation of stable hESC lines for fluorescent tracking and drug resistance selection of cardiomyocytes. PLoS One. 2009;4:e5046. doi: 10.1371/journal.pone.0005046. [DOI] [PMC free article] [PubMed] [Google Scholar]
- 32.Kattman SJ, Witty AD, Gagliardi M, Dubois NC, Niapour M, Hotta A, et al. Stage-specific optimization of activin/nodal and BMP signaling promotes cardiac differentiation of mouse and human pluripotent stem cell lines. Cell Stem Cell. 2011;8:228–40. doi: 10.1016/j.stem.2010.12.008. [DOI] [PubMed] [Google Scholar]
- 33.Fridlianskaia II, Goncharova EI, Borisov AB, Krylova TA, Pinaev GP. Monoclonal antibodies to the muscle isoform of alpha-actinin--a marker for the study of the differentiation of skeletal and cardiac muscles. Tsitologiia. 1989;31:1234–7. [PubMed] [Google Scholar]
- 34.Miano JM, Cserjesi P, Ligon KL, Periasamy M, Olson EN. Smooth muscle myosin heavy chain exclusively marks the smooth muscle lineage during mouse embryogenesis. Circ Res. 1994;75:803–12. doi: 10.1161/01.res.75.5.803. [DOI] [PubMed] [Google Scholar]
- 35.Wang Z, Wang DZ, Pipes GC, Olson EN. Myocardin is a master regulator of smooth muscle gene expression. Proc Natl Acad Sci U S A. 2003;100:7129–34. doi: 10.1073/pnas.1232341100. [DOI] [PMC free article] [PubMed] [Google Scholar]
- 36.Engleka KA, Manderfield LJ, Brust RD, Li L, Cohen A, Dymecki SM, et al. Islet1 derivatives in the heart are of both neural crest and second heart field origin. Circ Res. 2012;110:922–6. doi: 10.1161/CIRCRESAHA.112.266510. [DOI] [PMC free article] [PubMed] [Google Scholar]
- 37.Morikawa Y, Cserjesi P. Cardiac neural crest expression of Hand2 regulates outflow and second heart field development. Circ Res. 2008;103:1422–9. doi: 10.1161/CIRCRESAHA.108.180083. [DOI] [PubMed] [Google Scholar]
- 38.Bondue A, Lapouge G, Paulissen C, Semeraro C, Iacovino M, Kyba M, et al. Mesp1 acts as a master regulator of multipotent cardiovascular progenitor specification. Cell Stem Cell. 2008;3:69–84. doi: 10.1016/j.stem.2008.06.009. [DOI] [PubMed] [Google Scholar]
- 39.Bers DM. Cardiac excitation-contraction coupling. Nature. 2002;415:198–205. doi: 10.1038/415198a. [DOI] [PubMed] [Google Scholar]
- 40.Dulhunty AF. Excitation-contraction coupling from the 1950s into the new millennium. Clin Exp Pharmacol Physiol. 2006;33:763–72. doi: 10.1111/j.1440-1681.2006.04441.x. [DOI] [PubMed] [Google Scholar]
- 41.Stadtfeld M, Maherali N, Breault DT, Hochedlinger K. Defining molecular cornerstones during fibroblast to iPS cell reprogramming in mouse. Cell Stem Cell. 2008;2:230–40. doi: 10.1016/j.stem.2008.02.001. [DOI] [PMC free article] [PubMed] [Google Scholar]
- 42.DeHaan RL, Gottlieb SH. The electrical activity of embryonic chick heart cells isolated in tissue culture singly or in interconnected cell sheets. J Gen Physiol. 1968;52:643–65. doi: 10.1085/jgp.52.3.643. [DOI] [PMC free article] [PubMed] [Google Scholar]
- 43.Rapila R, Korhonen T, Tavi P. Excitation-contraction coupling of the mouse embryonic cardiomyocyte. J Gen Physiol. 2008;132:397–405. doi: 10.1085/jgp.200809960. [DOI] [PMC free article] [PubMed] [Google Scholar]
- 44.Satin J, Kehat I, Caspi O, Huber I, Arbel G, Itzhaki I, et al. Mechanism of spontaneous excitability in human embryonic stem cell derived cardiomyocytes. J Physiol. 2004;559:479–96. doi: 10.1113/jphysiol.2004.068213. [DOI] [PMC free article] [PubMed] [Google Scholar]
- 45.van Tuyn J, Knaan-Shanzer S, van de Watering MJ, de Graaf M, van der Laarse A, Schalij MJ, et al. Activation of cardiac and smooth muscle-specific genes in primary human cells after forced expression of human myocardin. Cardiovasc Res. 2005;67:245–55. doi: 10.1016/j.cardiores.2005.04.013. [DOI] [PubMed] [Google Scholar]
Associated Data
This section collects any data citations, data availability statements, or supplementary materials included in this article.