Abstract
OBJECTIVE
The lower-order visual cortex in the medial-occipital region is suggested to send feed-forward signals to the higher-order visual cortex including ventral-occipital-temporal and dorsal-occipital regions. We determined how stimulation-elicited cortical-signals propagate between lower- and higher-order visual cortices, and whether the magnitudes of stimulation-elicited cortical-signals recorded in the higher-order visual cortex differed from those recorded in the lower-order one.
METHODS
We studied 10 patients with focal epilepsy who underwent extraoperative electrocorticography recording. Trains of 1-Hz stimuli with an intensity of 3 mA were delivered to an electrode pair within the medial-occipital region; then, cortico-cortical evoked-potential (CCEP) and stimulation-elicited gamma-activity at 80–150 Hz were measured in the ventral-occipital-temporal and dorsal-occipital regions. Likewise, CCEP and stimulation-elicited gamma-activity, driven by stimuli within the higher-order visual cortex, were measured in the lower-order visual cortex.
RESULTS
CCEPs generated, via feed-forward propagations, in the higher-order visual cortex were significantly larger than those generated, via feed-back propagations, in the lower-order visual cortex. Stimulation of the lower-order visual cortex elicited augmentation of gamma-activity in the higher-order visual cortex after the preceding CCEP subsided.
CONCLUSIONS
The propagation manners of stimulation-elicited cortical-signals differ between feed-forward and feed-back directions in the human occipital lobe.
SIGNIFICANCE
Such difference may need to be taken into consideration for future clinical application of CCEPs and stimulation-elicited gamma-augmentation in presurgical evaluation for epilepsy surgery.
Keywords: Epilepsy surgery, High-frequency oscillations (HFOs), Ripples, Functional connectivity, Intracranial recording
INTRODUCTION
The medial-occipital region, functioning as the lower-order (or primary) visual cortex, receives inputs from the lateral geniculate nucleus and codes visual information in a retinotopically organized way (Conturo et al., 1999; Schneider et al., 2004; Logothesis et al., 2010). Subsequent projection from the medial-occipital region to the ventral-occipital-temporal region is generally known as the ventral visual stream, whereas that to the dorsal-occipital region consists of a part of the dorsal visual stream (Mishkin and Ungerleider, 1982; Schroeder et al., 1998; Wandell et al., 2007). The ventral visual stream plays an essential role in object recognition while the dorsal visual stream in processing of location information (Mishkin and Ungerleider, 1982; Goodale and Milner, 1992). Although functional specialization of these occipital regions has been extensively described in previous studies of humans and non-human primates (Wandell et al., 2007), functional connectivity across the human occipital regions (beyond anatomical connectivity) has not been fully understood.
In the present study using intracranial recording in patients with focal epilepsy, we, for the first time, determined whether electrical stimulation-elicited cortical signals bi-directionally propagate across human occipital regions, by measuring cortico-cortical evoked potential (CCEP; Matsumoto et al., 2004) and stimulation-elicited gamma-activity recorded at non-epileptic occipital sites. Based on the results of single neuron recording (Logothetis et al., 2010; Alarcón et al., 2012), it has been hypothesized that CCEPs may reflect very short excitation (possibly obscured by electrical stimulation artifacts) and subsequent long-lasting inhibition (100–300 msec). Augmentation of gamma activity is generally considered to reflect cortical activation, since it is associated with increased spiking rates in single neuron recording (Ray et al., 2008) and increased blood-oxygen-level-dependent (BOLD) responses in functional MRI (fMRI) (Niessing et al., 2005; Scheeringa et al., 2011). Furthermore, resection of the sites showing event-related gamma-augmentation frequently results in functional deficits (Kojima et al., 2012). Our previous study of the effect of photic stimulation on cortical activity revealed that the earliest and largest amplitude augmentation involved the gamma band at 80–150 Hz in the medial-occipital region (Matsuzaki et al., 2012).
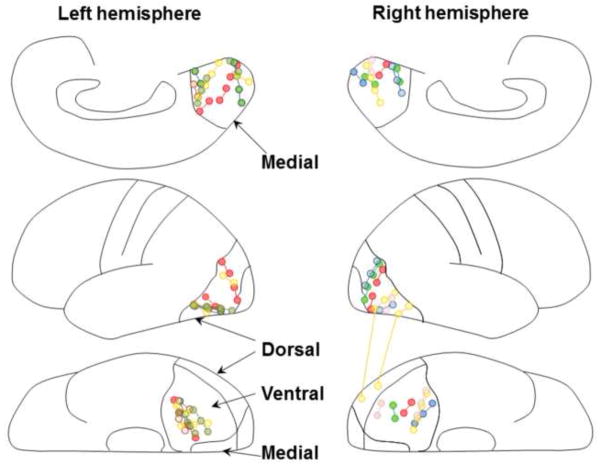
The advantages of measuring stimulation-elicited cortical signals on electrocorticography (ECoG) include capability to evaluate: (a) the deep cortical structures with a spatial resolution of 1 cm, (b) directional dependence in signal propagation with a temporal resolution of millisecond order, and (c) propagation patterns not affected by visual attention or awareness modulated by exposure to external visual stimuli. We tested the functional connectivity between two of the following three regions: (i) the medial-occipital region (defined as the medial portion of Brodmann Area [BA] 17/18; Matsuzaki et al., 2012), (ii) the ventral-occipital-temporal region (ventral portion of BA 19/37), and (iii) the dorsal-occipital region (lateral portion of BA 19/37) (Figure 1).
Figure 1. Subdural electrode placement.
The locations of subdural electrodes in 10 patients were superimposed on a brain template (Matsuzaki et al., 2012). The electrodes were implanted on the left hemisphere in five patients and on the right hemisphere in the remaining five (Table 1). The upper panels show the stimulated pairs in the medial-occipital regions; the middle panels show those in the dorsal-occipital regions; the lower panels show those in the ventral-occipital-temporal regions. Each electrode pair is color-coded based on a given patient. All stimulating and recording sites are shown.
We hypothesized that stimulation of an electrode pair within the medial-occipital region would elicit CCEPs and augmentation of stimulation-elicited gamma-activity in the ventral-occipital-temporal and dorsal-occipital regions (defined as the higher-order visual regions in the present study). We also hypothesized that stimulation of a pair within the ventral-occipital-temporal or dorsal-occipital region would likewise elicit responses in the medial-occipital region. Tracer studies of monkeys have suggested the anatomical and mostly reciprocal connectivity between the lower- and higher-order visual regions (Felleman and Van Essen, 1991). We finally determined whether CCEPs and stimulation-elicited gamma-activity propagating in feed-forward directions (lower → higher-order visual region) differed from those propagating in feedback directions (higher → lower-order visual region). In the present study, electrical stimuli of same intensity were systematically employed, and the averaged distance between stimulus and recording sites was the same between directions in propagation.
METHODS
Patients
Patients were selected by using the following inclusion criteria: (i) a history of focal epilepsy scheduled for extraoperative subdural ECoG recording as part of the presurgical evaluation at Children’s Hospital of Michigan, Detroit, between May 2011 and June 2012, (ii) ECoG sampling involving the occipital lobe and (iii) measurement of the amplitudes of CCEP and stimulation-elicited gamma-activity in the aforementioned occipital regions. The exclusion criteria consisted of: (i) presence of brain malformations involving the occipital lobe, and (ii) visual field deficits detected by confrontation. We studied a consecutive series of 10 patients (age: 3–17 years) satisfying all criteria (Table 1). This study has been approved by the Institutional Review Board at Wayne State University, and written informed consent was obtained from the legal parent or guardian of a given patient.
Table 1.
Patient Profile.
| Number of sampled sites | |||||||
|---|---|---|---|---|---|---|---|
| Patient number | Age at surgery | Antiepileptic medications | Seizure onset zone | Sampled hemisphere | Medial- occipital region | Ventral- temporal region | Dorsal- occipital region |
| 1 | 14 | LEV, OXC, LCM | Not available* | Left | 6 | 4 | 6 |
| 2 | 14 | OXC, PHT | Right Temporal | Right | 2 | 2 | 4 |
| 3 | 8 | CBZ, LCM | Right Frontal | Right | 4 | 2 | 4 |
| 4 | 10 | OXC, VPA, LCM | Right Parietal | Right | 5 | 3 | 5 |
| 5 | 9 | LEV, OXC | Left Parietal | Left | 6 | 3 | 3 |
| 6 | 12 | OXC, LEV, VPA | Left Temporal | Left | 2 | 4 | 3 |
| 7 | 3 | LEV, LMG | Left Parietal & Frontal | Left | 6 | 5 | 4 |
| 8 | 9 | LMG, TPM | Left Temporal | Left | 5 | 6 | 4 |
| 9 | 17 | LCM, LEV | Right Temporal | Right | 4 | 4 | 7 |
| 10 | 15 | LMG, ZNS, LEV | Right Temporal | Right | 2 | 5 | 2 |
Lesionectomy (left parietal lesion) was performed. CBZ: carbamazepine, LCM: lacosamide, LEV: levetiracetam, LMG: lamotrigine, OXC: oxcarbazepine, PHT: phenytoin, VPA: valproate, TPM: topiramate, ZNS: zonisamide.
Subdural electrode placement and video-ECoG recording
Subdural platinum grid and strip electrodes (10-mm inter-contact distance; 4-mm diameter) were placed as previously described (Asano et al., 2009). Electrode placement involved all four lobes in one hemisphere, and the total number of analyzed electrodes ranged from 104 to 144. All electrode plates were stitched to adjacent plates or the edge of dura mater, to avoid movement of subdural electrodes after placement. Extraoperative video-ECoG recordings were obtained for 3 to 5 days, using a 192-channel Nihon Kohden Neurofax 1100A Digital System (Nihon Kohden America Inc., Foothill Ranch, CA, USA) at a sampling frequency of 1,000 Hz and an amplifier band pass of 0.08 to 300 Hz. The averaged voltage of ECoG signals derived from the fifth and sixth intracranial electrodes of the ECoG amplifier was used as the original reference (Wu et al., 2011). ECoG signals were then re-montaged to a common average reference (Sinai et al., 2005; Wu et al., 2011). Channels contaminated with artifacts or large interictal epileptiform discharges were excluded from the common average reference.
Coregistration of electrodes on individual three-dimensional volumetric MRI was previously described (Muzik et al., 2007; Alkonyi et al., 2009; Wu et al., 2011); spatial accuracy was confirmed by intraoperative digital photographs showing in situ electrode locations (Dalal et al., 2008). Sites showing either seizure onset or interictal spike discharges (Asano et al., 2009) were excluded from the subsequent analysis.
Stimulus protocol
During extraoperative ECoG monitoring, trains of electrical stimuli were delivered to a contiguous pair of subdural electrodes within one of the three occipital regions (Figure 1) at a frequency of 1 Hz for 10 seconds (Grass S88 stimulator: Astro-Med, Inc, West Warwick, RI). A small number of stimuli were employed to minimize the patient participation time. Each electrical stimulus consisted of a square wave pulse of 0.3 ms duration, 3 mA intensity, and biphasic polarity. Such a systematic application of stimuli with fixed parameters allowed us to quantitatively determine directional dependence in discharge propagation (Goldring et al., 1994; Rosenberg et al., 2009). The employed stimulus intensity was even smaller than those reported to be safe (Valentin et al., 2002; Matsumoto et al., 2004; Koubeissi et al., 2012).
A total of 25 pairs within the medial-occipital region (range: 1 to 4 pairs per patient; median: 3 pairs), 23 pairs within the ventral-occipital-temporal region (range: 1 to 4 pairs per patient; median: 2 pairs), and 25 pairs within the dorsal-occipital region (range: 1 to 5 pairs per patient; median: 2 pairs) were stimulated. The order of stimulation sites across three occipital regions was counterbalanced within and between subjects. The patients were comfortably lying on the bed while closing the eyes in a dimly lit room. No clinical symptoms (such as phosphenes) were elicited by electrical stimulation. No adverse effects (such as after-discharges or pain) were noted.
Measurement of cortico-cortical evoked potential (CCEP)
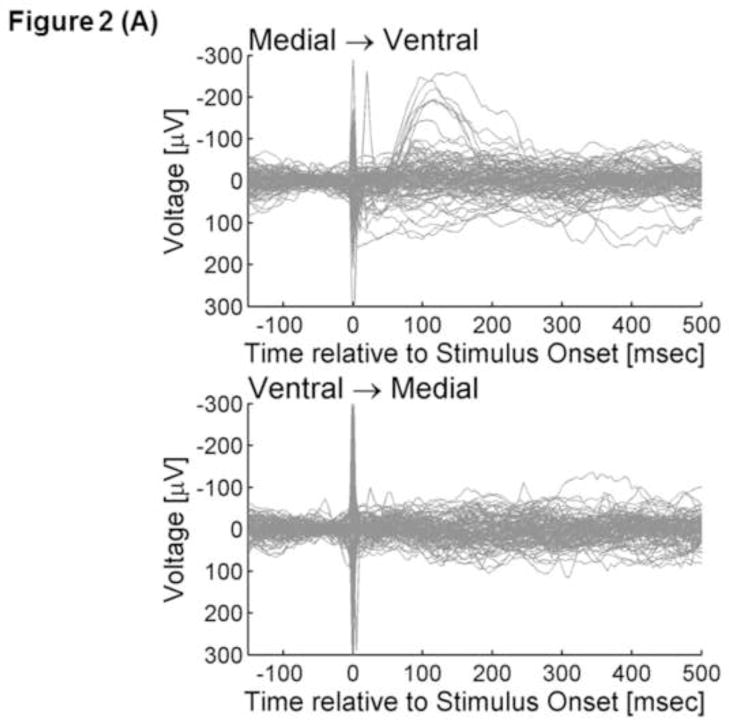
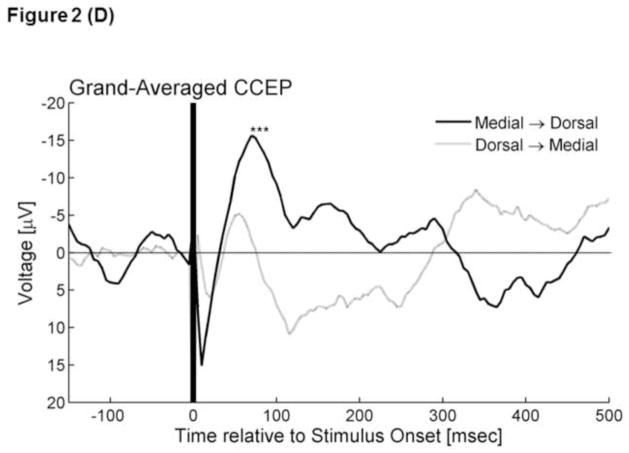
ECoG signals were averaged time-locked to the onset of each electrical stimulus with a time window of −100 to +500 ms with a low-frequency filter of 1.0 Hz and high-frequency filter of 300 Hz (Figures 2A and 2B). Averaged ECoG signals were further grand-averaged within each of the three occipital regions according to the stimulated occipital region. Thereby, we incorporated CCEPs recorded at least 2 cm away from the stimulus site, in order to minimize the effects of stimulation artifacts (Swann et al., 2012). The aforementioned procedures yielded a total of four grand-averaged CCEPs (Figure 2C and 2D). The grand-averaged CCEP in the ventral-occipital-temporal region consisted of 98 individual CCEPs (980 trials) recorded at 38 ventral-occipital-temporal sites, with each CCEP elicited via propagation in feed-forward directions; such a grand-average measure will be referred to as ‘grand-averaged CCEPmedial→ventral’ in the following text. Subsequently, ‘grand-averaged CCEPmedial→dorsal were calculated by grand-averaging 111 CCEPs recorded at 42 dorsal-occipital sites. Likewise, ‘grand-averaged CCEPventral→medial’ and ‘grand-averaged CCEPdorsal→medial’ were calculated, by grand-averaging CCEPs recoded in 42 medial-occipital sites.
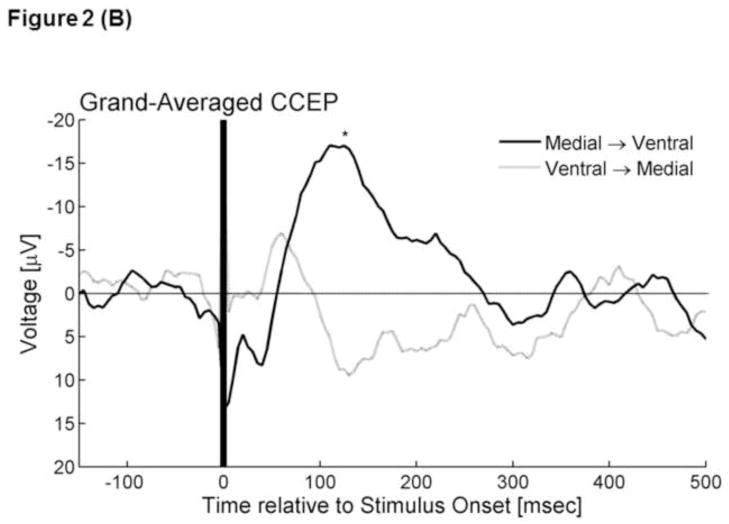
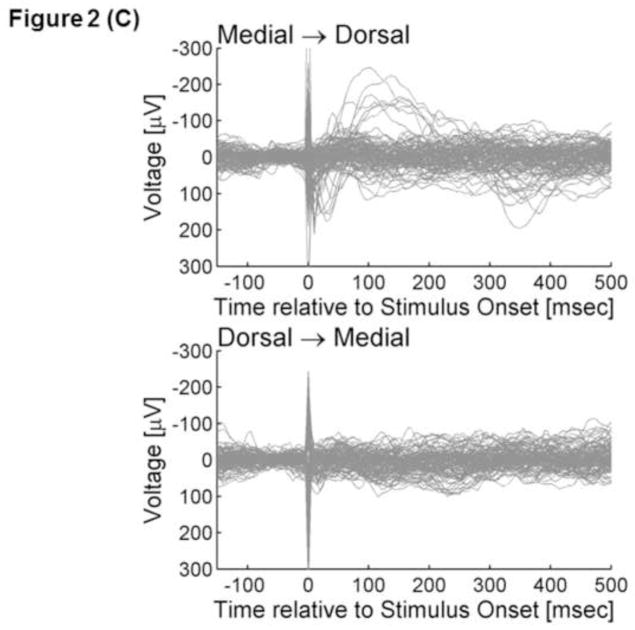
Figure 2. Cortico-cortical evoked potentials (CCEPs).
(A) The upper panel superimposes all individual traces of CCEPmedial→ventral, while the lower shows all CCEPventral→medial. Stimulus artifacts are noted at the onset of electrical stimulus (at 0 ms). (B) The black line represents ‘grand-averaged CCEPmedial→ventral’, while the gray line represents ‘grand-averaged CCEPventral→medial’. *: At 130 ms after the stimulus onset, the voltage of CCEPmedial→ventral became significantly larger than the voltage of CCEPventral→medial.
(C) The upper panel superimposes all individual traces of CCEPmedial→dorsal, while the lower shows all CCEPdorsal→medial. (D) The black line represents ‘grand-averaged CCEPmedial→dorsal’, while the gray line represents ‘grand-averaged CCEPdorsal→medial’. *: At 70–85 ms after the stimulus onset, the voltage of CCEPmedial→dorsal became significantly larger than the voltage of CCEPdorsal→medial.
Measurement of stimulation-elicited gamma-activity
We determined the temporal dynamics of gamma-amplitudes at 80–150 Hz following electrical stimulation, using a previously validated method (Wu et al., 2011; Matsuzaki et al., 2012). Each ECoG trial containing a stimulus was transformed into the time–frequency domain using a complex demodulation technique (Papp and Ktonas, 1977) incorporated in BESA® EEG V.5.1.8 software (BESA GmbH, Gräfelfing, Germany; Hoechstetter et al., 2004). The time–frequency transform was obtained by multiplication of the time-domain signal with a complex exponential, followed by a low-pass filter. The low-pass filter used here was a finite impulse response filter of Gaussian shape, making the complex demodulation effectively equivalent to a Gabor transform. The filter had a full width at half maximum of 2 × 7.9 ms in the temporal domain and 2 × 14.2 Hz in the frequency domain. The corresponding time-frequency resolution was ±7.9 ms and ±14.2 Hz (defined as the 50% power drop of the finite impulse response filter). A given ECoG signal was assigned an amplitude (a measure proportional to the square root of power) as a function of time and frequency at each trial. Time–frequency transformation was performed for frequencies between 80 and 150 Hz and latencies between −150 and 500 ms relative to the onset of electrical stimulation, in steps of 10 Hz and 5 ms. At each time-frequency bin, we analyzed the percent change in amplitude (averaged across 10 trials) relative to the mean amplitude in a reference period at −150 and −100 ms relative to the stimulation. Such a change in amplitude has been termed “temporal spectral evolution” (TSE) (Salmelin and Hari, 1994). In the present study, we did not differentiate between phase-locked and non-phase-locked components (Crone et al., 2006) of TSE values.
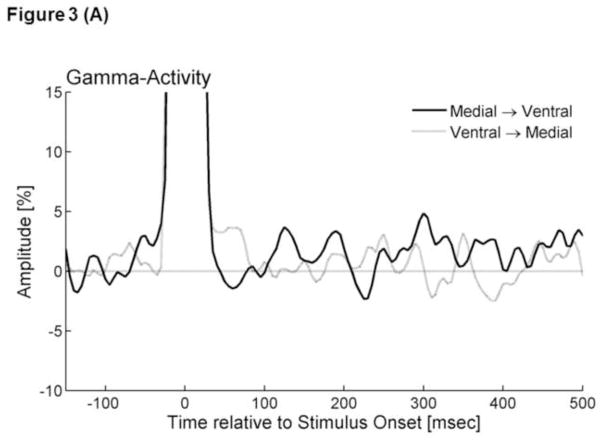
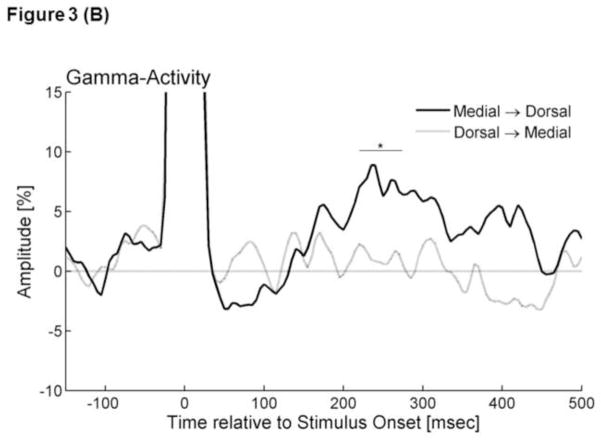
The aforementioned procedures allowed us to evaluate how stimulation-elicited gamma-activity was altered as a function of time at each occipital site. We then calculated the grand-averaged percent change of stimulation-elicited gamma-amplitudes in each occipital region, according to which occipital region was stimulated (Figure 3). In the following text, for example, ‘grand-averaged Gammamedial→ventral’ will indicate the grand-averaged percent change of stimulation-elicited gamma amplitudes measured at 38 ventral-occipital-temporal sites when stimuli were delivered to 25 pairs within the medial-occipital region. Likewise, ‘grand-averaged Gammaventral→medial, Gammamedial→dorsal, and Gammadorsal→medial’ were calculated.
Figure 3. Stimulation-elicited gamma activity.
(A) The graphs show the temporal profiles of gamma-amplitudes at 80–150 Hz following electrical stimulation. The gamma-amplitude was calculated as the percent change in amplitude relative to the mean amplitude in a reference period at −150 and −100 ms relative to the stimulation. Black line: ‘Grand-averaged Gammamedial→ventral’. Gray line: ‘Grand-averaged Gammaventral→medial’. Due to the effects of stimulus artifacts, it was not possible to accurately evaluate gamma-amplitudes within 30 ms from the stimulus. (B) Black line: ‘Grand-averaged Gammamedial→dorsal’. Gray line: ‘Grand-averaged Gammadorsal→medial’. *: Gammamedial→dorsal at 220–275 ms was significantly larger than that during the preceding baseline period.
Statistical analysis
We determined whether and when the voltage of CCEP or percent change of stimulation-elicited gamma-amplitude of each type differed from zero, using a studentized bootstrap procedure. A false discovery rate (FDR) corrected p-value < 0.05 was considered significant. Likewise, we determined whether and when the voltage of CCEP or percent change of stimulation-elicited gamma-amplitude of each type differed from that of its counterpart.
RESULTS
CCEP
Individual averaged CCEP trace at each electrode site as well as grand-averaged CCEP of each type is presented in Figure 2. CCEPmedial→ventral contained an early (20–40 ms) negative deflection with a trough-peak amplitude of >50μV in 7 of the 98 traces (7%) and a delayed (40–200 ms) negative deflection with a trough-peak amplitude of >50μV in 35 of the 98 traces (36%) (Figure 2A). Visual assessment of each trace confirmed that each stimulus reproducibly elicited such deflections. The early negative deflection, if present, appeared more sharply-contoured compared to the delayed one, consistent with previous studies of CCEPs recorded outside of the occipital lobe (Matsumoto et al., 2004; Lacruz et al., 2007; Conner et al., 2011; Keller et al., 2011; Garell et al., 2012; Koubeissi et al., 2012). Conversely, CCEPventral→medial contained an early negative deflection with a trough-peak amplitude of >50μV in only 2 traces (2%) and a delayed negative deflection with such a trough-peak amplitude in 19 traces (19%) (Figure 2A). The bootstrap statistics suggested that the voltage of CCEPmedial→ventral was larger than that of CCEPventral→medial at 130 ms (FDR-corrected p- value<0.05) (Figure 2B). In order to minimize the effects of the polarities of CCEPs across the recording sites, we also measured |CCEP| (i.e.: absolute amplitude of CCEP) at each site. The bootstrap statistics suggested that the amplitude of |CCEP|medial→ventral was larger than that of |CCEP|ventral→medial at 90 ms (FDR-corrected p-value<0.05).
CCEPmedial→dorsal contained an early negative deflection with a trough-peak amplitude of >50μV in 5 traces (5%) and a delayed negative deflection with such an amplitude in 38 traces (34%) (Figure 2C). Conversely, CCEPdorsal→medial contained such an early negative deflection in 1 trace (1%) and a delayed negative deflection in 31 traces (28%) (Figure 2C). The bootstrap statistics suggested that the voltage of CCEPmedial→dorsal was larger than that of CCEPdorsal→medial at 70–85 ms (FDR-corrected p-value<0.05) (Figure 2D). Difference in the amplitude between |CCEP|medial→dorsal and |CCEP|dorsal→medial failed to reach significance (FDR-corrected p-value>0.05).
Stimulation-elicited gamma-activity
The bootstrap statistics suggested that Gammamedial→dorsal became greater than zero at 220–275 ms following the onset of stimulation (FDR-corrected p-value<0.05) (Figure 3B). Gammamedial→ventral, Gammaventral→medial, and Gammadorsal→medial failed to differ from zero (Figure 3). No difference between Gammamedial→ventral and Gammaventral→medial or between Gammamedial→dorsal and Gammadorsal→medial was found.
DISCUSSION
Significance of CCEPs in the visual pathways
The present study of the large-scale cortical networks demonstrated that electrical stimulation of the lower-order visual region elicited CCEPs in the higher-order visual regions, while stimulation of the higher-order region elicited CCEPs in the lower-order region. These observations provide a direct evidence of functional connectivity between lower- and higher-order visual regions within the human occipital lobe.
Grand-averaged CCEPs observed in this study consisted of a small early (20–40 ms) negative deflection, followed by larger delayed (40–200 ms) negative deflection. The mechanism of CCEPs remains to be determined. It has been speculated that early deflections reflect excitation of neurons, while delayed ones reflect inhibition (Logothetis et al., 2010; Alarcón et al., 2012). A study of non-human primates demonstrated that microstimulation of the lateral geniculate nucleus had spiking rates in V1 increased at 10–20 ms and decreased subsequently for up to 300 ms (Logothetis et al., 2010).
Assessment of individual traces revealed that only a subset (up to 7%) of individual CCEPs contained an early negative deflection with an amplitude of >50μV. The lack of well-defined early negative deflection in most of individual CCEPs in our study may be attributed to the stimulus parameters. An early study of non-human primates reported that larger intensity of cortical stimulation was associated with a large amplitude of early signal deflections (Goldring et al., 1994). Electrical stimuli employed in our study were smaller, and the number of averaging was smaller than those in previous human studies of CCEPs (Valentin et al., 2002; Matsumoto et al., 2004; Koubeissi et al., 2012). We deliberately employed such a weak electrical stimulus in order to minimize the chance of perception of phosphenes, which might secondarily modulate cortical oscillations. None of the patients reported such perception during electrical stimulation in the present study. Thus, we believe that CCEPs recorded in our study were not affected by the secondary changes in visual attention or awareness.
Delayed (40–200 ms) negative deflection was noted in a larger subset of individual CCEPs, and the voltage of such a delayed component was significantly greater in CCEPlower→higher than in CCEPhigher→lower. These observations are the direct evidence of reciprocal connectivity between lower- and higher-order visual regions via cortico-cortical (or cortico-subcortical-cortical) pathways, and suggest that the manner of propagation differed between the directions. The mechanism for such difference still remains to be determined. Possible explanations include that antidromic propagation of CCEPs may collide with spontaneous orthodromic propagation (Fuller, 1975; Movshon and Newsome, 1996). A previous study of rats showed that microstimulation of the lower-order visual cortex elicited excitatory postsynaptic potentials (EPSPs) that were followed by GABA-mediated hyperpolarizing inhibitory postsynaptic potentials (IPSPs) in the higher-order visual cortex, while microstimulation of the higher-order visual cortex rarely elicited such IPSPs (Shao and Burkhalter, 1999). We cannot rule out the possibility that electrical stimulation of the lower-order visual cortex, compared to higher-order ones, may have more efficiently activated the axons of underlying neurons, perhaps because the human lower-order visual cortex is a thin structure with a larger granular layer and a prominent bundle of fibers (Huttenlocher, 1990). The number of fibers projected between the stimulated and recording sites should be the same between the stimulus conditions, though previous studies of cats using retrograde transport of fluorescent tracer showed that the lower-order visual cortex sends widely divergent projections to larger higher-order visual cortices (Price et al., 1994). Variability in the laminar termination should be also considered, since it may cancel out the generated signals. A study of non-human primates showed that the feed-forward connections terminate mainly in layer IV in higher-order visual cortices, while the feed-back connections arise mainly from the supragranular and infragranular layers of the higher visual areas and terminate mainly outside of layer IV of the lower-order visual cortex (Felleman and Van Essen, 1991).
Significance of stimulation-elicited gamma-activity in the visual pathways
We found that stimulation of the lower-order visual cortex elicited augmentation of gamma-activity at 80–150 Hz in the higher-order visual cortex at 220–275 msec, when delayed negative deflection of CCEPs subsided. Such gamma-augmentation may reflect weak but still significant cortical excitation. Previous ECoG studies of human cerebral cortex have shown that the amplitude of gamma-activity spontaneously waxes and wanes by being time-locked to the phase of slow wave at delta to theta range (Canolty et al., 2006; Csercsa et al., 2010; Le Van Quyen et al., 2010; Nagasawa et al., 2012). Such delayed gamma-augmentation is unlikely to reflect delayed epileptic spikes induced by stimulation (Valentín et al., 2002; van ’t Klooster et al., 2011), since the sites involved by interictal spikes, seizure onset zones or structural lesions were excluded from the study.
Methodological considerations
The location and extent of subdural electrode placement were determined solely by clinical considerations; thus, spatial sampling was limited. No subcortical structures were sampled, and we are unable to determine whether CCEPs were generated strictly via cortico-cortical or cortico-subcortical-cortical projection. Our analytic approach was unique, since all CCEP traces were included into the statistical analysis, regardless of presence of visually-noticeable and reproducible deflections. Limitations include that a smaller number of repeated stimuli may have resulted in underestimation of a small deflection in each individual CCEP trace. Increasing the number of stimuli (for example up to 40 per a pair) seemed to be feasible and is expected to improve the signal-to-noise ratio in the future.
We cannot completely rule out the effect of patient age on stimulation-elicited cortical signals, but there is no objective evidence that the main findings of the present study have been driven by the age of our study patients (Table 1). A study of healthy children and adults using diffusion-weighted MRI suggested that the myelination process starts earlier in the occipital than in the frontal lobe, and that the changes of diffusional anisotropy in the occipital white matter are completed within 6 months after birth (Nomura et al., 1994). The synaptic density in the human visual cortex has been reported to rapidly increase during the first year of life, and gradually decrease until 11 years of age (Huttenlocher and de Courten C, 1987).
Measurement of stimulation-elicited cortical signals on subdural EEG may be, in part, advantageous to fMRI and diffusion tractography in delineating the connectivity involving less well-described cortical networks. A previous fMRI study demonstrated that BOLD signals fluctuated with a frequency of <0.1 Hz during a resting period with the eyes closed; thereby, hemodynamic activation in the lower-order visual regions was temporarily coupled with deactivation in the higher-order regions bilaterally, while activation in the higher-order visual regions was in turn coupled with deactivation in the lower-order regions (Beckmann et al., 2005). Diffusion tractography is a useful tool to quantitatively visualize the white matter pathways in a living human brain, but the presence of major crossing fibers (such as the superior longitudinal fasciculus) may make it difficult to accurately visualize the fibers directly connecting the lower- and higher-order visual regions within the occipital lobe (Singh and Wong, 2010). Neither neuroimaging modality can delineate the temporal dynamics of signal propagation in an order of milliseconds nor determine in which direction electrical signals propagate more effectively. Further studies are warranted to determine how useful CCEPs recorded in the visual pathways are to localize the eloquent cortices in presurgical evaluation.
HIGHLIGHTS.
Electrical stimulation of the lower-order visual cortex elicited cortico-cortical evoked potentials (CCEPs) and augmentation of gamma activity in the higher-order visual cortex via feed-forward propagations.
Electrical stimulation of the higher-order visual cortex elicited smaller CCEPs but no detectable gamma-augmentation in the lower-order visual cortex via feed-back propagations.
Difference in the propagation manners of stimulation-elicited cortical-signals between feed-forward and feed-back directions may need to be taken into consideration for future clinical application of CCEPs and stimulation-elicited gamma-augmentation in presurgical evaluation for epilepsy surgery.
Acknowledgments
This work was supported by NIH grant NS64033 (to E. Asano). We are grateful to Harry T. Chugani, MD, Sandeep Sood, MD, Sarah Minarik, RN, BSN, and Carol Pawlak, REEG/EPT at Children’s Hospital of Michigan, Wayne State University for the collaboration and assistance in performing the studies described above.
Footnotes
Publisher's Disclaimer: This is a PDF file of an unedited manuscript that has been accepted for publication. As a service to our customers we are providing this early version of the manuscript. The manuscript will undergo copyediting, typesetting, and review of the resulting proof before it is published in its final citable form. Please note that during the production process errors may be discovered which could affect the content, and all legal disclaimers that apply to the journal pertain.
References
- Alarcón G, Martinez J, Kerai SV, Lacruz ME, Quiroga RQ, Selway RP, et al. In vivo neuronal firing patterns during human epileptiform discharges replicated by electrical stimulation. Clin Neurophysiol. 2012;123:1736–44. doi: 10.1016/j.clinph.2012.02.062. [DOI] [PMC free article] [PubMed] [Google Scholar]
- Alkonyi B, Juhász C, Muzik O, Asano E, Saporta A, Shah A, et al. Quantitative brain surface mapping of an electrophysiologic/metabolic mismatch in human neocortical epilepsy. Epilepsy Res. 2009;87:77–87. doi: 10.1016/j.eplepsyres.2009.08.002. [DOI] [PMC free article] [PubMed] [Google Scholar]
- Asano E, Juhász C, Shah A, Sood S, Chugani HT. Role of subdural electrocorticography in prediction of long-term seizure outcome in epilepsy surgery. Brain. 2009;132:1038–47. doi: 10.1093/brain/awp025. [DOI] [PMC free article] [PubMed] [Google Scholar]
- Beckmann CF, DeLuca M, Devlin JT, Smith SM. Investigations into resting-state connectivity using independent component analysis. Philos Trans R Soc Lond B Biol Sci. 2005;360:1001–13. doi: 10.1098/rstb.2005.1634. [DOI] [PMC free article] [PubMed] [Google Scholar]
- Canolty RT, Edwards E, Dalal SS, Soltani M, Nagarajan SS, Kirsch HE, et al. High gamma power is phase-locked to theta oscillations in human neocortex. Science. 2006;313:1626–8. doi: 10.1126/science.1128115. [DOI] [PMC free article] [PubMed] [Google Scholar]
- Conner CR, Ellmore TM, DiSano MA, Pieters TA, Potter AW, Tandon N. Anatomic and electro-physiologic connectivity of the language system: a combined DTI-CCEP study. Comput Biol Med. 2011;41:1100–9. doi: 10.1016/j.compbiomed.2011.07.008. [DOI] [PMC free article] [PubMed] [Google Scholar]
- Conturo TE, Lori NF, Cull TS, Akbudak E, Snyder AZ, Shimony JS, et al. Tracking neuronal fiber pathways in the living human brain. Proc Natl Acad Sci USA. 1999;96:10422–7. doi: 10.1073/pnas.96.18.10422. [DOI] [PMC free article] [PubMed] [Google Scholar]
- Crone NE, Sinai A, Korzeniewska A. High-frequency gamma oscillations and human brain mapping with electrocorticography. Prog Brain Res. 2006;159:275–95. doi: 10.1016/S0079-6123(06)59019-3. [DOI] [PubMed] [Google Scholar]
- Csercsa R, Dombovári B, Fabó D, Wittner L, Eross L, Entz L, et al. Laminar analysis of slow wave activity in humans. Brain. 2010;133:2814–29. doi: 10.1093/brain/awq169. [DOI] [PMC free article] [PubMed] [Google Scholar]
- Dalal SS, Edwards E, Kirsch HE, Barbaro NM, Knight RT, Nagarajan SS. Localization of neurosurgically implanted electrodes via photograph-MRI-radiograph coregistration. J Neurosci Methods. 2008;174:106–15. doi: 10.1016/j.jneumeth.2008.06.02. [DOI] [PMC free article] [PubMed] [Google Scholar]
- Felleman DJ, Van Essen DC. Distributed hierarchical processing in the primate cerebral cortex. Cereb Cortex. 1991;1:1–47. doi: 10.1093/cercor/1.1.1-a. [DOI] [PubMed] [Google Scholar]
- Fuller JH. Brain stem reticular units: some properties of the course and origin of the ascending trajectory. Brain Res. 1975;83:349–67. doi: 10.1016/0006-8993(75)90830-6. [DOI] [PubMed] [Google Scholar]
- Garell PC, Bakken H, Greenlee JD, Volkov I, Reale RA, Oya H, et al. Functional Connection Between Posterior Superior Temporal Gyrus and Ventrolateral Prefrontal Cortex in Human. Cereb Cortex. 2012 doi: 10.1093/cercor/bhs220. [DOI] [PMC free article] [PubMed] [Google Scholar]
- Goldring S, Harding GW, Gregorie EM. Distinctive electrophysiological characteristics of functionally discrete brain areas: a tenable approach to functional localization. J Neurosurg. 1994;80:701–9. doi: 10.3171/jns.1994.80.4.0701. [DOI] [PubMed] [Google Scholar]
- Goodale MA, Milner AD. Separate visual pathways for perception and action. Trends Neurosci. 1992;15:20–5. doi: 10.1016/0166-2236(92)90344-8. [DOI] [PubMed] [Google Scholar]
- Hoechstetter K, Bornfleth H, Weckesser D, Ille N, Berg P, Scherg M. BESA source coherence: a new method to study cortical oscillatory coupling. Brain Topogr. 2004;16:233–8. doi: 10.1023/b:brat.0000032857.55223.5d. [DOI] [PubMed] [Google Scholar]
- Huttenlocher PR, de Courten C. The development of synapses in striate cortex of man. Hum Neurobiol. 1987;6:1–9. [PubMed] [Google Scholar]
- Huttenlocher PR. Morphometric study of human cerebral cortex development. Neuropsychologia. 1990;28:517–27. doi: 10.1016/0028-3932(90)90031-i. [DOI] [PubMed] [Google Scholar]
- Keller CJ, Bickel S, Entz L, Ulbert I, Milham MP, Kelly C, et al. Intrinsic functional architecture predicts electrically evoked responses in the human brain. Proc Natl Acad Sci USA. 2011;108:10308–13. doi: 10.1073/pnas.1019750108. [DOI] [PMC free article] [PubMed] [Google Scholar]
- Kojima K, Brown EC, Rothermel R, Carlson A, Fuerst D, Matsuzaki N, et al. Clinical significance and developmental changes of auditory-language-related gamma activity. Clin Neurophysiol. 2012 doi: 10.1016/j.clinph.2012.09.031. [DOI] [PMC free article] [PubMed] [Google Scholar]
- Koubeissi MZ, Lesser RP, Sinai A, Gaillard WD, Franaszczuk PJ, Crone NE. Connectivity between perisylvian and bilateral basal temporal cortices. Cereb Cortex. 2012;22:918–25. doi: 10.1093/cercor/bhr163. [DOI] [PMC free article] [PubMed] [Google Scholar]
- Lacruz ME, García Seoane JJ, Valentin A, Selway R, Alarcón G. Frontal and temporal functional connections of the living human brain. Eur J Neurosci. 2007;26:1357–70. doi: 10.1111/j.1460-9568.2007.05730.x. [DOI] [PubMed] [Google Scholar]
- Le Van Quyen M, Staba R, Bragin A, Dickson C, Valderrama M, Fried I, et al. Large-scale microelectrode recordings of high-frequency gamma oscillations in human cortex during sleep. J Neurosci. 2010;30:7770–82. doi: 10.1523/JNEUROSCI.5049-09.2010. [DOI] [PMC free article] [PubMed] [Google Scholar]
- Logothetis NK, Augath M, Murayama Y, Rauch A, Sultan F, Goense J, et al. The effects of electrical microstimulation on cortical signal propagation. Nat Neurosci. 2010;13:1283–91. doi: 10.1038/nn.2631. [DOI] [PubMed] [Google Scholar]
- Matsumoto R, Nair DR, LaPresto E, Najm I, Bingaman W, Shibasaki H, et al. Functional connectivity in the human language system: a cortico-cortical evoked potential study. Brain. 2004;127:2316–30. doi: 10.1093/brain/awh246. [DOI] [PubMed] [Google Scholar]
- Matsuzaki N, Nagasawa T, Juhász C, Sood S, Asano E. Independent predictors of neuronal adaptation in human primary visual cortex measured with high-gamma activity. Neuroimage. 2012;59:1639–46. doi: 10.1016/j.neuroimage.2011.09.014. [DOI] [PMC free article] [PubMed] [Google Scholar]
- Mishkin M, Ungerleider LG. Contribution of striate inputs to the visuospatial functions of parieto-preoccipital cortex in monkeys. Behav Brain Res. 1982;6:57–77. doi: 10.1016/0166-4328(82)90081-x. [DOI] [PubMed] [Google Scholar]
- Movshon JA, Newsome WT. Visual response properties of striate cortical neurons projecting to area MT in macaque monkeys. J Neurosci. 1996;16:7733–41. doi: 10.1523/JNEUROSCI.16-23-07733.1996. [DOI] [PMC free article] [PubMed] [Google Scholar]
- Muzik O, Chugani DC, Zou G, Hua J, Lu Y, Lu S, et al. Multimodality data integration in epilepsy. Int J Biomed Imaging. 2007;2007:13963. doi: 10.1155/2007/13963. [DOI] [PMC free article] [PubMed] [Google Scholar]
- Nagasawa T, Juhász C, Rothermel R, Hoechstetter K, Sood S, Asano E. Spontaneous and visually driven high-frequency oscillations in the occipital cortex: intracranial recording in epileptic patients. Hum Brain Mapp. 2012;33:569–83. doi: 10.1002/hbm.21233. [DOI] [PMC free article] [PubMed] [Google Scholar]
- Niessing J, Ebisch B, Schmidt KE, Niessing M, Singer W, Galuske RA. Hemodynamic signals correlate tightly with synchronized gamma oscillations. Science. 2005;309:948–51. doi: 10.1126/science.1110948. [DOI] [PubMed] [Google Scholar]
- Nomura Y, Sakuma H, Takeda K, Tagami T, Okuda Y, Nakagawa T. Diffusional anisotropy of the human brain assessed with diffusion-weighted MR: relation with normal brain development and aging. Am J Neuroradiol. 1994;15:231–8. [PMC free article] [PubMed] [Google Scholar]
- Papp N, Ktonas P. Critical evaluation of complex demodulation techniques for the quantification of bioelectrical activity. Biomed Sci Instrum. 1977;13:135–45. [PubMed] [Google Scholar]
- Price DJ, Ferrer JM, Blakemore C, Kato N. Functional organization of corticocortical projections from area 17 to area 18 in the cat’s visual cortex. J Neurosci. 1994;14:2732–46. doi: 10.1523/JNEUROSCI.14-05-02732.1994. [DOI] [PMC free article] [PubMed] [Google Scholar]
- Ray S, Crone NE, Niebur E, Franaszczuk PJ, Hsiao SS. Neural correlates of high-gamma oscillations (60–200 Hz) in macaque local field potentials and their potential implications in electrocorticography. J Neurosci. 2008;28:11526–36. doi: 10.1523/JNEUROSCI.2848-08.2008. [DOI] [PMC free article] [PubMed] [Google Scholar]
- Rosenberg DS, Mauguière F, Catenoix H, Faillenot I, Magnin M. Reciprocal thalamocortical connectivity of the medial pulvinar: a depth stimulation and evoked potential study in human brain. Cereb Cortex. 2009;19:1462–73. doi: 10.1093/cercor/bhn185. [DOI] [PubMed] [Google Scholar]
- Salmelin R, Hari R. Spatiotemporal characteristics of sensorimotor neuromagnetic rhythms related to thumb movement. Neuroscience. 1994;60:537–50. doi: 10.1016/0306-4522(94)90263-1. [DOI] [PubMed] [Google Scholar]
- Scheeringa R, Fries P, Petersson KM, Oostenveld R, Grothe I, Norris DG, et al. Neuronal dynamics underlying high- and low-frequency EEG oscillations contribute independently to the human BOLD signal. Neuron. 2011;69:572–83. doi: 10.1016/j.neuron.2010.11.044. [DOI] [PubMed] [Google Scholar]
- Schneider KA, Richter MC, Kastner S. Retinotopic organization and functional subdivisions of the human lateral geniculate nucleus: a high-resolution functional magnetic resonance imaging study. J Neurosci. 2004;24:8975–85. doi: 10.1523/JNEUROSCI.2413-04.2004. [DOI] [PMC free article] [PubMed] [Google Scholar]
- Schroeder CE, Mehta AD, Givre SJ. A spatiotemporal profile of visual system activation revealed by current source density analysis in the awake macaque. Cereb Cortex. 1998;8:575–92. doi: 10.1093/cercor/8.7.575. [DOI] [PubMed] [Google Scholar]
- Shao Z, Burkhalter A. Role of GABAB receptor-mediated inhibition in reciprocal interareal pathways of rat visual cortex. J Neurophysiol. 1999;81:1014–24. doi: 10.1152/jn.1999.81.3.1014. [DOI] [PubMed] [Google Scholar]
- Sinai A, Bowers CW, Crainiceanu CM, Boatman D, Gordon B, Lesser RP, et al. Electrocorticographic high gamma activity versus electrical cortical stimulation mapping of naming. Brain. 2005;128:1556–70. doi: 10.1093/brain/awh491. [DOI] [PubMed] [Google Scholar]
- Singh M, Wong CW. Independent component analysis-based multifiber streamline tractography of the human brain. Magn Reson Med. 2010;64:1676–84. doi: 10.1002/mrm.22509. [DOI] [PMC free article] [PubMed] [Google Scholar]
- Swann NC, Cai W, Conner CR, Pieters TA, Claffey MP, George JS, et al. Roles for the pre-supplementary motor area and the right inferior frontal gyrus in stopping action: electrophysiological responses and functional and structural connectivity. Neuroimage. 2012;59:2860–70. doi: 10.1016/j.neuroimage.2011.09.049. [DOI] [PMC free article] [PubMed] [Google Scholar]
- Valentín A, Anderson M, Alarcón G, Seoane JJ, Selway R, Binnie CD, et al. Responses to single pulse electrical stimulation identify epileptogenesis in the human brain in vivo. Brain. 2002;125:1709–18. doi: 10.1093/brain/awf187. [DOI] [PubMed] [Google Scholar]
- van ’t Klooster MA, Zijlmans M, Leijten FS, Ferrier CH, van Putten MJ, Huiskamp GJ. Time-frequency analysis of single pulse electrical stimulation to assist delineation of epileptogenic cortex. Brain. 2011;134:2855–66. doi: 10.1093/brain/awr211. [DOI] [PubMed] [Google Scholar]
- Wandell BA, Dumoulin SO, Brewer AA. Visual field maps in human cortex. Neuron. 2007;56:366–83. doi: 10.1016/j.neuron.2007.10.012. [DOI] [PubMed] [Google Scholar]
- Wu HC, Nagasawa T, Brown EC, Juhasz C, Rothermel R, Hoechstetter K, et al. γ-oscillations modulated by picture naming and word reading: intracranial recording in epileptic patients. Clin Neurophysiol. 2011;122:1929–42. doi: 10.1016/j.clinph.2011.03.011. [DOI] [PMC free article] [PubMed] [Google Scholar]


