Abstract
Mutant p53 proteins not only lose their tumor-suppressor function but some acquire oncogenic gain of function (GOF). The published mutp53 knock-in (KI) alleles (R172H, R270H, R248W) manifest GOF by broader tumor spectrum and more metastasis compared with the p53-null allele, but do not shorten survival. However, whether GOF also occurs with other mutations and whether they are all biologically equal is unknown. To answer this, we created novel humanized mutp53 KI mice harboring the hot spot alleles R248Q and G245S. Intriguingly, their impact was very different. Compared with p53-null mice, R248Q/− mice had accelerated onset of all tumor types and shorter survival, thus unprecedented strong GOF. In contrast, G245S/− mice were similar to null mice in tumor latency and survival. This was associated with a twofold higher T-lymphoma proliferation in R248Q/− mice compared with G245S/− and null mice. Moreover, R248Q/− hematopoietic and mesenchymal stem cells were expanded relative to G245S/− and null mice, the first indication that GOF also acts by perturbing pretumorous progenitor pools. Importantly, these models closely mirror Li–Fraumeni patients who show higher tumor numbers, accelerated onset and shorter tumor-free survival by 10.5 years when harboring codon R248Q mutations as compared with Li–Fraumeni patients with codon G245S mutations or p53 deletions/loss. Conversely, both KI alleles caused a modest broadening of tumor spectrum with enhanced Akt signaling compared with null mice. These models are the first in vivo proof for differential oncogenic strength among p53 GOF alleles, with genotype–phenotype correlations borne out in humans.
Keywords: HUPKI, gain of function, LSK, MSC
p53 is mutated in over 50% of human cancers.1 In response to oncogenic mutations or DNA damage, wtp53 rapidly stabilizes in the nucleus, triggering a transcriptional program of cell cycle arrest, DNA repair, senescence, autophagy and apoptosis. The vast majority (95%) of p53 mutations in human cancer are missense mutations (mutp53). They are broadly distributed within the DNA-binding domain (aa 102–292) with 6 hot spots at codons 175, 245, 248, 249, 273 and 282, and generate conformationally aberrant proteins with impaired or abrogated transcriptional function and abrogated pro-apoptotic mitochondrial actions.1, 2 Accumulating evidence indicates multiple newly acquired active roles for mutp53 proteins in promoting tumorigenesis.3, 4, 5
Knock-in (KI) mouse models expressing the hot spot mutant alleles R172H and R270H (equivalent to human R175H and R273H) from the endogenous promoter provided definitive proof that at least certain p53 mutants exhibit gain of functions (GOFs).6, 7 They established that these mutp53 proteins cause a broader tumor spectrum including carcinomas and progression of certain tumor types to a more invasive and metastatic phenotype compared with tumors of p53−/− or p53 +/− mice. Similarly, three HUPKI (Humanized p53 Knock In) mouse models (harboring R175H, R273H and R248W) show broader tumor spectrum compared with null mice, confirming a GOF for these human hot spot mutants.8, 9 These studies provided strong in vivo evidence that certain mutp53 proteins cause an increase in both tumor initiation and progression compared with simple loss of p53.
Although compelling, whether GOF occurs with other hot spot mutations is unknown. Moreover, it is unclear whether differences in the magnitude of GOF, on an organismal and/or cellular level, exist among various mutant alleles. To gain a better understanding of GOF in vivo, we created two novel HUPKI mice carrying the hot spot mutations R248Q and G245S and subjected them to stringent side-by-side comparisons. Surprisingly, R248Q/− mice displayed marked acceleration of tumor onset in all tumor types and accelerated death compared with G245S/− and null mice, an unprecedented strong GOF phenotype not previously described for the existing mutp53 KI mice. The R248Q/− GOF was associated with expansion of pretumorous hematopoietic and mesenchymal stem cells (MSCs), and increased tumor cell proliferation. Importantly, these KI models closely mirror human Li–Fraumeni patients. Patients with the R248Q/+ genotype show an accelerated tumor onset by 10.5 years and a higher tumor burden in contrast to Li–Fraumeni patients with the G245S/+ or null/+ genotypes. Our new KI models provide the hitherto strongest support for the mutp53 GOF concept. Moreover, they are in vivo proof for the existence of differential oncogenic strength among p53 GOF mutants and reflect genotype–phenotype correlations borne out in humans.
Results
Primary cells from R248Q and G245S mice show complete loss of several important wtp53 tumor-suppressor functions
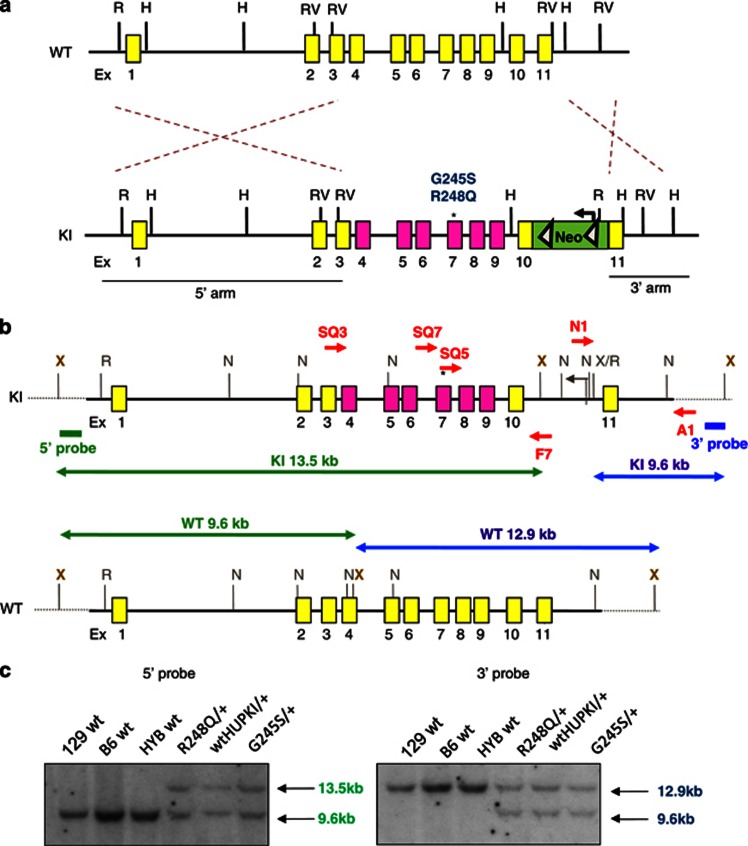
Using the HUPKI approach,10 we generated mice expressing R248Q and G245S, two human p53 hot spot mutations that have not yet been characterized in vivo. Both mutations are located within the L3 loop of p53.11 The R248 residue is in direct physical contact with the minor groove of DNA and has been traditionally called a ‘contact' mutation. Mutations in residue G245 result in significant disruption of the structure of the DNA binding loop and is thus classified as a ‘structural' mutation.12 Each mutation was introduced into a targeting vector (Figure 1a) and electroporated into embryonic stem (ES) cells. After neomycin selection, the neomycin resistance cassette was efficiently removed by transfecting Flp recombinase. Homologous recombination was verified by Southern blot analysis of ES clones (Figures 1b and c). These cells were injected into C57BL/6 blastocysts to generate the respective cohorts.
Figure 1.
Construction of hot spot mutp53 R248Q and G245S HUPKI mouse models. (a) Diagram of the mutp53 HUPKI targeting vectors. Mouse genomic region spanning Ex4–9 was replaced with human genomic region Ex4–9 (HUPKI) containing either a p53 R248Q or G245S mutation (marked by *). This generates a chimeric p53 protein of mouse aa 1–32, human aa 33–332 and mouse aa 333–390.38 A deletable Neo selection box flanked by FRT sites (triangles) was inserted downstream of mouse Ex10. Yellow boxes represent mouse exons and pink boxes represent human exons. Restriction enzyme sites are indicated. H, HindIII; N, Not1; R, EcoRI; RV, EcoRV; X, Xho1. (b) Diagram of the knocked-in germline configuration of the two mutp53 HUPKI alleles. Primers F7/SQ7, F7/SQ5 and F7/SQ3 were used to amplify the mutated regions for sequence confirmation. The neomycin resistance cassette was deleted by transfecting recombinant ES lines with flp recombinase; deletion was confirmed by PCR. Southern blot probes are indicated. (c) Southern blot confirmation of neo-deleted recombinant ES clones. XbaI digestion was used for 5′ and 3′ probes. The expected band sizes for the 3′ probe are WT ∼12.9 kb; KI 9.6 kb. For the 5′ probe, expected band sizes are WT 9.6 kb; KI 13.5 kb. The untargeted ES line was a 129:B6 hybrid (HYB). The 129 and B6 ES lines are shown for comparison
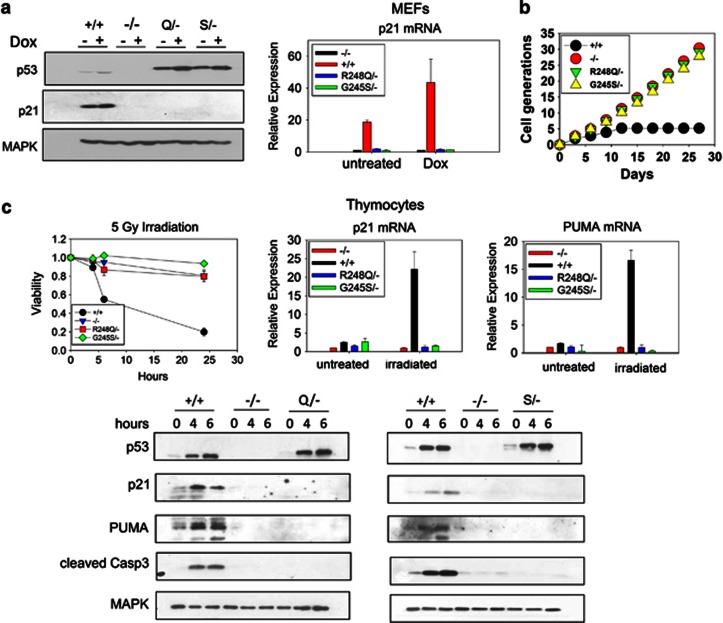
We first studied the functional impact of these p53 mutations in primary cells. Mouse embryonic fibroblasts (MEFs) and thymocytes from KI and control mice were assessed for p53 protein levels, DNA damage response and growth properties (Figure 2). Consistent with previous findings in cultured primary cells,7, 8, 9, 13 both mutations led to a modest constitutive p53 accumulation in cultured MEFs (Figure 2a). Treatment with Doxorubicin increased mutp53 levels further. However, as expected, neither mutation was transcriptionally active, indicated by nearly undetectable p21 mRNA and protein levels at baseline and on DNA damage (Figure 2a). Similar to p53-null MEFs, mutp53 MEFs were immortal and their growth rates identical to null MEFs (Figure 2b). Moreover, thymocytes from both KI mice were completely resistant to apoptosis after γ-irradiation and failed to induce p21, PUMA and cleaved caspase 3 (Figure 2c). Thus, although it is difficult to assess the full spectrum of p53 tumor-suppressor functions, we did find that both endogenous R248Q and G245S proteins are equally devoid of several important wtp53 tumor-suppressor functions including transcription of cell cycle arrest genes, replicative senescence and irradiation-induced apoptosis.
Figure 2.
p53 R248Q and G245S proteins have lost wtp53 transcriptional activity. (a) Early-passage MEFs of the indicated genotypes were treated with 250 nM Doxorubicin for 24 h. Cells were harvested and protein and RNA prepared. (a, left) Lysates were blotted for p53, p21 and MAPK (loading control). An antibody directed against a peptide sequence surrounding mouse p53 Serine 20 (clone 1C12), present as mouse sequence in both the wild-type (+/+) and HUPKI configurations, is used to compare p53 levels. There is a slight reduction in mobility of HUPKI proteins compared with mouse wtp53 because of the higher molecular weight of the HUPKI proteins. (a, right) p21 mRNA levels determined by qRT-PCR. Results are representative of three independent MEF preparations per genotype. (b) Early-passage MEFs of the indicated genotypes were passaged every 3 days at a density of 4 × 10⁵ per 10 cm dish. The total number of cell generations over 27 days was determined. Results are representative of two independent MEF preparations per genotype. (c) Thymocytes of the indicated genotypes were freshly isolated from 4-week-old mice and γ-irradiated (5 Gy). (c, left) Cell viability was determined by Annexin V/PI staining at 0, 4, 6 and 24 h. Percent viable cells in treated samples were normalized to untreated samples; n=3 mice per genotype. (c, right) qRT-PCR of p21 and Puma mRNA from thymocytes 6 h after irradiation. (c, bottom) Immunoblot analysis for p53, p21, PUMA, cleaved caspase 3 and MAPK (loading control) from irradiated thymocytes at the indicated time points
R248Q/− mice but not G245S/− mice display more rapid tumor onset and accelerated death compared with p53-null mice
To study the GOF effects of these two mutations in vivo, we bred six different cohorts of mice and compared their survival, tumor spectrum and tumor latency. We evaluated each mutation in the heterozygous (mutant/−) and homozygous (mutant/mutant) configuration, as a heterozygous versus homozygous configuration may impact tumor spectrum, as reported for the R270H allele.14 We also generated a wt HUPKI control cohort and confirmed that the wt HUPKI allele is a fully competent tumor suppressor in vivo (Figures 3a and 4a, 100% survival).
Figure 3.
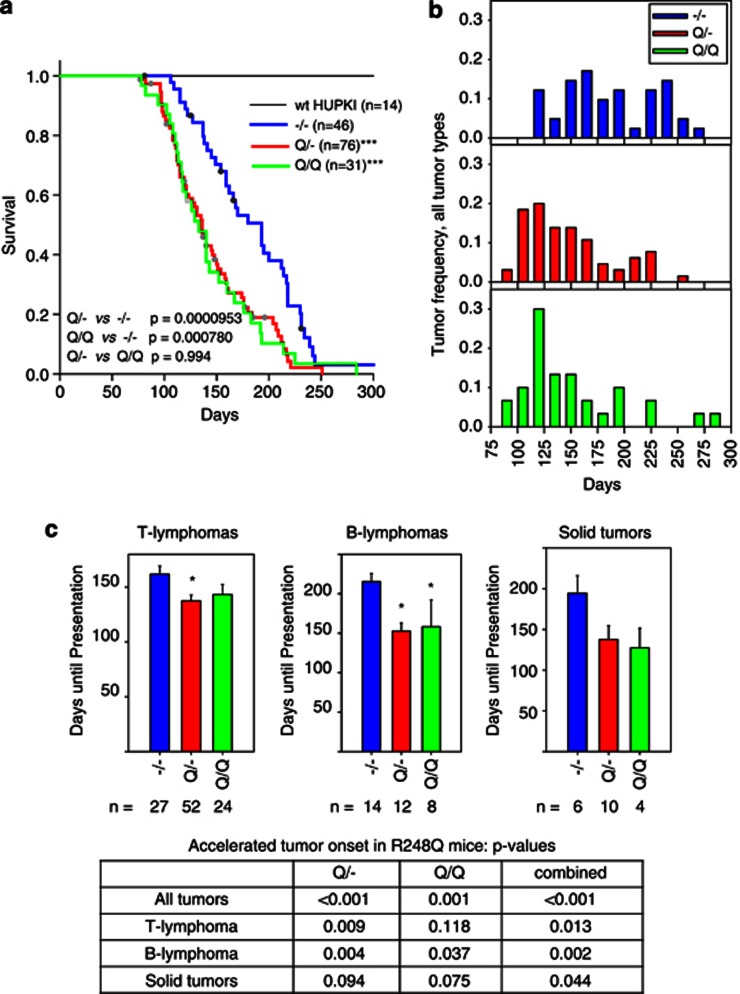
The p53 R248Q allele results in accelerated tumor onset and shorter survival compared with the p53-null allele. (a) Survival curves for mice of the indicated genotypes. The number of total mice in each group is indicated. Dots represent mice that were censored because of death from nontumor-related causes. ***P<0.0001 compared with null mice, log-rank analysis. (b) Tumor onset for all tumor types combined in the indicated genotypes. Tumor frequency was calculated by dividing the number of tumors occurring during 15-day time intervals by the total number of tumors occurring for each genotype. Number of mice is the same as in (a). (c) Mean days until first appearance of the indicated tumor types. Error bars indicate S.E. *P<0.05 compared with null mice. The bottom table summarizing P-values compared with null mice for Q/−, Q/Q and both genotypes combined. The solid tumor data are not significant, likely because of the small number of tumors of individual genotypes. However, when both R248Q/− and R248Q/R248Q genotypes are combined, they reach statistical significance, as shown in the table (P=0.044)
Figure 4.
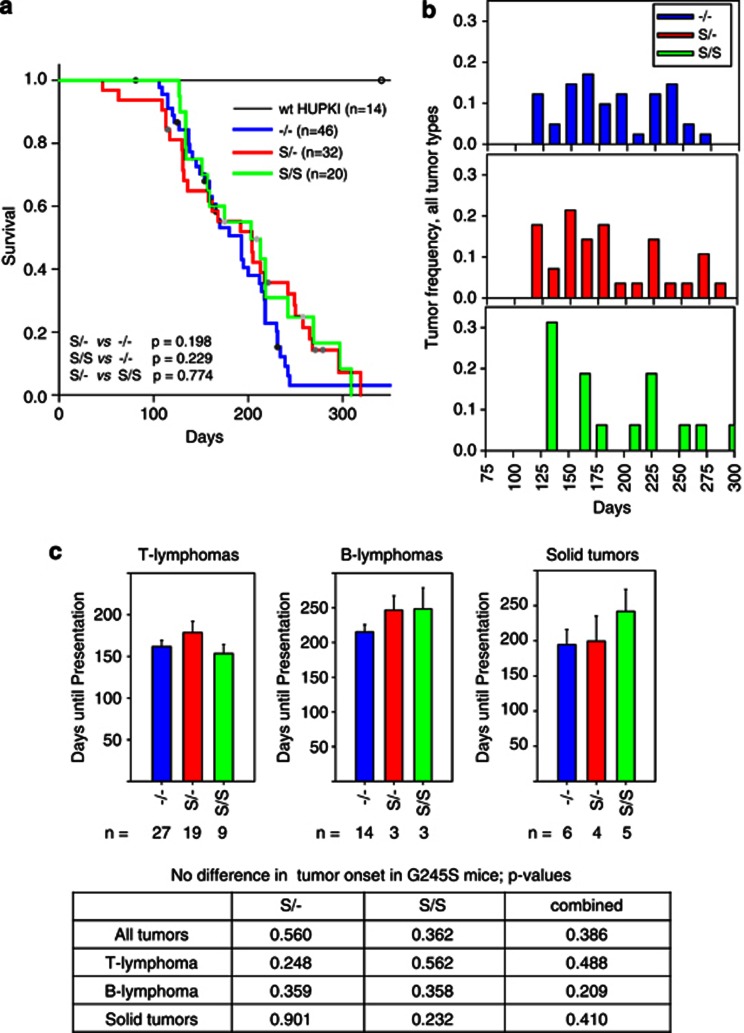
The p53 G245S allele has similar tumor onset and survival compared with the p53-null allele. (a) Survival curves for mice of the indicated genotypes. The number of total mice in each group is indicated. Dots represent mice that were censored because of deaths from nontumor-related causes. Log-rank analysis, P-values are indicated. (b) Tumor onset for all tumor types combined in the indicated genotypes. Tumor frequency was calculated by dividing the number of tumors occurring during 15-day time intervals by the total number of tumors occurring for each genotype. Number of mice is the same as in (a). (c) Mean days until first appearance of the indicated tumor types. Error bars indicate S.E. Bottom table summarizing P-values compared with null mice for S/−, S/S and both genotypes combined
Expression of the R248Q protein resulted in a marked reduction in survival compared with no p53 expression on the same genetic background (Figure 3a). The effect was independent of gene dosage, as Q/Q homozygous and Q/− heterozygous mice had similar shortened survival and tumor latencies (Figure 3a). This was because of an accelerated tumor onset in all tumor groups (T lymphomas, B lymphomas and solid tumors) compared with null mice (Figures 3b and c). Thus, both Q/− and Q/Q mice exhibit a strong GOF phenotype of accelerated tumor onset and death, not previously reported in the existing mutp53 KI models.6, 7, 8, 9 In contrast, both S/− and S/S mice did not display significant differences in tumor latency and survival compared with null mice (Figure 4). Beyond 230 days, there was a trend toward survival extension in S/− and S/S mice compared with null mice (Figure 4b), most likely because of a reduction in very late appearing B lymphomas in S/− and S/S mice (Supplementary Figure S1B). Thus, although the hot spot mutations R248Q and G245S display similar loss of transcriptional activation in response to DNA damage (Figure 2), they show strong phenotypic differences on an organismal level. Conversely, we observed a modest trend toward broadening of the tumor spectrum of both the Q/− and the S/− cohorts, with mutant mice showing higher diversity of sarcoma subtypes, and more carcinomas and germ cell tumors compared with null mice (Supplementary Figures S1 and S2 and Supplementary Table S1).
Humans with germline p53 R248Q/+ genotype show shorter tumor-free survival and higher tumor numbers than humans with germline p53 G245S/+ and −/+ genotypes
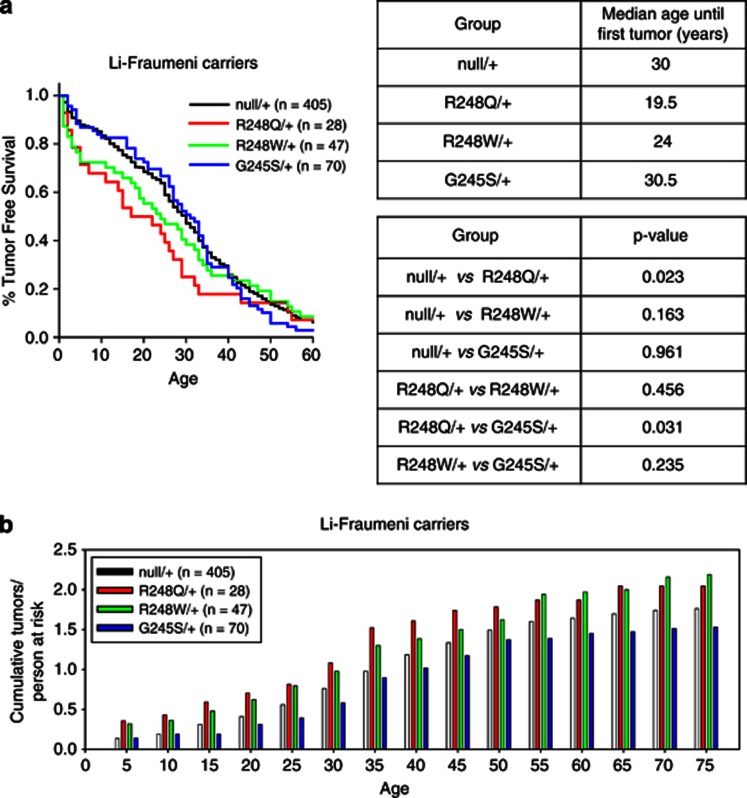
Individuals with p53 germline mutations are prone to Li–Fraumeni syndrome, a familial cancer predisposition characterized by multiple sporadic tumors developing at an early age.15 It is becoming increasingly clear that the specific type of p53 germline mutation plays a critical role in determining the time of onset of tumor formation. Missense mutations within Ex4–9 generally accelerate first tumor onset, compared with all other p53 alterations including large and small in-frame deletions, splice and nonsense mutations and mutations outside Ex4–9.16, 17 Given our differential mouse results, we therefore evaluated whether such a genotype–phenotype difference also exists among humans with R248Q/+, G245S/+ and null/+ heterozygous germline mutations. Although analysis of mutant/+ mouse models was not performed in this study, the majority (56%) of tumors from Li–Fraumeni syndrome patients undergo a loss of heterozygosity (LOH) event at the site of the germline mutation during tumorigenesis to eliminate the wild-type allele,18 resulting in tumors with one of the two mutant p53 configurations reported here (mutp53/− or mutp53/mutp53). For the human analysis, we used the latest p53 IARC database (version R15) that contains extensive clinical information regarding tumor onset in carriers of p53 germline mutations.19 All Li–Fraumeni patients with large deletions, nonsense, splicing and frameshift mutations were considered ‘null/+' in this analysis. Indeed, up to age 40 years, patients with R248Q/+ mutations suffered from earlier onset of first tumors, compared with patients with G245/+ or null/+ germline mutations (Figure 5a, left). Patients with germline R248Q/+ genotype showed a drastically younger median age by over 10 years until first tumor onset compared with patients with a null/+ genotype (R248Q/+, 19.5 years; null/+, 30 years, P=0.023 rank sum test; Figure 5a, right). This was also the case when comparing R248Q/+ and G245S/+ patients (R248Q/+, 19.5 years; G245S/+ 30.5 years; P=0.031). We also looked at patients with the germline R248W/+ genotype as – like the R248Q allele – the R248W allele occurs at a high frequency compared with other alleles at the 248 position. Interestingly, although the R248W/+ genotype did show a trend toward a reduced time to first tumor onset compared with the null/+ genotype (R248W/+, 24 years; null/+, 30 years; P=0.163), the median time to tumor onset of the R248Q/+ genotype tended to be earlier than the R248W/+ genotype, hinting at a stronger GOF effect of the R248Q allele versus the R248W allele (R248Q/+, 19.5 years; R248W/+, 24 years; P=0.456), although neither result was statistically significant. In addition, up to the sixth decade of life, the cumulative number of tumors reported per person at risk was also highest in the R248Q/+ genotype (Figure 5b). Moreover, both 248 cohorts exceeded the null/+ and G245S/+ genotypes with regard to total tumor numbers throughout all ages (Figure 5b). Taken together, these data indicate a strong GOF for the R248Q allele in the germline of mice and humans.
Figure 5.
Persons at risk harboring germline mutations in codon 248 exhibit faster tumor onset than persons at risk with codon G245 or p53-null mutations. (a, left) Kaplan–Meier survival analysis of tumor-free survival of Li–Fraumeni carriers of the indicated genotypes showing the percent of patients remaining tumor free as a function of age in years. The number of patients is indicated. Analysis of data from the latest p53 IARC database (version R15). (a, right top) Median age at first tumor appearance among the four genotypes. (a, right bottom) P-values (ranked sum test) comparing the median age at first tumor appearance between the various different genotypes. (b) Total number of tumors per person at risk as a function of age in years
R248Q/−, R248Q/Q and p53-null T lymphomas display similar phenotypes and cytogenetics
The immunophenotypes of p53−/− and R248Q/− T- and B-cell lymphomas were similar (Supplementary Figure S3). Next, we analyzed the cytogenetics of early-passage T-lymphoma lines from two null, two Q/−, and one Q/Q mouse (Supplementary Figures S4 and S5). The aneuploidy profile was similar among the genotypes, with common gains in chromosomes 1, 4, 5, 6, 11, 14 and 15. Each lymphoma had at least one clonal chromosomal translocation present in the majority of cells. Both null lymphomas and one Q/− lymphoma harbored two clonal translocations. Thus, there was no consistent difference in the cytogenetics of lymphomas developing in p53-null versus R248Q mice.
In contrast to p53-null lymphomas, R248Q lymphomas show enhanced proliferation and signaling through the Akt pathway in vivo
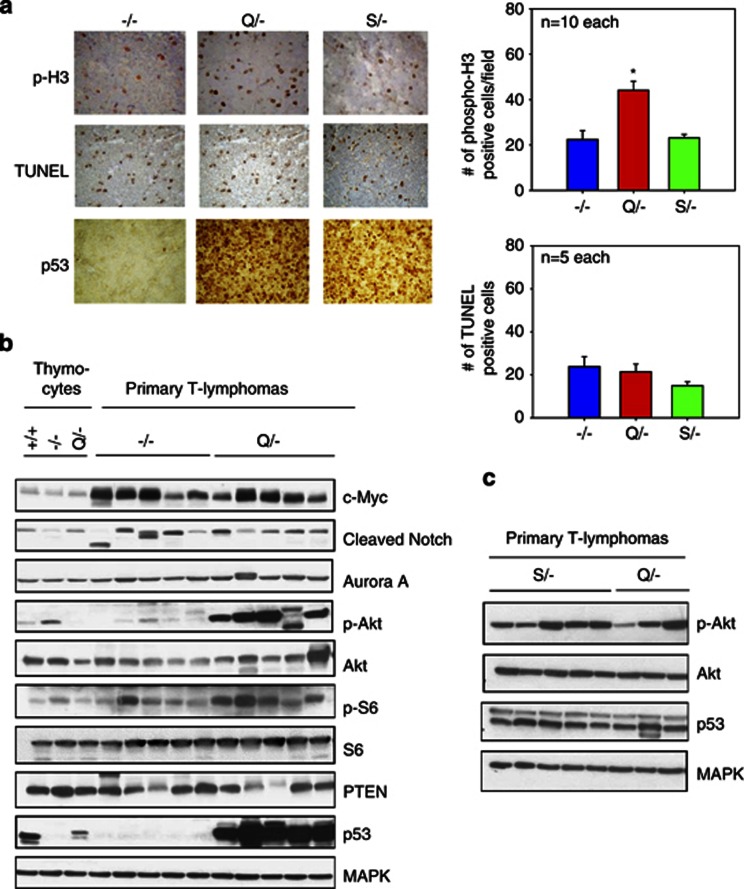
We analyzed the proliferation and apoptotic rates of T-cell lymphomas in vivo. Notably, Q/− lymphomas had a twofold increase in cell proliferation compared with S/− and null lymphomas, as indicated by quantitating phospho-H3 staining of tumors (Figure 6a). In contrast, the rate of apoptosis did not differ between the three genotypes (Figure 6a). Next, we evaluated a number of signaling pathways involved in survival, cell cycle deregulation and malignant progression of lymphomas including c-Myc, Notch1, Aurora Kinase A and the Akt pathway. Importantly, these key effector pathways are implicated in the progression of mouse and human mutp53 tumors in vivo.14, 20, 21 c-Myc and cleaved Notch1 were increased in the lymphomas of both null and Q/− genotypes compared with premalignant thymocytes (Figure 6b). Importantly, dramatically increased levels of p-Akt were present in all five Q/− lymphomas but not in any of the five null lymphomas (Figure 6b). Moreover, the downstream p-Akt target S6 also displayed increased levels of phosphorylation/activation in four of five Q/− lymphomas, confirming that mutant lymphomas have enhanced signaling through the Akt pathway. Loss of PTEN was observed in two Q/− lymphomas but also in one null lymphoma, excluding it as the common underlying mechanism for Akt upregulation in Q/− lymphomas. As expected, mutant G245S/− lymphomas also showed enhanced signaling through Akt (Figure 6c). This GOF mechanism is also relevant in human tumors, as p-Akt upregulation/activation is strongly correlated with expression of many different mutant p53 proteins in human tumors.20 On the other hand, enhanced Akt signaling alone does not explain the enhanced in vivo proliferation of the R248Q T lymphomas (Figure 6a).
Figure 6.
R248Q/− lymphomas show increased in vivo proliferation compared with G245S/− and null lymphomas. Both mutant lymphomas show increased oncogenic signaling via the Akt pathway. (a, left) Immunohistochemical stainings for phospho-H3, TUNEL and p53 were performed on T lymphomas of null, R248Q/− and G245S/− tumors. (a, right) Quantitation of images shown on the left. Positive nuclei were counted in 10 random high-power fields ( × 40) per lymphoma. The mean of these averages for 10 (phospho-H3) and 5 (TUNEL) lymphomas per genotype are shown. Error bars indicate ±S.E. *P<0.05. (b) Primary normal thymocytes from 4-week-old p53+/+, p53−/− and p53 Q/− mice were compared with lysates from primary T lymphomas of the indicated genotypes. Immunoblot analysis for various signaling pathways. MAPK loading control. (c) Primary T-lymphoma lysates from G245S/− mice were compared with the first three T-lymphoma lysates from R248Q/− mice shown in (b). MAPK loading control
Interestingly, in vitro p-Akt and p-S6 levels were not enhanced in Q/− cell lines versus null cell lines, indicating that the Akt signaling pathway is likely not tumor cell intrinsic but depends on factors present only in the tumor microenvironment in vivo (Supplementary Figure S6). Indeed, mutant p53 was shown to sensitize cells to growth factors in their environment by increasing recycling of growth factor receptors such as EGFR to the cell surface.20 A similar mechanism may occur in R248Q and G245S tumors in vivo.
T-lymphoma cell lines from R248Q/− mice develop into highly aggressive leukemias in vivo
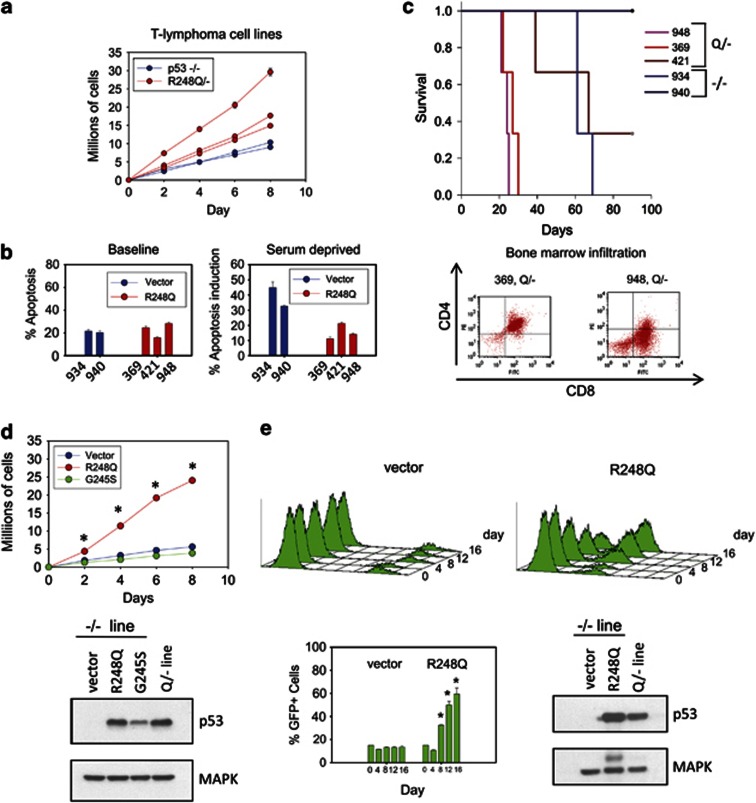
We were able to establish several cell lines from Q/− and null T lymphomas. However, several attempts to establish cell lines from S/− T lymphomas failed for unknown reasons. All three Q/− cell lines showed faster growth rates than the two null lines (Figure 7a), consistent with the enhanced proliferation seen in vivo (Figure 6a). There was no difference in the baseline apoptotic rate under normal growth conditions (Figure 7b, left). However, upon serum deprivation, mutant lines had a reduced apoptotic response compared with null lines (Figure 7b right). Importantly, two of three mutant lines derived from different Q/− lymphomas produced more aggressive leukemias than null control lines when tail vein injected into the circulation of nude mice (lines 948 and 369, Figure 7c, top). Moreover, both R248Q lines produced very rapid colonization of bone marrow, leading to bone marrow failure in the animals (Figure 7c, bottom). Similarly, retroviral expression of the HUPKI R248Q but not of the G245S protein in a p53-null T-lymphoma line enhanced their growth rate (Figure 7d), validating a direct role for the R248Q protein in the GOF in lymphomas. We further confirmed this result by competition assays (Figure 7e). The p53-null lymphomas ectopically expressing the HUPKI mutp53 R248Q protein were able to outcompete the original noninfected null lymphoma cells in co-culture. In contrast, vector-infected null cells were unable to do so (Figure 7e). These results also agree with a previous study in a p53-null human T-acute lymphoblastic leukemia (ALL) line where ectopic expression of R248Q was capable of enhancing their growth.22
Figure 7.
Cell lines derived from R248Q/− lymphomas confirm GOF activities in vitro and in vivo. (a) Cell lines derived from R248Q/− and p53-null T lymphomas were serially passaged every 2 days at a density of 5 × 10⁵ cells per ml. The cumulative number of cells were graphed. The mean±S.E. of three repeats per cell line is shown. (b) Baseline apoptosis under normal growth conditions and the apoptotic response after 24 h of serum starvation in cell lines from (a). Cell line identities are indicated. Bars represent mean±S.E. for three replicate experiments per line. (c, top) Allograft transplantations of cell lines from (a). Cells (1 × 10⁵) were injected into the tail vein of nude mice; mice were killed when moribund. Each curve represents three injections per cell line. (c, bottom) Bone marrow of nude mice was harvested at the time of death and analyzed for the presence of infiltrating leukemic cells identified by CD4+CD8+. (d, left) HUPKI mutp53 R248Q or G245S or empty vector was retrovirally introduced into a p53-null T-lymphoma line (934). Cells were plated in triplicate at a density of 5 × 10⁵ cells. The total cell number was quantified every second day. The average±S.E. of three independent experiments is shown. *P<0.05. (d, bottom) Immunoblot confirming comparable levels of ectopic mutp53 compared with the endogenous mutant p53 present in a Q/− lymphoma line (948). (e) p53-null T-lymphoma cells expressing HUPKI mutp53 R248Q protein outcompete vector control cells in co-culture. (e, top) p53-null lymphoma line (934) expressing retroviral vector-IRES-GFP or R248Q-IRES-GFP were added to the original uninfected p53-null line in a ratio of 15 GFP+/85% GFP− cells. Aliquots from three independent cultures were analyzed for GFP+ cells by FACS over 16 days. (e, bottom) The average percent of GFP+ cells is shown for each time point from three independent cultures. Error bars represent ±S.E. Immunoblot as in (d)
When the normally low levels of mutant p53 R172H protein in pretumorous mouse cells are forcibly stabilized by Mdm2 deletion, earlier tumor onset and decreased survival ensues.23 We therefore tested the possibility that aberrant stabilization of R248Q mutant protein within normal tissues might be contributing to the GOF phenotype seen in these mice. Thus, we looked at the expression levels of p53 R248Q in normal cells by histology and FACS analysis. Indeed, p53 was undetectable in any of the normal tissues from Q/− mice (similar to wtp53 mice), indicating lack of mutp53 stabilization. This was in contrast to massive mutp53 stabilization in all tumor types of Q/− mice (Supplementary Figure S7). Similarly, p53 was low or undetectable in normal T and B lymphocytes from Q/− mice by FACS analysis, whereas p53 was readily detectable in a Q/− T-lymphoma cell line (Supplementary Figure S8). Thus, like the R172H protein, humanized R248Q protein did not show stabilization in normal tissues. This excludes the possibility that generalized aberrant stabilization in normal tissues could have been a determinant for the earlier tumor formation observed in Q/− mice in vivo. We also performed co-immunoprecipitation experiments between both R248Q and G245S and TAp63 and TAp73 (Supplementary Figure S9). We found an equal level of association between these mutants with TAp63 and TAp73, excluding different levels of association with these family members as a cause for differences in tumor onset between the two mouse models.
Expression of p53 R248Q causes expansion of hematopoietic and MSC populations
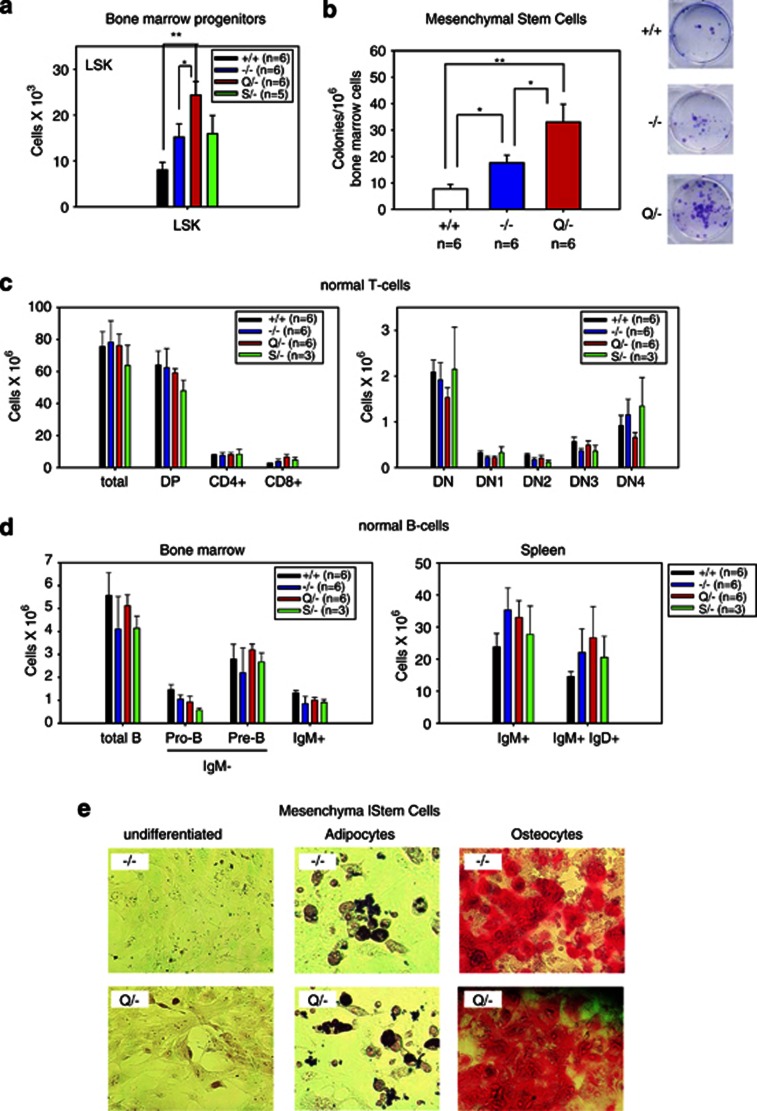
Perturbations in pretumorous cell populations can have drastic consequences on their potential for neoplastic transformation, especially in the absence of a functional p53 pathway.24 To date, a detailed study analyzing the possible impact of mutant p53 on normal hematopoietic, lymphocytic and mesenchymal cell populations and their progenitor versus differentiated compartments has not been conducted. Thus, we set out to determine whether mutp53 induces perturbation of T-cell, B-cell and/or mesenchymal cell subpopulations in pretumorous 4–5-week-old mice. As previously reported,25 we confirmed an increase in the number of hematopoietic Lin−Sca1+c-Kit+ (LSK) progenitor cells in null mice upon loss of wtp53 (Figure 8a, compare wt with −/− cells). Importantly, in R248Q mice the LSK pool was further expanded compared with null mice (Figure 8a). In contrast, G245S mice had similar LSK pool numbers as null mice (Figure 8a). On the other hand, T- and B-cell differentiation was not significantly altered in both mutp53 mice as compared with null mice (Figures 8c and d and Supplementary Figure S10).
Figure 8.
The R248Q allele causes expansion of bone marrow-derived hematopoietic progenitors and mesenchymal stem cell progenitors. (a) Total number of hematopoietic LSK (Lin−Sca1+c-Kit+) progenitors in the bone marrow from both femurs per mouse of 4–5-week-old mice of the indicated genotypes. *P<0.05, **P<0.01 (t-test). For (a–d) averages +/− S.E. are shown for each cell population. (b) Total number of mesenchymal stem cell (MSC) colonies from bone marrow of 6–7-week-old mice of the indicated genotypes. Wild-type, n=6; null, n=6; R248Q/−, n=6. *P<0.05, **P<0.01 (t-test). (b, right) Examples of Giemsa-stained colonies in 96-well plates. (c and d) R248Q and S245G mutant bone marrow progenitors undergo normal differentiation. Subpopulations were determined by FACS analysis using the indicated markers. None of the comparisons reach statistical significance (t-test). (c) Total number of the indicated T-cell (sub)populations per thymus of 4–5-week-old mice of the indicated genotypes. There was a trend toward a decrease in the DN4 subset of R248Q thymocyte differentiation compared with the corresponding null and G245S subsets. (d) Total number of the indicated B-cell (sub)populations from bone marrow of both femurs per mouse and from spleen of 4–5-week-old mice of the indicated genotypes. (e) MSCs isolated from bone marrow of −/− and Q/− mice show similar differentiation into adipocytes and osteocytes. MSCs were placed in basal media (left), adipocyte differentiation media and osteocyte differentiation media. Adipocytes and osteocytes were stained with histochemical differentiation markers Oil Red O and Alizarin Red S, respectively
We also evaluated the MSC population in the bone marrow of +/+, −/− and Q/− mice. We found a similar expansion of MSCs in R248Q mice compared with null mice (Figure 8b). MSCs derived from both −/− and R248Q/− mice showed expression of MSC markers Sca1, CD44 and CD29, and lacked expression of hematopoietic markers CD45 and CD11b (Supplementary Figure S11). Both −/− and Q/− MSC populations were capable of differentiating into adipocytes and osteoblasts, indicating no perturbation of differentiation by the R248Q protein (Figure 8e). Overall, these data show that endogenous expression of the R248Q protein markedly drives expansion of the pool of early hematopoietic progenitors and MSCs in the bone marrow, but has no significant effect on subsequent stages of differentiation.
In sum, our results strongly support the notion that although both mutant hot spot p53 alleles have acquired GOF properties, individual mutp53 alleles have differential phenotypic impacts on onset and progression of spontaneous tumors in mice and humans. Specifically, the R248Q allele drives more aggressive tumor formation in mice compared with the G245S and p53-null alleles. This was associated with a twofold increase in cell proliferation in vivo and in vitro in T lymphomas of R248Q mice compared with G245S and null mice. These mouse models directly mirror the fact that human Li–Fraumeni carriers with codon 248 mutations display earlier tumor onset and higher tumor numbers per person at risk than Li–Fraumeni carriers with codon 245 and null mutations. Nevertheless, both mutant alleles have a broader tumor spectrum and enhanced signaling through the Akt pathway compared with the null allele, and this enhanced signaling may contribute to growth and aggressiveness of mutant p53 lymphomas.
Discussion
We report two novel hot spot mutp53 mouse models that strongly support the generality of the mutp53 GOF concept. However, although both models exhibit GOF activities in spontaneous tumorigenesis, as indicated by broader tumor spectrum and increased Akt signaling, the R248Q allele displays a higher level of oncogenic strength through its GOF activities at the organismal level. Importantly, human Li–Fraumeni patients with R248Q/+ genotypes also show a sharply earlier tumor onset by 10.5 years (median age 19.5 years) and higher tumor numbers as compared with patients with null/+ and G245S/+ genotypes (median age 30 and 30.5 years, respectively; Figure 5). This illustrates the direct relevance of our mouse models to human p53 tumorigenesis.
Interestingly, the strong in vivo GOF of R248Q contrasts with the previously reported weaker in vivo GOF of R248W, which exhibited a broader tumor spectrum but did not cause shorter latency or accelerated death.8 An attractive explanation for these biological differences is that different structural consequences of these two 248 mutations may lead to differential functions that affect their GOF properties. A recent biochemical study demonstrated that structural distortion mediated by certain p53 mutations, including R248Q, results in co-aggregation of mutant p53 proteins into higher-order structures with other tumor-suppressor transcription factors.26 Of note, R248W was not able to co-aggregate.26 In agreement, ectopic expression of R248Q but not R248W showed enhanced invasion in H1299 xenografts in vivo,27 confirming mutant p53 intracodon-specific differences in GOF properties.
Expression of R248Q caused expansion of pretumorous bone marrow-derived hematopoietic (LSK) and mesenchymal (MSC) progenitor pools (Figures 8a and b). Studies on the regulatory role of wtp53 in tissue stem cell niches established that wtp53 generally represses survival and self-renewal in hematopoietic, neural and breast epithelial compartments by various mechanisms.25, 28, 29 Detailed studies to elucidate the effects of mutant p53 on early stem cell compartments have not been conducted but will now become important. In mutant ES cells in the heterozygous +/mutant configuration, the high level of mutant p53 expression leads to significant dominant negative activity.30, 31 The importance of early progenitor perturbation as the primary oncogenic target cell during tumorigenesis of downstream cell populations is increasingly recognized.32 This may also be one mechanism of mutant p53 pathogenesis in mice and humans. Given the known role of mutp53 in inducing higher levels of genomic instability,33 mutp53 may allow more rapid acquisition of oncogenic lesions in early progenitors, thereby enabling faster transformation of differentiated derivatives and a significantly decreased tumor latency of many cell types, as exemplified in our R248Q KI mice.
In conclusion, our new humanized KI models currently provide the strongest support for the GOF hypothesis of mutant p53 in enhanced oncogenic signaling and spontaneous tumorigenesis. At the same time, they highlight allele-specific biological differences in the magnitude of this effect. Future work using these models will clarify the significance of progenitors in tumorigenesis and provide mechanistic explanations for genotype–phenotype correlations in Li–Fraumeni patients that might also shed light on different mutp53 alleles in sporadic tumors.
Materials and Methods
Ethics statement
All research involving animals has been conducted according to national and international guidelines with respect to husbandry, experimentation and welfare. All animal studies were approved by the institutional animal care and use committee at Stony Brook University.
Mice
Targeted iTL BA1 (C57BL/6 × 129/SvEv) hybrid ES cells were microinjected into C57BL/6 blastocysts. Resulting chimeras with high percentage Agouti coat color were mated to wild-type C57BL/6 mice to generate F1 heterozygous offspring. Tail DNA was genotyped to confirm germline transmission. For tumorigenesis studies, mice were initially crossed with p53−/− mice13 to generate heterozygous R248Q/− that were then interbred to obtain R248Q/R248Q, R248Q/− and −/− mice. A similar approach was used for the G245S mutation. The p53−/− mice from both breeding strategies had identical survival and tumor spectra and were combined for all analyses. All mice were of a mixed 129Sv/C57BL6 background. Mice were regularly monitored and killed when they became moribund. Careful necropsies were performed and tumors and all major organs collected, fixed in 10% formalin, embedded in paraffin and sectioned for histopathologic analysis. Cell suspensions were prepared from lymphoma samples for FACS analysis and characterized using T-cell, B-cell and myeloid surface markers.34, 35
MEFs and primary thymocyte treatments
MEFs were isolated from 12.5-day-old pups. For DNA damage studies, cells were treated with 250 nM of Doxorubicin for 24 h. Freshly isolated thymocytes were seeded at 1 million cells/ml and γ-irradiated at a dose of 5 Gy. Cells were collected at indicated time points and assessed for viability by staining for Annexin V (Roche, Indianapolis, IN, USA) and PI (Sigma, St. Louis, MO, USA). RNA was prepared with the RNeasy kit (Qiagen, Valencia, CA, USA) with on-column DNA digestion and reverse transcribed. cDNA was used in quantitative RT-PCR reactions using the SYBR green kit. A listing of primers is shown in Supplementary Figure S12. Relative expression of target genes were calculated using the ΔΔCT method.
Developmental experiments
Thymi, spleen and bone marrow cells were freshly isolated, suspended in red blood cell lysis buffer (8.26 g NH4Cl, 1 g KHCO3, 0.037 g EDTA in 1 l H2O) and filtered through a 40-μm filter. Cells were suspended in incubation buffer (PBS, 1% BSA) and stained for the indicated surface markers (Supplementary Figure S13). For intracellular p53 staining, cells were first stained for surface markers followed by resuspension in FACS lysis buffer (BD Biosciences, San Diego, CA, USA) for 15 min, and then resuspended in incubation buffer and stained for p53 (IC12, Cell Signaling, Danvers, MA, USA). Cells were washed two times with incubation buffer and analyzed by FACS. Cells were gated on forward and side scatter properties and subpopulations enumerated. MSCs were isolated in a similar manner as hematopoietic cells, plated in mesenchymal stem cell media (R&D Systems, Minneapolis, MN, USA) and enumerated according to the manufacturer's protocol.
T-lymphoma cell lines
T lymphomas were minced with a scalpel, suspended in red blood cell lysis buffer and filtered through a 40-μm filter. Cell lines were prepared by culturing cell suspensions in lymphoma media (225 ml DMEM, 225 ml IMDM, 10 ml of 200 mM ℒ-glutamine, 5 ml Pen/Strep, 500 μl of 55 mM β-Mercaptoethanol). NIH 3T3 cells were used as feeders for the first two passages, after which lymphoma cells were removed from feeders and used for assays. SKY was performed on early-passage (p3–p5) cells at the Roswell Park Cancer Institute, following published protocols.36
Immunohistochemistry and immunoblots
For immunohistochemical staining, slides were deparaffinized and boiled in citrate buffer (10 mM, pH 6.0, 10 min) for antigen retrieval. Slides were blocked in 1% goat serum and stained with anti-histone H3 (phosphor S28; Cell Signaling) or anti-p53 (FL393; Santa Cruz, Santa Cruz, CA, USA). For TUNEL staining, the In Situ Cell Death Detection kit (Roche) was used according to the manufacturer's instructions. Immunoblots were carried out using standard protocol. Antibodies used were as follows: IC12 for p53 (Cell Signaling), p21 (BD Pharmingen, San Diego, CA, USA), ERK1/2 (Millipore, Billerica, MA, USA), c-Myc (Santa Cruz), PUMA, Cleaved Casp, cleaved Notch, Aurora A, p-Akt, Akt, p-S6K, p-S6 and PTEN (all from Cell Signaling).
Cloning and retroviral infection
HUPKI R248Q and G245S p53 cDNAs were prepared from mRNA derived from MEFs of R248Q/− and G245S/− embryos. The open reading frame was PCR-amplified with primers complementary to the 5′ (CTCTCGAATTCATGACTGCCATGGAGGAGTCACAGTCGG) and 3′ (TGGGCGGCCGCTCAGTCTGAGTCAGGCCCCACTTT) ends of the mouse p53 gene with flanking EcoR1 (5′) and Not1 (3′) restriction sites (underlined). PCR products were subcloned into pBluescript vector, sequenced confirmed, and subcloned into the REBNA-puro and MSCV-IRES-GFP vectors.37 For retroviral infection, plasmids were transfected into Phoenix E packaging cells and 24–48 h later, supernatants were collected. Lymphoma cells were suspended in virus media and spinoculated for 45 min at 1000 r.p.m. This process was repeated three times at 4-h intervals. After 2 days, cells were selected in puromycin for 2 days. For infections with MSCV-IRES-GFP, cells were FACS sorted for GFP expression 2 days after infection.
Statistics
For survival analysis, P-values were determined by log-rank analysis. P-values for tables in Figures 3c and 4c were determined by two-tailed Student's t-test. P-values in the table in Figure 5a were determined by ranked sum test. All other statistical tests were performed by two-tailed Student's t-test.
Online Supplementary Material
Supplementary Figure S1 indicates the tumor spectrum of mice in this study. Supplementary Figure S2 shows histology of tumor types found in mice. Supplementary Table S1 shows a detailed breakdown of the tumor types found in our mice. Supplementary Figure S3 shows immunophenotyping by FACS analysis of T and B lymphomas. Supplementary Figure S4 shows a detailed breakdown of all SKY analyses performed in this study. Supplementary Figure S5 shows a representative SKY analysis of a T-lymphoma sample. Supplementary Figure S6 shows immunoblot indicating a similar level of p-Akt signaling among cultured cell lines derived from −/− and Q/− mice. Supplementary Figure S7 shows a representative p53 IHC staining performed on normal tissues and tumors from Q/− mice. Supplementary Figure S8 shows FACS analysis of intracellular p53 in normal cells and a tumor cell line. Supplementary Figure S9 shows co-immunoprecipitation experiment between the R248Q and G245S proteins and p63 and p73. Supplementary Figure S10 shows a representative FACS analyses indicating that differentiation of normal T and B cells from R248Q/− mice is not altered compared with p53-null mice. Supplementary Figure S11 shows FACS staining of MSCs for MSC and hematopoietic markers. Supplementary Figure S12 shows primers used in qRT-PCR experiments. Supplementary Figure S13 shows cell surface markers used to identify subpopulations of T and B cells.
Acknowledgments
This work was funded by grants from the National Cancer Institute (CA060664) and the Carol Baldwin Breast Cancer Research Fund to UMM. We thank A Vaseva for technical assistance.
Glossary
- GOF
gain of function
- KI
knock-in
- HUPKI
humanized p53 knock-in
- ES
embryonic stem
- MEF
mouse embryonic fibroblast
- ALL
acute lymphoblastic leukemia
- LSK
Lin−Sca1+c-Kit+
- MSC
mesenchymal stem cell
The authors declare no conflict of interest.
Footnotes
Supplementary Information accompanies this paper on Cell Death and Differentiation website (http://www.nature.com/cdd)
Edited by K Vousden
Supplementary Material
References
- Hollstein M, Sidransky D, Vogelstein B, Harris CC. p53 mutations in human cancers. Science. 1991;253:49–53. doi: 10.1126/science.1905840. [DOI] [PubMed] [Google Scholar]
- Vaseva AV, Moll UM. The mitochondrial p53 pathway. Biochim Biophys Acta. 2009;1787:414–420. doi: 10.1016/j.bbabio.2008.10.005. [DOI] [PMC free article] [PubMed] [Google Scholar]
- Oren M, Rotter V. Mutant p53 gain-of-function in cancer. Cold Spring Harb Perspect Biol. 2010;2:a001107. doi: 10.1101/cshperspect.a001107. [DOI] [PMC free article] [PubMed] [Google Scholar]
- Sigal A, Rotter V. Oncogenic mutations of the p53 tumor suppressor: the demons of the guardian of the genome. Cancer Res. 2000;60:6788–6793. [PubMed] [Google Scholar]
- Freed-Pastor WA, Prives C. Mutant p53: one name, many proteins. Genes Dev. 2012;26:1268–1286. doi: 10.1101/gad.190678.112. [DOI] [PMC free article] [PubMed] [Google Scholar]
- Olive KP, Tuveson DA, Ruhe ZC, Yin B, Willis NA, Bronson RT, et al. Mutant p53 gain of function in two mouse models of Li-Fraumeni syndrome. Cell. 2004;119:847–860. doi: 10.1016/j.cell.2004.11.004. [DOI] [PubMed] [Google Scholar]
- Lang GA, Iwakuma T, Suh YA, Liu G, Rao VA, Parant JM, et al. Gain of function of a p53 hot spot mutation in a mouse model of Li-Fraumeni syndrome. Cell. 2004;119:861–872. doi: 10.1016/j.cell.2004.11.006. [DOI] [PubMed] [Google Scholar]
- Song H, Hollstein M, Xu Y. p53 gain-of-function cancer mutants induce genetic instability by inactivating ATM. Nat Cell Biol. 2007;9:573–580. doi: 10.1038/ncb1571. [DOI] [PubMed] [Google Scholar]
- Liu DP, Song H, Xu Y. A common gain of function of p53 cancer mutants in inducing genetic instability. Oncogene. 2010;29:949–956. doi: 10.1038/onc.2009.376. [DOI] [PMC free article] [PubMed] [Google Scholar]
- Luo JL, Yang Q, Tong WM, Hergenhahn M, Wang ZQ, Hollstein M. Knock-in mice with a chimeric human/murine p53 gene develop normally and show wild-type p53 responses to DNA damaging agents: a new biomedical research tool. Oncogene. 2001;20:320–328. doi: 10.1038/sj.onc.1204080. [DOI] [PubMed] [Google Scholar]
- Cho Y, Gorina S, Jeffrey PD, Pavletich NP. Crystal structure of a p53 tumor suppressor-DNA complex: understanding tumorigenic mutations. Science. 1994;265:346–355. doi: 10.1126/science.8023157. [DOI] [PubMed] [Google Scholar]
- Bullock AN, Fersht AR. Rescuing the function of mutant p53. Nat Rev Cancer. 2001;1:68–76. doi: 10.1038/35094077. [DOI] [PubMed] [Google Scholar]
- Jacks T, Remington L, Williams BO, Schmitt EM, Halachmi S, Bronson RT, et al. Tumor spectrum analysis in p53-mutant mice. Curr Biol. 1994;4:1–7. doi: 10.1016/s0960-9822(00)00002-6. [DOI] [PubMed] [Google Scholar]
- Bertout JA, Patel SA, Fryer BH, Durham AC, Covello KL, Olive KP, et al. Heterozygosity for hypoxia inducible factor 1alpha decreases the incidence of thymic lymphomas in a p53 mutant mouse model. Cancer Res. 2009;69:3213–3220. doi: 10.1158/0008-5472.CAN-08-4223. [DOI] [PMC free article] [PubMed] [Google Scholar]
- Kleihues P, Schauble B, zur Hausen A, Esteve J, Ohgaki H. Tumors associated with p53 germline mutations: a synopsis of 91 families. Am J Pathol. 1997;150:1–13. [PMC free article] [PubMed] [Google Scholar]
- Bougeard G, Sesboue R, Baert-Desurmont S, Vasseur S, Martin C, Tinat J, et al. Molecular basis of the Li-Fraumeni syndrome: an update from the French LFS families. J Med Genet. 2008;45:535–538. doi: 10.1136/jmg.2008.057570. [DOI] [PubMed] [Google Scholar]
- Birch JM, Blair V, Kelsey AM, Evans DG, Harris M, Tricker KJ, et al. Cancer phenotype correlates with constitutional TP53 genotype in families with the Li-Fraumeni syndrome. Oncogene. 1998;17:1061–1068. doi: 10.1038/sj.onc.1202033. [DOI] [PubMed] [Google Scholar]
- Trkova M, Foretova L, Kodet R, Hedvicakova P, Sedlacek ZA. Li-Fraumeni syndrome family with retained heterozygosity for a germline TP53 mutation in two tumors. Cancer Genet Cytogenet. 2003;145:60–64. doi: 10.1016/s0165-4608(03)00031-1. [DOI] [PubMed] [Google Scholar]
- Petitjean A, Mathe E, Kato S, Ishioka C, Tavtigian SV, Hainaut P, et al. Impact of mutant p53 functional properties on TP53 mutation patterns and tumor phenotype: lessons from recent developments in the IARC TP53 database. Hum Mutat. 2007;28:622–629. doi: 10.1002/humu.20495. [DOI] [PubMed] [Google Scholar]
- Muller PA, Caswell PT, Doyle B, Iwanicki MP, Tan EH, Karim S, et al. Mutant p53 drives invasion by promoting integrin recycling. Cell. 2009;139:1327–1341. doi: 10.1016/j.cell.2009.11.026. [DOI] [PubMed] [Google Scholar]
- Torchia EC, Caulin C, Acin S, Terzian T, Kubick BJ, Box NF, et al. Myc, Aurora Kinase A, and mutant p53(R172H) co-operate in a mouse model of metastatic skin carcinoma. Oncogene. 2011;31:2680–2690. doi: 10.1038/onc.2011.441. [DOI] [PMC free article] [PubMed] [Google Scholar]
- Hsiao M, Low J, Dorn E, Ku D, Pattengale P, Yeargin J, et al. Gain-of-function mutations of the p53 gene induce lymphohematopoietic metastatic potential and tissue invasiveness. Am J Pathol. 1994;145:702–714. [PMC free article] [PubMed] [Google Scholar]
- Terzian T, Suh YA, Iwakuma T, Post SM, Neumann M, Lang GA, et al. The inherent instability of mutant p53 is alleviated by Mdm2 or p16INK4a loss. Genes Dev. 2008;22:1337–1344. doi: 10.1101/gad.1662908. [DOI] [PMC free article] [PubMed] [Google Scholar]
- Haines BB, Ryu CJ, Chang S, Protopopov A, Luch A, Kang YH, et al. Block of T cell development in P53-deficient mice accelerates development of lymphomas with characteristic RAG-dependent cytogenetic alterations. Cancer Cell. 2006;9:109–120. doi: 10.1016/j.ccr.2006.01.004. [DOI] [PubMed] [Google Scholar]
- Liu Y, Elf SE, Miyata Y, Sashida G, Liu Y, Huang G, et al. p53 regulates hematopoietic stem cell quiescence. Cell Stem Cell. 2009;4:37–48. doi: 10.1016/j.stem.2008.11.006. [DOI] [PMC free article] [PubMed] [Google Scholar]
- Xu J, Reumers J, Couceiro JR, De Smet F, Gallardo R, Rudyak S, et al. Gain of function of mutant p53 by coaggregation with multiple tumor suppressors. Nat Chem Biol. 2011;7:285–295. doi: 10.1038/nchembio.546. [DOI] [PubMed] [Google Scholar]
- Yoshikawa K, Hamada J, Tada M, Kameyama T, Nakagawa K, Suzuki Y, et al. Mutant p53 R248Q but not R248W enhances in vitro invasiveness of human lung cancer NCI-H1299 cells. Biomed Res. 2010;31:401–411. doi: 10.2220/biomedres.31.401. [DOI] [PubMed] [Google Scholar]
- Cicalese A, Bonizzi G, Pasi CE, Faretta M, Ronzoni S, Giulini B, et al. The tumor suppressor p53 regulates polarity of self-renewing divisions in mammary stem cells. Cell. 2009;138:1083–1095. doi: 10.1016/j.cell.2009.06.048. [DOI] [PubMed] [Google Scholar]
- Meletis K, Wirta V, Hede SM, Nister M, Lundeberg J, Frisen J. p53 suppresses the self-renewal of adult neural stem cells. Development. 2006;133:363–369. doi: 10.1242/dev.02208. [DOI] [PubMed] [Google Scholar]
- de Vries A, Flores ER, Miranda B, Hsieh HM, van Oostrom CT, Sage J, et al. Targeted point mutations of p53 lead to dominant-negative inhibition of wild-type p53 function. Proc Natl Acad Sci USA. 2002;99:2948–2953. doi: 10.1073/pnas.052713099. [DOI] [PMC free article] [PubMed] [Google Scholar]
- Lee MK, Sabapathy K. The R246S hot-spot p53 mutant exerts dominant-negative effects in embryonic stem cells in vitro and in vivo. J Cell Sci. 2008;121:1899–1906. doi: 10.1242/jcs.022822. [DOI] [PubMed] [Google Scholar]
- Kikushige Y, Ishikawa F, Miyamoto T, Shima T, Urata S, Yoshimoto G, et al. Self-renewing hematopoietic stem cell is the primary target in pathogenesis of human chronic lymphocytic leukemia. Cancer Cell. 2011;20:246–259. doi: 10.1016/j.ccr.2011.06.029. [DOI] [PubMed] [Google Scholar]
- Hanel W, Moll UM. Links between mutant p53 and genomic instability. J Cell Biochem. 2012;113:433–439. doi: 10.1002/jcb.23400. [DOI] [PMC free article] [PubMed] [Google Scholar]
- Morse HC, Anver MR, Fredrickson TN, Haines DC, Harris AW, Harris NL, et al. Bethesda proposals for classification of lymphoid neoplasms in mice. Blood. 2002;100:246–258. doi: 10.1182/blood.v100.1.246. [DOI] [PubMed] [Google Scholar]
- Kogan SC, Ward JM, Anver MR, Berman JJ, Brayton C, Cardiff RD, et al. Bethesda proposals for classification of nonlymphoid hematopoietic neoplasms in mice. Blood. 2002;100:238–245. doi: 10.1182/blood.v100.1.238. [DOI] [PubMed] [Google Scholar]
- Cowell JK, Matsui S, Wang YD, LaDuca J, Conroy J, McQuaid D, et al. Application of bacterial artificial chromosome array-based comparative genomic hybridization and spectral karyotyping to the analysis of glioblastoma multiforme. Cancer Genet Cytogenet. 2004;151:36–51. doi: 10.1016/j.cancergencyto.2003.09.012. [DOI] [PubMed] [Google Scholar]
- Petrenko O, Beavis A, Klaine M, Kittappa R, Godin I, Lemischka IR. The molecular characterization of the fetal stem cell marker AA4. Immunity. 1999;10:691–700. doi: 10.1016/s1074-7613(00)80068-0. [DOI] [PubMed] [Google Scholar]
- Marin MC, Jost CA, Brooks LA, Irwin MS, O'Nions J, Tidy JA, et al. A common polymorphism acts as an intragenic modifier of mutant p53 behaviour. Nat Genet. 2000;25:47–54. doi: 10.1038/75586. [DOI] [PubMed] [Google Scholar]
Associated Data
This section collects any data citations, data availability statements, or supplementary materials included in this article.


