Abstract
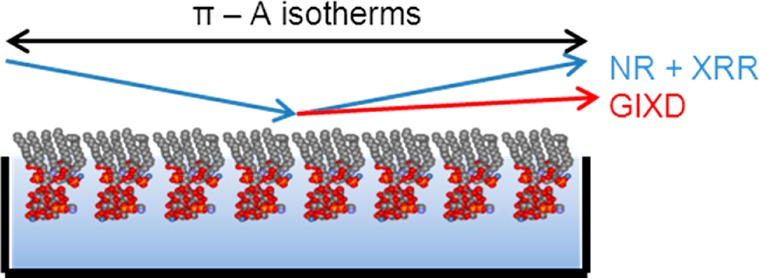
Lipopolysaccharides (LPS) make up approximately 75% of the Gram-negative bacterial outer membrane (OM) surface, but because of the complexity of the molecule, there are very few model OMs that include LPS. The LPS molecule consists of lipid A, which anchors the LPS within the OM, a core polysaccharide region, and a variable O-antigen polysaccharide chain. In this work we used RcLPS (consisting of lipid A plus the first seven sugars of the core polysaccharide) from a rough strain of Escherichia coli to form stable monolayers of LPS at the air–liquid interface. The vertical structure RcLPS monolayers were characterized using neutron and X-ray reflectometry, while the lateral structure was investigated using grazing incidence X-ray diffraction and Brewster angle microscopy. It was found that RcLPS monolayers at surface pressures of 20 mN m–1 and above are resolved as hydrocarbon tails, an inner headgroup, and an outer headgroup of polysaccharide with increasing solvation from tails to outer headgroups. The lateral organization of the hydrocarbon lipid chains displays an oblique hexagonal unit cell at all surface pressures, with only the chain tilt angle changing with surface pressure. This is in contrast to lipid A, which displays hexagonal or, above 20 mN m–1, distorted hexagonal packing. This work provides the first complete structural analysis of a realistic E. coli OM surface model.
Introduction
The cell envelope of Gram-negative bacteria is a complex structure. It consists of four different components: the inner membrane, periplasm, cell wall, and outer membrane.1,2 The inner membrane consists of a phospholipid bilayer and regulates the transport of materials in and out of the bacterial cell via specific transport proteins. The periplasm is the hydrophilic layer between the inner and outer membranes and contains the thin mesh of the peptidoglycan cell wall that maintains cell shape and rigidity. Finally, there is the outer membrane. The outer membrane is a highly asymmetric bilayer with phospholipids on the inner leaflet and lipopolysaccharides (LPS) on the outer1 and serves as a selectively permeable barrier. The outer membrane also contains a large variety of proteins that include porins, which facilitate the general diffusion of small molecules across the membrane, specialized channels and pumps for the transport of specific molecules, lipoproteins that anchor the outer membrane to the peptidoglycan layer, enzymes, and secretion complexes that assemble the outer membrane.3
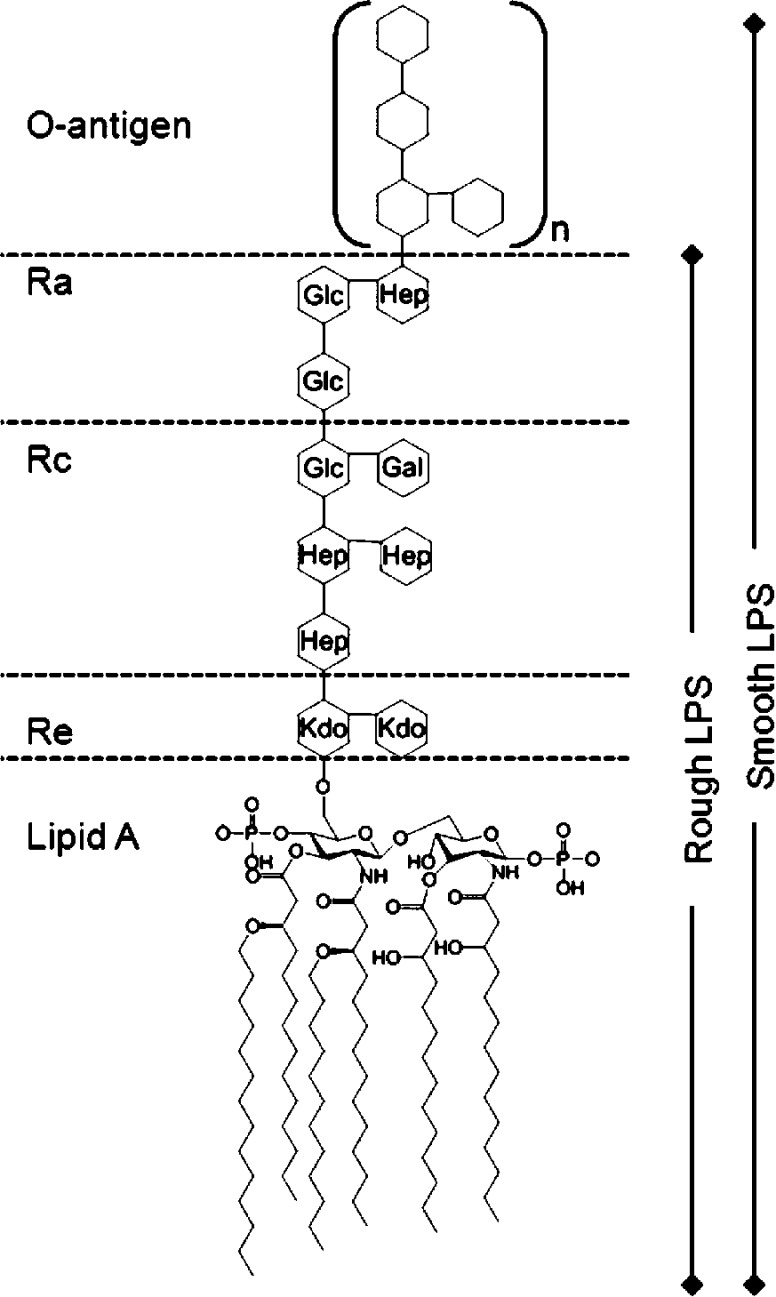
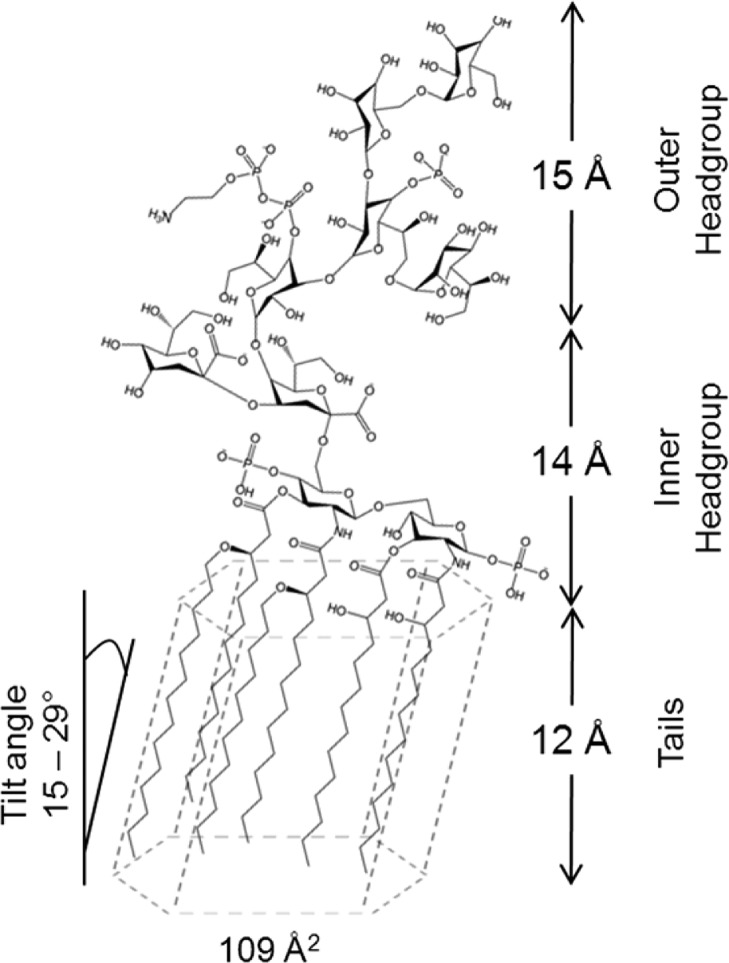
LPS (see Figure 1) consist of lipid A covalently linked to a core polysaccharide region and the variable O-antigen.4 Lipid A is the hydrophobic lipid component with four to seven fatty acid chains bound to a headgroup of two phosphorylated N-acetylglucosamines.5 The core polysaccharide region is conserved across bacterial species and is divided into an inner core, generally consisting of 2-keto-3-deoxyoctonoic acid (Kdo) and l-gycero-d-manno heptose (Hep) sugars, and an outer core of hexoses and hexosamines.6 The O-antigen is a long chain of polysaccharides that extend out into the environment, is highly variable, and differs between different bacterial serotypes. Bacterial strains that contain only the lipid A and the core region are termed rough mutants, and those that also contain the O-antigen are termed smooth strains. The rough LPS can be designated from Re to Ra, and this relates to the saccharides in the core region where the rough LPS terminates (Figure 1). LPS is also known as endotoxin because lipid A released into the bloodstream of mammals can play a key role in pathogenesis and stimulates the innate immune system triggering effects that include sepsis and septic shock.7 LPS also has pyrogenic effects. The release of LPS into the bloodstream stimulates the production of cytokines such as interleukin-1 by macrophages. The increased production of cytokines stimulates the hypothalamus to produce prostaglandins, which increases the body’s core temperature, culminating in a fever.5,7
Figure 1.
Schematic of the organization of Escherichia coli LPS.4 Kdo, 2-keto-3-deoxyoctonoic acid; Hep, l-gycero-d-manno heptose; Glc, glucose; Gal, galactose. The lipid A tails consist of five myristoyl chains and one palmitoyl chain. Additional phosphates and ethanolamines on the Kdo and Hep have been omitted for clarity.
The dynamic nature and complex composition of real biological membranes has resulted in a paucity of detailed structural information. A number of simplified models of membranes such as liposomes, black lipid membranes, or supported bilayers have been used to study the interactions of antimicrobial peptides,8,9 bacterial toxins,10−12 and drug-delivery vehicles,13−15 as well as to understand the physicochemical properties of membranes in nature.16,17 There are a number of ways to create models of the bacterial outer membrane, which include phospholipid bilayers of anionic lipids on solid supports such as silicon.8,9 This model simplistically represents the bilayer and the overall charge characteristics of a bacterial membrane. More complex models have included integral membrane proteins such as the porin outer membrane protein F (OmpF).18,19 However, most models of the bacterial outer membrane exclude LPS, a key component covering approximately 75% of the membrane surface.7
Previous studies have used LPS to create liposomes,20,21 liquid-supported monolayers,22−26 or solid-supported bilayers.27,28 However, most of these models only use pure, very short ReLPS (lipid A plus Kdo sugars, see Figure 1), pure lipid A, or a mix of the LPS with other lipids. These models have been used to study the effect of calcium ion binding24,26 or membrane disruption by antimicrobial agents.23,29,30 The current models reflect only the outer membrane surface of deep rough mutants of Gram-negative bacteria, accounting for only a small portion of known bacterial strains. Most Gram-negative bacteria contain smooth LPS, which due to the long polysaccharide chain are very water-soluble when purified. Despite this, one study has made a hybrid bilayer by depositing smooth LPS from Pseudomonas aeruginosa onto alkyl silane monolayers.27 In this work we pursue the approach of studying monolayers of LPS at the air–water interface. The primary advantage of this approach is the control of surface pressure and hence membrane fluidity afforded. One can therefore relatively easily study model membrane structure under conditions where the fluidity spans the complete range expected from native bacterial membranes. However, because of the large solubility of smooth LPS the task of forming such monolayers is problematic. In this paper we describe using a rough mutant of LPS from Escherichia coli, RcLPS, which contains seven sugars of the inner and outer core polysaccharide (Figure 1), to create monolayers at an air–water interface. We used reflectometry to investigate the structure of the monolayers perpendicular to the surface and grazing incidence diffraction and microscopy to investigate the lateral structure of the layers on the nano- and microscale, respectively.
Experimental Section
Materials
All chemicals were purchased from Sigma-Aldrich unless otherwise stated. Organic solvents were purchased from Merck. D2O was purchased from CDN Isotopes, Canada (for fermentation) or Sigma-Aldrich (for neutron experiments). Hydrogenous (1H) E. coli RcLPS and lipid A were purchased from Sigma-Aldrich.
Production of Deuterated RcLPS
Cultures of E. coli J5 (Rc mutant, ATCC no. 43745) were adapted to grow in ModC1 media with increasing % D2O in a stepwise manner as described by Chen et al.31 D2O adapted cultures were then used to inoculate a fermenter with 1 L 100% D2O ModC1 media with 40 g L–1 1H-glycerol as the carbon source. Cells were cultured at 37 °C until the glycerol carbon source was exhausted, yielding 36 g of wet cell mass.
Deuterated LPS was extracted by homogenizing dried cells with phenol/chloroform/petroleum spirit as originally described by Galanos et al.32 A detailed description of fermentation and extraction can be found in the Supporting Information. The purity of the RcLPS was assessed by SDS-PAGE (Supplemental Figure S1) and UV absorbance at 280, 260, and 230 nm. The quantity of RcLPS was determined by carrying out a KDO assay.33,34 The deuteration of the RcLPS was confirmed by FTIR spectroscopy (Supplemental Figure S2) showing strong C-D peaks at 2200 and 2100 cm–1. The neutron reflectivity data provided a good estimate of the deuteration level of the tail region, which was then extrapolated to the headgroup regions.
Surface Pressure Measurements
A model 302m Langmuir trough (Nima Technology Ltd., Coventry, U.K.) or a custom built trough was used for surface pressure measurements. All troughs were controlled by the Nima interface software. The liquid substrate was 20 mM sodium phosphate pH 7.0 in all cases. For experiments where the substrate contained D2O the difference in pH and pD was taken into account when preparing buffers. The RcLPS was deposited onto the liquid surface from RcLPS vesicles prepared by sonication (see Supporting Information for preparation) or from a solution of chloroform–methanol–water (6:4:1 by volume).
Brewster Angle Microscopy Imaging
Brewster angle microscopy (BAM) images were recorded on an EP3se imaging ellipsometer (Nanofilm Technology, Goettingen, Germany) mounted over a Langmuir trough (model 302m, Nima Technology Ltd., Coventry, U.K.). BAM images were recorded with fixed instrument parameters across each series of surface pressures. Although the image intensity is not quantitative, this does give an indication of the increasing or decreasing monolayer density with brighter or darker images, respectively.
Neutron Reflectometry
Neutron reflectometry (NR) experiments were carried out on the Liquids Reflectometer at the Spallation Neutron Source (Oak Ridge National Laboratory, Oak Ridge, TN, U.S.A.). The instrument utilizes a wavelength range of 3.13 Å ≤ λ ≤ 11.31 Å. Reflected beam spectra were collected over 14 angles from 0.46° to 4.24° with slit settings adjusted to maintain a constant illuminated area and data recorded on a 2D helium-3 detector. The data were reduced by stitching together each angle at the appropriate overlap regions, rebinning the data to instrument resolution, and correcting for background and detector efficiency. The final reflectivity profile is presented as a function of momentum transfer, Q, as defined by
where θ is the angle of incidence, and λ is the neutron wavelength. Additional data were collected on the INTER reflectometer35 at the ISIS pulsed neutron source (Rutherford Appleton Laboratory, Didcot, U.K.). This white beam instrument has a wavelength range of 1 Å ≤ λ ≤ 16 Å. The reflected beam was collected at 0.7° and 2.3°, yielding a momentum transfer range of 0.010–0.35 Å–1. Both instruments used custom-made Langmuir troughs contained within a sealed chamber to reduce evaporation of the liquid substrate and contamination of the surface by air-borne dust particulates.
Data was analyzed using the MOTOFIT reflectivity analysis software.36 The LPS monolayer is divided into a series of sublayers with a least-squares fitting routine to minimize χ2 values by varying the thickness, interfacial roughness, and neutron scattering length density (nSLD) of each sublayer. The model fitting of the reflectivity profiles yields information on the nSLD profile normal to the surface. The nSLD can be considered to be the neutron reflective index and is a function of the chemical composition of each material according to
where NA is Avogadro’s number and pi the mass density, Ai the atomic mass, and bi the nuclear scattering length of component i. Comparison of the fitted nSLD for each layer to the theoretical nSLD values (Supplementary Table S1) enables the volume fraction to be calculated. Neutrons are sensitive to isotopic composition, and in this work D2O and air contrast matched water (ACMW) substrates were used. The D2O substrate highlights the hydrogenous RcLPS and lipid A and ACMW, which has a nSLD equal to air, highlights the deuterated RcLPS. Estimates of parameter uncertainties were obtained through using a Monte Carlo resampling procedure18,37 on the best data fits obtained using MOTOFIT.
X-ray Reflectometry and Grazing Incidence X-ray Diffraction
Synchrotron X-ray reflectometry (XRR) and grazing incidence X-ray diffraction (GIXD) experiments were carried out at the ChemMatCARS beamline38,39 (15ID-C) at the Advanced Photon Source (Argonne National Laboratory, Argonne, IL, U.S.A.) with a liquid surface scattering reflectometer. For both the XRR and GIXD experiments, a custom-built Langmuir trough was enclosed in a hermetically sealed chamber backfilled with helium and translated during data collection to avoid beam damage to the monolayer. The incident X-ray energy used was 10 keV (λ = 1.24 Å), and data were collected on a Pilatus 100 K area detector.
XRR data were reduced by stitching together the data for each attenuator setting used at the appropriate overlap regions, correcting for background, and scaling the data so the reflectivity at the critical edge is unity. As reflectivity decreases sharply with increasing Q, the data were plotted as RQ(4) vs Q to increase the visibility of features in the reflectivity profiles. The XRR data were fitted using MOTOFIT as described for the NR data analysis except that X-rays scatter from the electron cloud rather than the nucleus and are therefore insensitive to isotopic labeling. The X-ray scattering length density (xrSLD) then becomes
where re is the Bohr electron radius (2.818 × 10⁻¹⁵ m) and Zi is the atomic number of component i.
GIXD is performed with the X-ray beam at a constant angle of incidence with the surface, αi, slightly below the critical angle, αc, of the air–water interface (for more details on GIXD analysis see Supporting Information and reviews (40−44)). In GIXD measurements, the Pilatus area detector was used as a linear detector, with two pairs of matching horizontal slits placed in front of the detector. The scattered intensity was measured in two dimensions as a function of the vertical scattering angle, αf (i.e., along the vertical direction of the detector), where the angle between the incident and diffracted beam is 2θxy. By scanning 2θxy, the horizontal scattering vector (Qxy) and the vertical scattering vector (Qz) can be determined (see Supplemental Figure S3 for a pictorial description of the experiment). The GIXD data were reduced first by producing contour plots of intensity as a function of Qxy and Qz. GIXD patterns were obtained by integrating intensity along Qz yielding intensity vs Qxy plots. The GIXD patterns were then fitted for background, and a Gaussian function was fitted to each peak to determine peak position, relative intensity, and full-width half-maximum (FWHM). Data was also integrated along Qxy to yield intensity vs Qz plots, which provide profiles of the Bragg rods. The Qxy positions of the in-plane Bragg rods correspond to repeat distances, dhk (= 2π/Qxy) and can be indexed with Miller indices (h and k). From this the 2D unit cell parameters (a, b, γ) can be calculated. In GIXD only the ordered 2D crystalline alkyl chains of the LPS contribute to the diffraction pattern. Therefore the chain-like cylindrical molecules can pack only as either a hexagonal (a = b, γ = 120°), a distorted (rectangular) hexagonal (a ≠ b, γ = 90°), or an oblique hexagonal (a ≠ b, γ ≠ 90°). From the unit cell parameters the area per unit cell, area per molecule, and tilt angle of the chains from vertical can be deduced. The Scherrer formula, which uses the FWHM of the fitted peaks, yields information on the crystalline domain lengths, Lxy, of the monolayer.
Results
Deposition and Film Stability
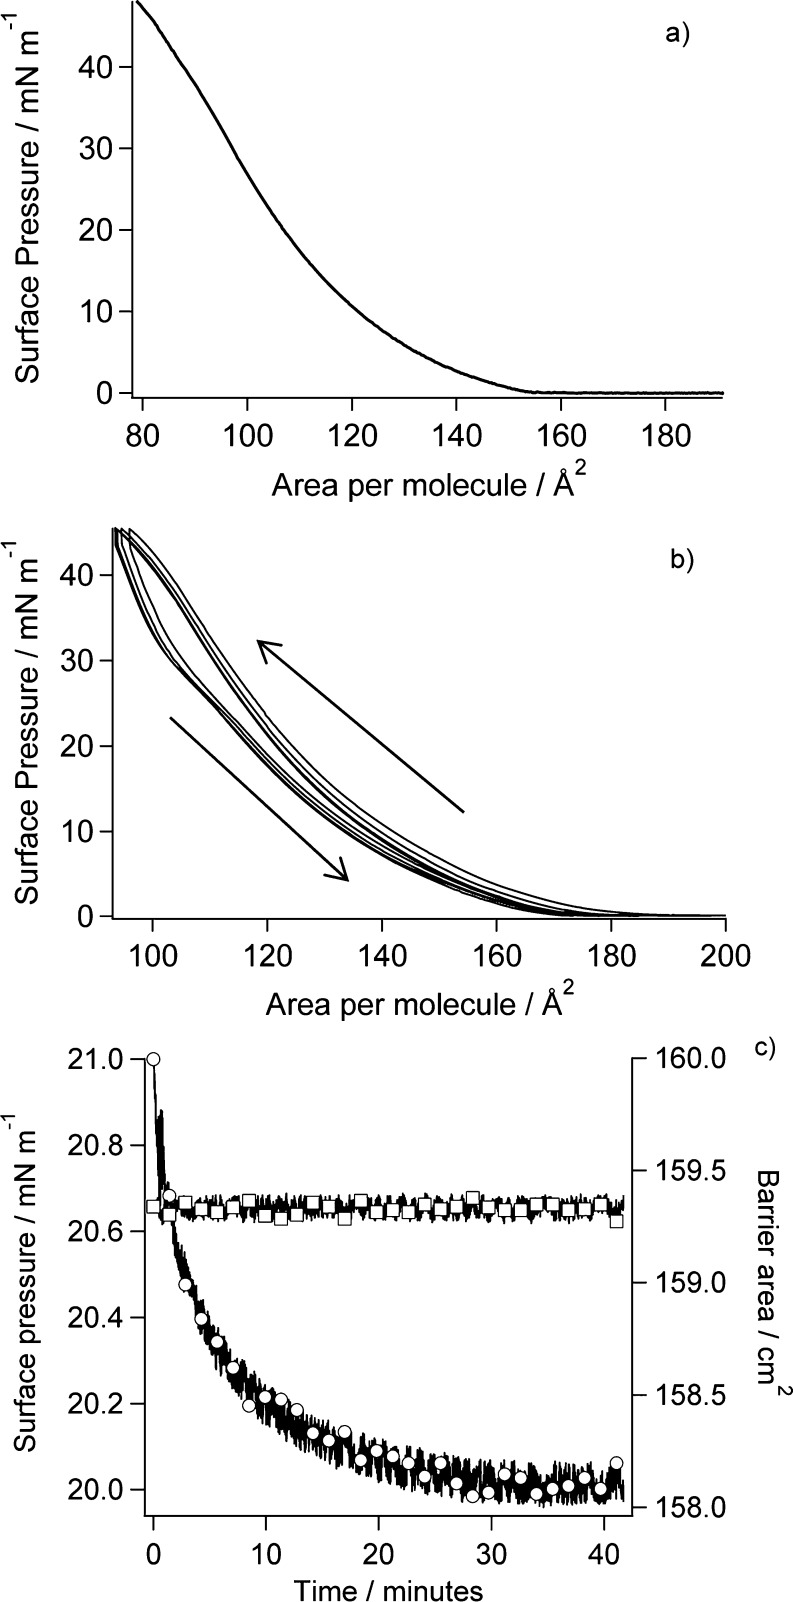
Initially RcLPS films were spread on buffered liquid surfaces (20 mM sodium phosphate, pH 7.0) by rolling RcLPS vesicles using the methods as described by Lakey and co-workers.10,45 However RcLPS dissolved in a chloroform–methanol–water (6:4:1 by volume) mixture, deposited dropwise onto the liquid surface, was subsequently shown to be preferable as it was faster and simpler with little difference in the final film characteristics (Supplemental Figure S4). For either method the trough barriers were set to approximately half the trough area, and the RcLPS film was spread to a surface pressure of 5–10 mN m–1. Once the surface pressure had stabilized, the barriers were opened completely, and the surface pressure was allowed to equilibrate before the pressure–area isotherm was conducted. The profile of the isotherm shows no obvious phase transition with just a smooth increase in surface pressure as the area is reduced (Figure 2a). There are discernible variations in the slope of the isotherm at 150 and 110 Å2; however, the isotherm does not display any sharp changes in slope that would indicate a phase transition. The isotherm resembles that of phosphatidylcholines with short saturated alkyl chains lengths (≤C14) that display a smooth increase in surface pressure with no marked phase transitions at ambient temperature.46,47 RcLPS has an overall negative charge, and the pressure–area isotherm also has a profile similar to that of the negatively charged phospholipid dimyristoyl phosphatidylglycerol (DMPG) at ambient temperature and physiological pH, with DMPG showing only a weak phase transition from liquid expanded to liquid condensed states.48 The RcLPS compresses to an area per molecule of ∼80 Å2 at surface pressures over 40 mN m–1. Phospholipids typically reach an area per molecule of about 40 Å2, where monolayer collapse occurs. The RcLPS has five myristoyl and one palmitoyl tail, whereas phospholipids have two chains leading to the different compressed areas. Upon multiple compressions and relaxations of the film the pressure–area isotherms do not completely overlay, with a small amount of hysteresis evident on each cycle (Figure 2b). This hysteresis is likely to be caused by small amounts of RcLPS migrating into the bulk liquid substrate, as might be expected given the high solubility of RcLPS. We therefore propose that the monolayer does not collapse into a bilayer or multilayer structure but rather that at high pressures there is slow loss of material to the subphase, which results in lower apparent area per molecule in the isotherms at high pressures and on repeated isotherms. The stability of the RcLPS monolayer was assessed as a function of time at a fixed barrier area (Figure 2c) with the initial surface pressure set to 20 mN m–1. Only a 1.0 mN m–1 change in surface pressure was observed over a 40 min period, which then plateaued, and the surface pressure remained stable.
Figure 2.
(a) Pressure–area isotherm of RcLPS deposited from chloroform–methanol–water. (b) Film stability of the RcLPS at the air–water interface by multiple pressure–area isotherms with arrows showing the direction of compression. (c) Film stability when the RcLPS film is held at a constant barrier area as a function of time. The circles are surface pressure (left axis), and the squares are barrier area (right axis).
Vertical Structure of RcLPS Monolayers
The neutron reflectometry data were collected at 20 mN m–1 as this pressure represents that found in cell membranes49−51 and the film produced is also stable over the several hours required to collect a data set (Figure 2c). Three nSLD contrasts were collected to build a fuller picture of the RcLPS monolayers: deuterated RcLPS on D2O and ACMW and hydrogenous RcLPS on D2O. There is a clear difference between the h-RcLPS and d-RcLPS NR profiles on D2O (Figure 3a), particularly with a lack of a fringe in the d-RcLPS data at Q ≈ 0.1, indicating deuteration of the d-RcLPS. The best fit of the data was achieved when the LPS monolayer was split into three discrete layers that account for the alkyl tails, inner headgroup, and outer headgroup from the air to the water substrate, respectively (Table 1). The thickness of the alkyl tails is 12 ± 2 Å, consistent with the theoretical thickness of fluid phase myristoyl tails. The tails are tightly packed with little solvent penetration as shown by the negligible (within error) difference in nSLD between the D2O and ACMW contrasts for d-RcLPS in the tail region (Figure 3b and Table 1). As the alkyl tails are tightly packed the level of the deuteration of the RcLPS can be inferred from the reflectivity data. The theoretical nSLD of myristoyl chains is 6.82 × 10⁻⁶ Å–2 (Supplemental Table S1). For our deuterated tail region we have a fitted nSLD value of 4.10 × 10⁻⁶ Å–2 (Table 1), and by taking the small amount of solvent penetration into account the resulting calculated deuteration level for the d-RcLPS is 63%. The thickness of the RcLPS tails is also consistent with the measured thickness of the lipid A tails (Table 1 and Supplementary Table S2).
Figure 3.
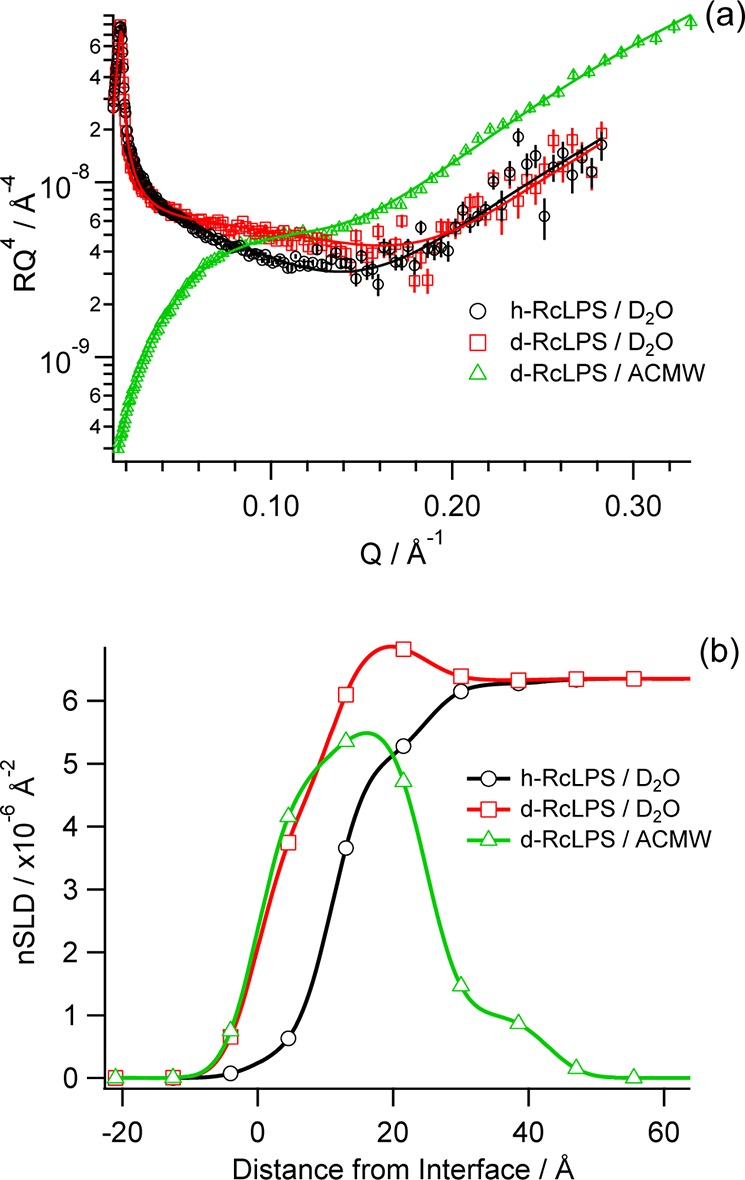
(a) Neutron reflectivity data (symbols with error bars) and fits (solid lines) of RcLPS at the air–water interface under pressure control at 20 mN m–1. Three contrasts were fitted globally with h-RcLPS on D2O (black), d-RcLPS on D2O (red), and d-RcLPS on ACMW (green). (b) The corresponding real-space nSLD profile with colors corresponding to those of the reflectivity profile.
Table 1. Globally Fitted Neutron Reflectivity Thicknesses and nSLDs of RcLPS Monolayer at 20 mN m–1.
| layer | thickness (Å) | nSLD h-RcLPS on D2O (× 10–6 Å–2) | nSLD d-RcLPS on D2O (× 10–6 Å–2) | nSLD d-RcLPS on ACMW (× 10–6 Å–2) |
|---|---|---|---|---|
| tails | 12 ± 2 | 0.63 ± 0.15 | 4.10 ± 0.89 | 4.65 ± 0.36 |
| inner headgroup | 14 ± 4 | 5.13 ± 0.59 | 6.90 ± 0.32 | 5.55 ± 0.51 |
| outer headgroup | 15 ± 3 | 6.23 ± 1.03 | 6.38 ± 0.13 | 1.27 ± 1.03 |
The polar headgroup of lipid A consists of two glucosamine sugars (Figure 1). The fitted thickness of the headgroups is 8 ± 1 Å hydrated with a solvent volume fraction of 0.722 (Supplementary Table S2 and Supplementary Figure S5). This is quite different from the sugar moiety of the RcLPS, which comprises the lipid A headgroups plus the first seven sugars of the core polysaccharide. To obtain an accurate fit the RcLPS headgroup has to be split into two layers. The first layer was 14 ± 4 Å deep, which is clearly thicker than the lipid A headgroup alone, and so this layer must include the lipid A headgroups plus another layer of sugars, possibly the first layer of Kdo sugars. Water can still penetrate through to this inner headgroup layer, however, with only a 0.459 solvent volume fraction, and therefore the amount of solvent in the RcLPS inner headgroups was less than in the lipid A headgroups (cf. nSLD values for inner headgroups in Table 1 with the headgroup nSLD values in Supplementary Table S2). To calculate the volume fraction of the inner headgroup layer for the deuterated RcLPS headgroups, a deuteration level of 63% that was calculated from the tails region was used as the extent of headgroup deuteration. The outer headgroup of the RcLPS was 15 ± 3 Å thick but was more hydrated than the inner headgroup with a solvent volume fraction of 0.74 ± 0.12.
Synchrotron X-ray reflectivity experiments on the RcLPS films were carried out at surface pressures above and below those used for the NR experiments. As the surface pressure increases, the fringe at Q ≈ 0.35 in the XRR profiles becomes more prominent and shifts to a slightly lower Q value at the highest surface pressure (45 mN m–1) (Figure 4a). This is indicative of the RcLPS monolayer thickening due to increased ordering of individual molecules. At 10 mN m–1 the RcLPS monolayer is best fitted using a two-layer model split as tails and headgroups, whereas three layer models were used for all other surface pressures with the headgroups split into inner and outer layers (Table 2). The tail thickness at 10 mN m–1 was 11 Å, and increasing surface pressure to 30 and 45 mN m–1 resulted in the thickness of the chain region increasing to 18 and 20 Å, respectively. This would be anticipated if the tails become more upright with surface pressure increases (Table 2 and Figure 4b). The total thickness of the headgroups increased from 14 Å at a surface pressure of 10 mN m–1 to 16 Å at 45 mN m–1. This is likely due to the headgroups also becoming more orientated at higher surface pressures. The thickness of the outer headgroup region remains relatively constant with little change in thickness at the higher surface pressures (Table 2).
Figure 4.
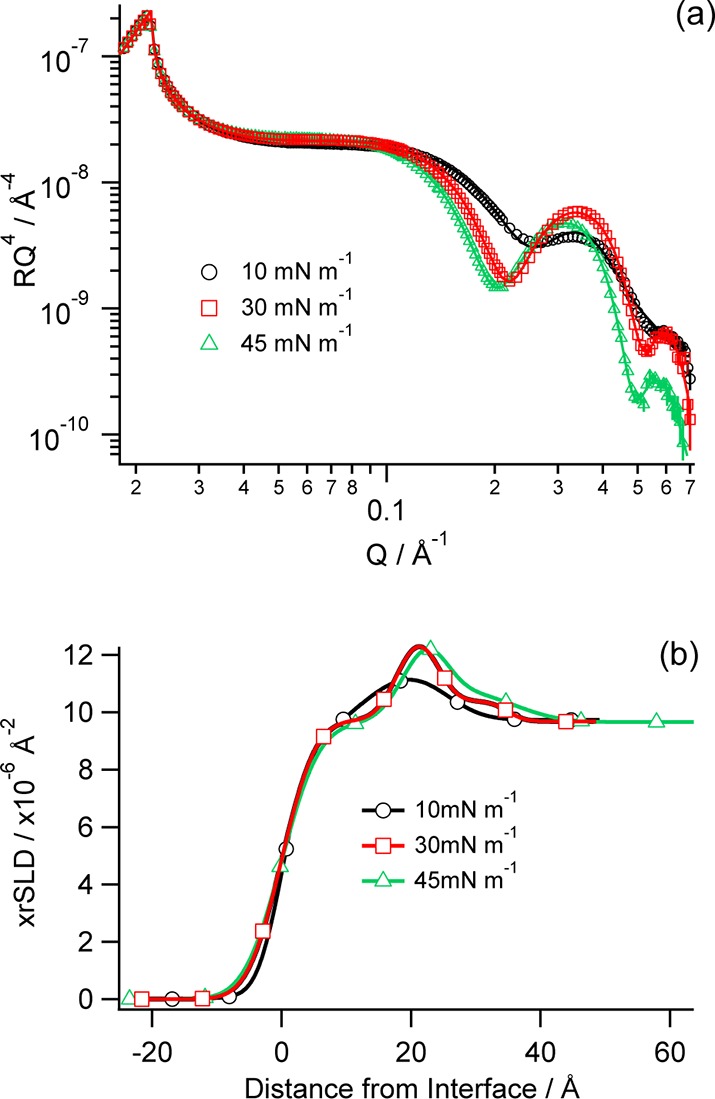
(a) X-ray reflectivity data (symbols with error bars) and fits (solid lines) of RcLPS at the air–water interface under pressure control at 10 mN m–1 (black), 30 mN m–1 (red), and 45 mN m–1 (green). (b) The corresponding real-space xrSLD profile with colors corresponding to those in the reflectivity profile.
Table 2. Thickness and xrSLD from X-ray Reflectometry Data of RcLPS Monolayers at Different Surface Pressures.
| tails |
inner
headgroup |
outer
headgroup |
||||
|---|---|---|---|---|---|---|
| surface pressure (mN m–1) | thickness (Å) | xrSLD (× 10–6 Å–2) | thickness (Å) | xrSLD (× 10–6 Å–2) | thickness (Å) | xrSLD (× 10–6 Å–2) |
| 10 | 11 ± 1 | 7.93 ± 0.04 | 14 ± 1 | 12.20 ± 0.01 | ||
| 30 | 18 ± 1 | 9.73 ± 0.01 | 6 ± 1 | 13.08 ± 0.02 | 11 ± 1 | 10.38 ± 0.02 |
| 45 | 20 ± 1 | 9.62 ± 0.01 | 5 ± 1 | 13.91 ± 0.02 | 11 ± 1 | 10.84 ± 0.04 |
Lateral Structure of the RcLPS Film
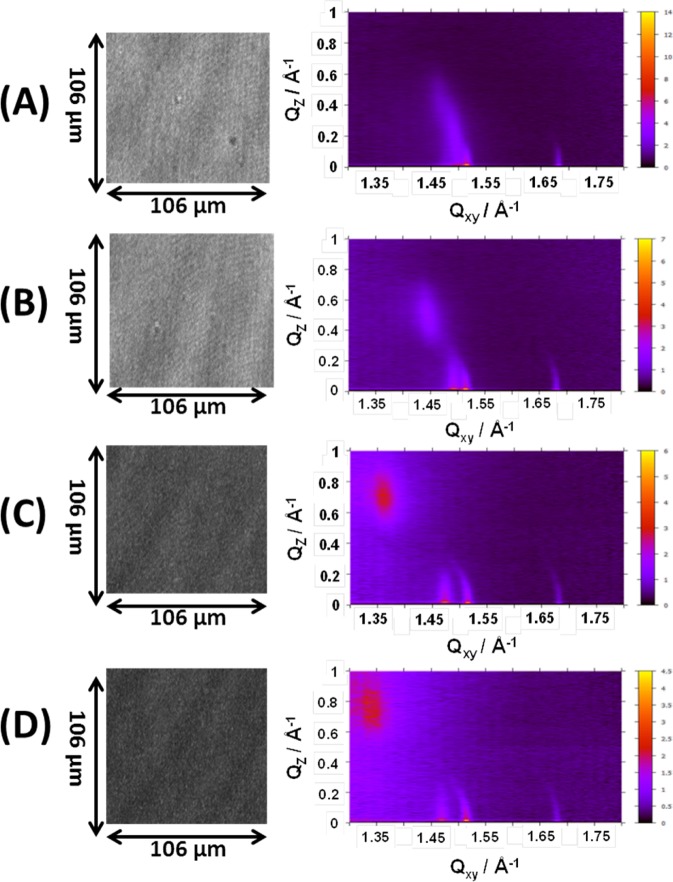
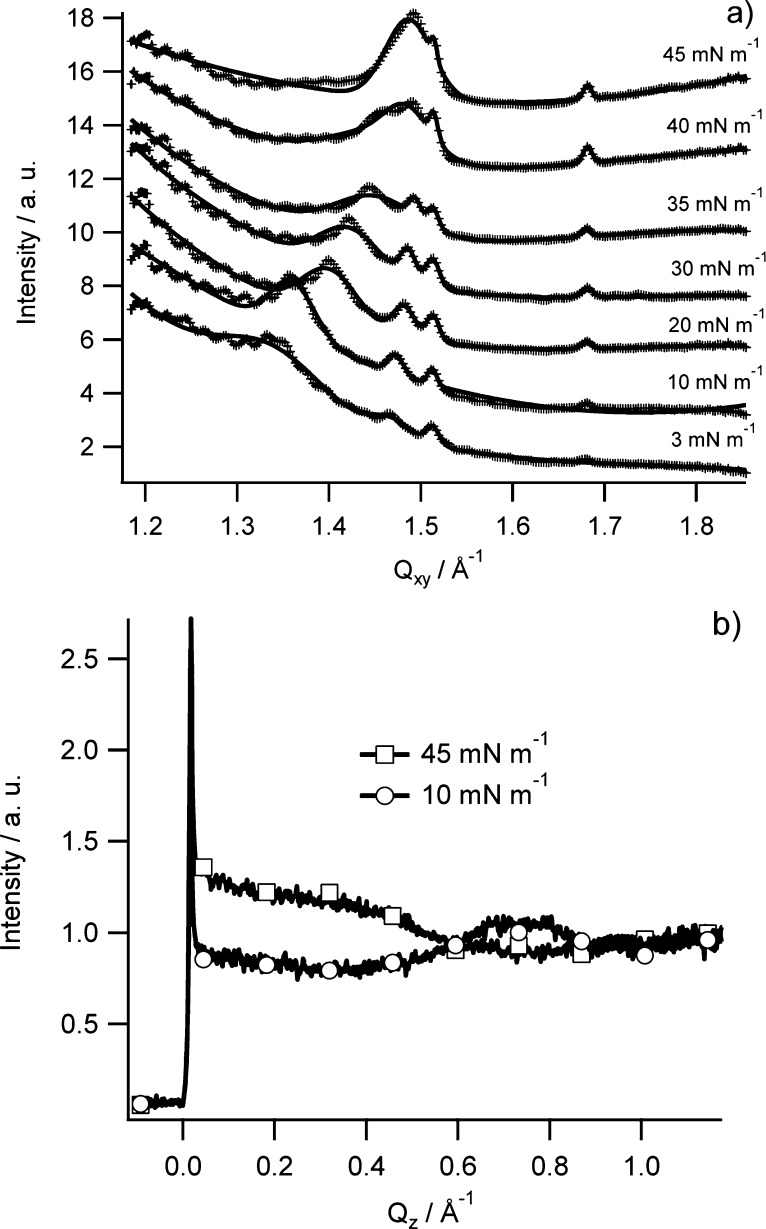
GIXD enables the study of the in-plane structure of the RcLPS and lipid A films as a function of surface pressure. A monolayer is not a single crystal, but rather consists of crystalline domains that are randomly orientated around the surface normal, creating a 2D powder.42 In this work these domains are nanocrystalline with domain lengths, Lxy, ranging from 94 to 748 Å (Table 3). When the RcLPS monolayer is at low surface pressures of ∼3 mN m–1 there are three in-plane peaks with a weak signal (Figure 5). At 20 mN m–1 these peaks become more intense and more clearly defined, with the highest surface pressure (45 mN m–1) achieving greatest observed intensity (Figures 5 and 6). This implies that there is an increasing amount of nanocrystalline RcLPS material in the monolayer with increasing surface pressure. When the GIXD data in Figure 5 is integrated along Qz (Figure 6a) the in-plane peaks can be indexed with the Miller indices of {10}, {01}, and {1-1} corresponding to an oblique hexagonal packing of the hydrocarbon chains of the RcLPS. There is also a broad out-of-plane peak (Qxy = 1.343 Å–1) at 3 mM m–1 that shifts to higher values of Qxy as the surface pressure increases, eventually merging with the in-plane peak at Qxy = 1.498 at 45 mN m–1 (Figures 5 and 6a). As shown in Table 3, the unit cell dimensions vary with surface pressure but generally a ≈ 4.33 Å, b ≈ 4.25 Å, and γ ≈ 81.3°, which confirms the oblique hexagonal packing (a ≠ b, γ ≠ 90°) and corresponds to an area per unit cell, Acell ≈ 18.2 Å2, consistent with literature values for lipid hydrocarbon tails of DPPG, lipid A, and ReLPS23,24,29,41 and gives an area per LPS molecule of 109 Å2. Figure 6b shows the GIXD data integrated along Qxy, and the peak at Qz = 0 is the Vineyard–Yoneda peak, which results from interference by the diffracted X-rays from the Bragg rod and reflected rays at the interface. No further peaks after Qz = 0 indicate no or little molecular tilting from the surface normal, whereas a peak at Qz > 0 (e.g., 10 mM m–1 in Figure 6b) indicates tilting. Calculation of the tilt angle shows that it changes with surface pressure. At 3 mN m–1 the tilt angle is 28.9°, decreasing to 14.9° at 45 mN m–1 (Table 3), demonstrating that the RcLPS becomes more perpendicular to the plane of the surface as surface pressure increases.
Table 3. RcLPS Monolayer Crystalline Parameters Determined by GIXD as a Function of Surface Pressure.
| surface pressure (mN m–1) | a, b (Å) | γ (deg) | Acell (Å2) | Ao (Å2) | Amol (Å2) | tilt angle (deg) | Lxy (Å) |
|---|---|---|---|---|---|---|---|
| 3 | 4.39, 4.25 | 80.6 | 18.4 | 16.1 | 110.4 | 28.9 | 110, 543, — |
| 10 | 4.37, 4.25 | 80.8 | 18.3 | 16.3 | 109.8 | 27.2 | 288, 513, — |
| 20 | 4.33, 4.24 | 81.3 | 18.2 | 16.7 | 109.2 | 23.0 | 194, 353, 424 |
| 30 | 4.27, 4.19 | 82.1 | 17.8 | 16.6 | 106.8 | 21.1 | 284, 317, 379 |
| 35 | 4.29, 4.24 | 81.8 | 18.0 | 17.1 | 108.0 | 17.8 | 394, 421, 480 |
| 40 | 4.32, 4.24 | 81.3 | 18.1 | 17.4 | 108.6 | 16.5 | 100, 547, 481 |
| 45 | 4.32, 4.25 | 81.4 | 18.2 | 17.5 | 109.2 | 14.9 | 94, 748, 528 |
Figure 5.
BAM (left) and GIXD (right) images for an RcLPS film at (A) 45, (B) 35, (C) 10, and (D) 3 mN m–1. The Bragg rods in the GIXD can be seen at Qxy ≈ 1.47, 1.51, and 1.68 Å–1, which result from the diffraction of the crystalline lipid tails. The out-of-plane peak that shifts with surface pressure can also be observed at Qxy, Qz 1.472, 0.39 Å–1 in panel A and 1.34, 0.74 Å–1 in panel D.
Figure 6.
(a) 2D plots of the GIXD data integrated over Qz with points as the collected data and lines as the fits. (b) 2D plots of the GIXD data integrated over Qxy for 45 mN m–1 (squares) and 10 mN m–1 (circles).
BAM provides a lateral view of the RcLPS monolayers on the micrometer scale. In the BAM images (Figure 5) there is no evidence for the formation of domains, demonstrating that there were no clear phase transitions as a function of surface pressure. This is consistent with the GIXD data and the area–pressure isotherms (Figures 5 and 2). As the surface pressure decreases, the images became darker, indicating a reduced density or packing of the monolayer at lower surface pressures.
Discussion
In this work we have carried out a detailed structural analysis of monolayers of LPS from a rough mutant of E. coli at the air–water interface. The deposition of this water-soluble biomolecule has been successfully carried out from an organic solution, and as far as we are aware this is the longest pure LPS molecule to be successfully deposited at an air–liquid interface. There have been reports of deposition of smooth LPS molecules at the air–water interface, but the smooth LPS has to be mixed with a phospholipid to achieve a stable monolayer.52 LPS from Pseudomonas aeruginosa PAO1 strain, which contains a variety of smooth and rough LPS with different length polysaccharide chains,53 has been deposited to form monolayers at the air–water interface.22 The current work is a significant advance because the use of a single pure form of LPS provides clear structural information. The maximum surface pressure achieved using RcLPS (45 mN m–1; Figure 2) is similar to that from monolayers of P. aeruginosa smooth LPS (52 mN m–1).22 Furthermore, the isotherms of RcLPS are similar to those of the shorter, more hydrophobic ReLPS and lipid A.
The total thickness of the RcLPS monolayer at 20 mN m–1 is 41 Å, and the monolayer can be divided into three distinct layers (Figure 3b and Table 1). The upper (in air) layer comprises the lipid tails, mainly myristoyl chains. The maximum thickness that these can extend has been reported as approximately 17 Å,54 which is consistent with the thickness of the lipid A tails component of the RcLPS and lipid A observed in our studies (Tables 1 and 2 and Supplementary Table S2). From the XRR analysis the hydrocarbon chains were found to be slightly thicker, 18 Å and 20 Å at surface pressures of 30 and 40 mN m–1, respectively, which is within the margin of error and shows that at these pressures the tails are perpendicular to the plane of the surface. This slight increase compared to the theoretical maximum thickness may indicate that the monolayer structure is being influenced by packing constraints of the large headgroups. This would not be an issue for simple molecules such as myristic acid where the headgroup has a similar or smaller projected area than the tail. The RcLPS inner headgroup thickness was determined by NR to be 14 Å at 20 mN m–1. This became thinner at the higher surface pressures (cf. Tables 1 and 2), but the larger Q-range accessible via X-ray measurements gave a higher spatial resolution, and the inner headgroup thickness is consistent with the headgroup of lipid A only. Jeworrek et al.24 found that the headgroup thickness for ReLPS (Figure 1) was 12 Å at 20 mN m–1. In addition, neutron diffraction studies of P. aeruginosa LPS found that the inner core polysaccharides are 13 Å thick.53 These results are consistent with the inner headgroup thickness determined in this work, and it is likely that the inner headgroup consists of the lipid A glucosamine headgroup and the Kdo sugars and therefore the outer headgroups are the remaining sugars (Figure 7). The hydration of the inner headgroup is lower than that of the outer headgroup (Figure 3b), but this is consistent with previous observations,53,55 which found a decreased hydration of the inner core polysaccharide with increasing hydration in the outer core and further increases in hydration at the O-antigen. Studies investigating Ca2+ binding to LPS found that Ca2+ ions are concentrated at the core polysaccharide region27,55 and that Ca2+ is likely to bind predominately to the Kdo sugars of ReLPS,25,26 increasing the cross-linking of the inner core polysaccharide moieties. This would, consistent with our observations, reduce the solvation of the inner core polysaccharide region. Since we avoided the use of chelating agents such as EDTA our system will contain sufficient trace amounts of Ca2+ in buffers and RcLPS preparations to stabilize the inner headgroups in this way.
Figure 7.
Arrangement of RcLPS at the air–water interface. The RcLPS can be split into three discrete layers at surface pressures of 20 mN m–1 and above. The 2D crystalline tails pack as an oblique hexagonal with a total area of 109 Å2 and with a tilt angle from the surface normal of the RcLPS molecules that varies with surface pressure.
In addition to studying the vertical structure of the RcLPS monolayers, the chain packing and lateral structure were also investigated using GIXD and BAM (Figures 5 and 6). At all surface pressures an oblique hexagonal packing was observed, which is consistent with GIXD observations of Salmonella Minnesota R595 ReLPS monolayers apart from at low surface pressures (<10 mN m–1) where distorted hexagonal packing was observed.24 GIXD experiments with E. coli ReLPS showed no lateral ordering of the hydrocarbon tails in the absence of Ca2+ and chelating agents, with no diffraction observed, even at 30 mN m–1.25 Our observations with E. coli RcLPS were quite different as Bragg rods were observed at surface pressures as low as 3 mN m–1 (Figures 5d and 6a). However, as mentioned earlier, our preparations would have contained Ca2+ in the RcLPS polysaccharide regions. As GIXD observes only the organization of the hydrocarbon tails, one would expect the observations for lipid A and RcLPS monolayers to be similar. However the influence of the polysaccharide moieties on the chain packing was quite apparent. For lipid A monolayers, distorted hexagonal or hexagonal packing has been observed for surface pressures at or above 20 mN m–1,23,29,30 whereas in our investigation of RcLPS only oblique hexagonal packing was seen, demonstrating that polysaccharide chain length has an impact on the organization of the hydrocarbon chains. This has important consequences for our understanding of the packing of the bacterial outer membrane.
Figure 7 summarizes the orientation and conformation of the RcLPS at the air–water interface. The area per RcLPS molecule is surprisingly constant over all surface pressures, demonstrating that the crystalline areas of the film, when formed, do not change their packing. With increasing surface pressure these crystalline regions of the film cover an increasing proportion of the surface probably via the formation of new 2D nanocrystallites (see increasing intensity in Figure 6a). The size of the domains, however, remains in the hundreds of Ångström scale, and the crystalline regions are therefore not visible via BAM (Figure 5). One would assume that the crystalline area per molecule is the minimal value that can be obtained within the monolayer. The smaller areas obtained from the Langmuir isotherms are attributed to material being lost to the subphase rather than monolayer collapse into bi- or multilayer films. We see no evidence in the X-ray scattering for anything other than monolayer films.
Conclusions
We have successfully deposited stable monolayers of pure E. coli RcLPS at the air–liquid interface (using 20 mM sodium phosphate pH 7 as the liquid phase). The RcLPS monolayer reaches high surface pressures (45 mN m–1), beyond that likely to be encountered in the native Gram-negative bacterial cell membrane. Langmuir monolayers are therefore able to produce model monolayer surfaces with realistic surface topology and molecular fluidity. This successful creation of a stable RcLPS monolayer allowed the structure to be probed using a variety of techniques. Neutron reflectometry with its resolution enhanced by the deuteration of RcLPS showed that the RcLPS forms a structured 41 Å thick monolayer. This can be described by sublayers of tails, inner headgroups, and outer headgroups with increasing hydration from tails to outer headgroups. X-ray reflectivity and GIXD show that the RcLPS molecules arrange themselves more perpendicular to the surface with increasing surface pressure. These nanoscale structural changes observed by GIXD were not replicated on the microscale in Brewster angle microscopy analysis. This work not only provides valuable information on the structure of LPS at the air–liquid interface but also facilitates the development of more realistic Gram-negative bacterial membranes to study antimicrobial agent binding and bacterial interactions with surfaces.
Acknowledgments
The production of the deuterated RcLPS was undertaken at the National Deuteration Facility (proposal NDF1421), which was partly funded by the National Collaborative Research Infrastructure Strategy of the Australian Government. A portion of this research at ORNL’s Spallation Neutron Source was sponsored by the Scientific User Facilities Division (proposal IPTS-4051), Office of Basic Energy Sciences, U.S. Department of Energy. ChemMatCARS Sector 15 is principally supported by the National Science Foundation Department of Energy (NSF/CHE-0822838). Use of the Advanced Photon Source was supported by the U.S. Department of Energy, Office of Science, Office of Basic Energy Sciences, under contract no. DE-AC02-06CH11357. ISIS beam time was awarded through the use of proposal RB1110411. A.P.L.B. and S.A.H. acknowledge the award of funding from the Access to Major Research Facilities Programme (AMRFP10/11-N-22), International Synchrotron Access Programme (ISAP4385) and the Australian Institute for Nuclear Science and Engineering (AINSE). J.H.L. thanks the Wellcome Trust for support (grant number 093581/Z/10/Z). The authors thank Diamond Light Source Ltd for imaging ellipsometer access. A.P.L.B., P.J.H., and S.A.H. thank Marie Gillon and Rob Russell for technical assistance.
Supporting Information Available
Additional experimental details on the deuterated RcLPS production, detailed description of NR and GIXD data analysis and supplemental figures and tables. This material is available free of charge via the Internet at http://pubs.acs.org.
The authors declare no competing financial interest.
Supplementary Material
References
- Nikaido H. Microbiol. Mol. Biol. Rev. 2003, 67, 593. [DOI] [PMC free article] [PubMed] [Google Scholar]
- Ruiz N.; Kahne D.; Silhavy T. J. Nat. Rev. Microbiol. 2006, 4, 57. [DOI] [PubMed] [Google Scholar]
- Delcour A. H. Biochim. Biophys. Acta, Proteins Proteomics 2009, 1794, 808. [DOI] [PMC free article] [PubMed] [Google Scholar]
- Caroff M.; Karibian D. Carbohydr. Res. 2003, 338, 2431. [DOI] [PubMed] [Google Scholar]
- Alexander C.; Rietschel E. T. J. Endotoxin Res. 2001, 7, 167. [PubMed] [Google Scholar]
- Wilkinson S. G. Prog. Lipid Res. 1996, 35, 283. [DOI] [PubMed] [Google Scholar]
- Raetz C. R. H.; Whitfield C. Annu. Rev. Biochem. 2002, 71, 635. [DOI] [PMC free article] [PubMed] [Google Scholar]
- Fernandez D. I.; Le Brun A. P.; Lee T.-H.; Bansal P.; Aguilar M.-I.; James M.; Separovic F. Eur. Biophys. J. 2013, 42, 47. [DOI] [PubMed] [Google Scholar]
- Fernandez D. I.; Le Brun A. P.; Whitwell T. C.; Sani M.-A.; James M.; Separovic F. Phys. Chem. Chem. Phys. 2012, 14, 15739. [DOI] [PubMed] [Google Scholar]
- Clifton L. A.; Johnson C. L.; Solovyova A. S.; Callow P.; Weiss K. L.; Ridley H.; Le Brun A. P.; Kinane C. J.; Webster J. R. P.; Holt S. A.; Lakey J. H. J. Biol. Chem. 2012, 287, 337. [DOI] [PMC free article] [PubMed] [Google Scholar]
- Chenal A.; Prongidi-Fix L.; Perier A.; Aisenbrey C.; Vernier G.; Lambotte S.; Fragneto G.; Bechinger B.; Gillet D.; Forge V.; Ferrand M. J. Mol. Biol. 2009, 391, 872. [DOI] [PubMed] [Google Scholar]
- McGillivray D. J.; Valincius G.; Heinrich F.; Robertson J. W. F.; Vanderah D. J.; Febo-Ayala W.; Ignatjev I.; Lösche M.; Kasianowicz J. J. Biophys. J. 2009, 96, 1547. [DOI] [PMC free article] [PubMed] [Google Scholar]
- Shen H. H.; Hartley P. G.; James M.; Nelson A.; Defendi H.; McLean K. M. Soft Matter 2011, 7, 8041. [Google Scholar]
- Callow P.; Fragneto G.; Cubitt R.; Barlow D. J.; Lawrence M. J. Langmuir 2008, 25, 4181. [DOI] [PubMed] [Google Scholar]
- Dabkowska A. P.; Barlow D. J.; Campbell R. A.; Hughes A. V.; Quinn P. J.; Lawrence M. J. Biomacromolecules 2012, 13, 2391. [DOI] [PubMed] [Google Scholar]
- Wacklin H. P. Langmuir 2011, 27, 7698. [DOI] [PubMed] [Google Scholar]
- Fragneto G.; Charitat T.; Daillant J. Eur. Biophys. J. 2012, 41, 863. [DOI] [PubMed] [Google Scholar]
- Holt S. A.; Le Brun A. P.; Majkrzak C. F.; McGillivray D. J.; Heinrich F.; Loesche M.; Lakey J. H. Soft Matter 2009, 5, 2576. [DOI] [PMC free article] [PubMed] [Google Scholar]
- Cisneros D. A.; Muller D. J.; Daud S. M.; Lakey J. H. Angew. Chem., Int. Ed. 2006, 45, 3252. [DOI] [PubMed] [Google Scholar]
- D’Errico G.; Silipo A.; Mangiapia G.; Molinaro A.; Paduano L.; Lanzetta R. Phys. Chem. Chem. Phys. 2009, 11, 2314. [DOI] [PubMed] [Google Scholar]
- Kubiak J.; Brewer J.; Hansen S.; Bagatolli L. A. Biophys. J. 2011, 100, 978. [DOI] [PMC free article] [PubMed] [Google Scholar]
- Abraham T.; Schooling S. R.; Beveridge T. J.; Katsaras J. Biomacromolecules 2008, 9, 2799. [DOI] [PubMed] [Google Scholar]
- Ivankin A.; Livne L.; Mor A.; Caputo G. A.; DeGrado W. F.; Meron M.; Lin B.; Gidalevitz D. Angew. Chem., Int. Ed. 2010, 49, 8462. [DOI] [PMC free article] [PubMed] [Google Scholar]
- Jeworrek C.; Evers F.; Howe J.; Brandenburg K.; Tolan M.; Winter R. Biophys. J. 2011, 100, 2169. [DOI] [PMC free article] [PubMed] [Google Scholar]
- Oliveira R. G.; Schneck E.; Quinn B. E.; Konovalov O. V.; Brandenburg K.; Gutsmann T.; Gill T.; Hanna C. B.; Pink D. A.; Tanaka M. Phys. Rev. E: Stat., Nonlinear, Soft Matter Phys. 2010, 81, 041901. [DOI] [PubMed] [Google Scholar]
- Schneck E.; Schubert T.; Konovalov O. V.; Quinn B. E.; Gutsmann T.; Brandenburg K.; Oliveira R. G.; Pink D. A.; Tanaka M. Proc. Natl. Acad. Sci. U.S.A. 2010, 107, 9147. [DOI] [PMC free article] [PubMed] [Google Scholar]
- Schneck E.; Papp-Szabo E.; Quinn B. E.; Konovalov O. V.; Beveridge T. J.; Pink D. A.; Tanaka M. J. R. Soc., Interface 2009, 6, S671. [DOI] [PMC free article] [PubMed] [Google Scholar]
- Schneck E.; Oliveira R. G.; Rehfeldt F.; Deme B.; Brandenburg K.; Seydel U.; Tanaka M. Phys. Rev. E: Stat., Nonlinear, Soft Matter Phys. 2009, 80, 041929. [DOI] [PubMed] [Google Scholar]
- Neville F.; Hodges C. S.; Liu C.; Konovalov O.; Gidalevitz D. Biochim. Biophys. Acta, Biomembr. 2006, 1758, 232. [DOI] [PubMed] [Google Scholar]
- Neville F.; Ishitsuka Y.; Hodges C. S.; Konovalov O.; Waring A. J.; Lehrer R.; Lee K. Y. C.; Gidalevitz D. Soft Matter 2008, 4, 1665. [DOI] [PMC free article] [PubMed] [Google Scholar]
- Chen X.; Wilde K. L.; Wang H.; Lake V.; Holden P. J.; Middelberg A. P. J.; He L.; Duff A. P. Food Bioprod. Process. 2012, 90, 563. [Google Scholar]
- Galanos C.; Lüderitz O.; Westphal O. Eur. J. Biochem. 1969, 9, 245. [DOI] [PubMed] [Google Scholar]
- Karkhanis Y. D.; Zeltner J. Y.; Jackson J. J.; Carlo D. J. Anal. Biochem. 1978, 85, 595. [DOI] [PubMed] [Google Scholar]
- Proskurnin M. A.; Ageeva E. V.; Senyuta V. V.; Orlova N. V.; Fokin A. V.; Ovchinnikov O. B.; Egerev S. V. Talanta 2010, 81, 377. [DOI] [PubMed] [Google Scholar]
- Webster J.; Holt S.; Dalgliesh R. Phys. B (Amsterdam, Neth.) 2006, 385–386Part 21164. [Google Scholar]
- Nelson A. J. Appl. Crystallogr. 2006, 39, 273. [Google Scholar]
- Heinrich F.; Ng T.; Vanderah D. J.; Shekhar P.; Mihailescu M.; Nanda H.; Losche M. Langmuir 2009, 25, 4219. [DOI] [PubMed] [Google Scholar]
- Lin B.; Meron M.; Gebhardt J.; Graber T.; Schlossman M. L.; Viccaro P. J. Phys. B (Amsterdam, Neth.) 2003, 336, 75. [Google Scholar]
- Meron M.; Gebhardt J.; Brewer H.; Viccaro J., P.; Lin B. Eur. Phys. J. Spec. Top. 2009, 167, 137. [Google Scholar]
- Kaganer V. M.; Möhwald H.; Dutta P. Rev. Mod. Phys. 1999, 71, 779. [Google Scholar]
- Jensen T. R.; Balashev K.; Bjornholm T.; Kjaer K. Biochimie 2001, 83, 399. [DOI] [PubMed] [Google Scholar]
- Jensen T. R.; Kjaer K. In Novel Methods to Study Interfacial Layers; Moebius D., Miller R., Eds.; Elsevier Science B. V.: Amsterdam, 2001; p 205. [Google Scholar]
- Kjaer K. Phys. B (Amsterdam, Neth.) 1994, 198, 100. [Google Scholar]
- Jacquemain D.; Wolf S. G.; Leveiller F.; Deutsch M.; Kjaer K.; Als-Nielsen J.; Lahav M.; Leiserowitz L. Angew. Chem., Int. Ed. 1992, 31, 130. [Google Scholar]
- Lakey J. H.; Pattus F. Eur. J. Biochem. 1989, 186, 303. [DOI] [PubMed] [Google Scholar]
- Albrecht O.; Gruler H.; Sackmann E. J. Phys. (Paris) 1978, 39, 301. [Google Scholar]
- Yun H.; Choi Y. W.; Kim N. J.; Sohn D. Bull. Korean Chem. Soc. 2003, 24, 377. [Google Scholar]
- Garidel P.; Blume A. Chem. Phys. Lipids 2005, 138, 50. [DOI] [PubMed] [Google Scholar]
- Wang L.; Brauner J. W.; Mao G.; Crouch E.; Seaton B.; Head J.; Smith K.; Flach C. R.; Mendelsohn R. Biochemistry 2008, 47, 8103. [DOI] [PubMed] [Google Scholar]
- Demel R. A.; Geurts van Kessel W. S. M.; Zwaal R. F. A.; Roelofsen B.; van Deenen L. L. M. Biochim. Biophys. Acta, Biomembr. 1975, 406, 97. [DOI] [PubMed] [Google Scholar]
- Giehl A.; Lemm T.; Bartelsen O.; Sandhoff K.; Blume A. Eur. J. Biochem. 1999, 261, 650. [DOI] [PubMed] [Google Scholar]
- Cañadas O.; Keough K. M. W.; Casals C. Biophys. J. 2011, 100, 108. [DOI] [PMC free article] [PubMed] [Google Scholar]
- Abraham T.; Schooling S. R.; Nieh M.-P.; Kučerka N.; Beveridge T. J.; Katsaras J. J. Phys. Chem. B 2007, 111, 2477. [DOI] [PubMed] [Google Scholar]
- Johnson S. J.; Bayerl T. M.; McDermott D. C.; Adam G. W.; Rennie A. R.; Thomas R. K.; Sackmann E. Biophys. J. 1991, 59, 289. [DOI] [PMC free article] [PubMed] [Google Scholar]
- Kučerka N.; Papp-Szabo E.; Nieh M.-P.; Harroun T. A.; Schooling S. R.; Pencer J.; Nicholson E. A.; Beveridge T. J.; Katsaras J. J. Phys. Chem. B 2008, 112, 8057. [DOI] [PubMed] [Google Scholar]
Associated Data
This section collects any data citations, data availability statements, or supplementary materials included in this article.


