

Abstract
Objective
Preclinical data indicate that oxytocin, a hormone produced in the hypothalamus and secreted into the peripheral circulation, is anabolic to bone. Oxytocin knockout mice have severe osteoporosis, and administration of oxytocin improves bone microarchitecture in these mice. Data suggest that exercise may modify oxytocin secretion, but this has not been studied in athletes in relation to bone. We therefore investigated oxytocin secretion and its association with bone microarchitecture and strength in young female athletes.
Design
Cross-sectional study of 45 females, 14–21 years (15 amenorrheic athletes (AA), 15 eumenorrheic athletes (EA), and 15 nonathletes (NA)), of comparable bone age and BMI.
Methods
We used high-resolution peripheral quantitative CT to assess bone microarchitecture and finite element analysis to estimate bone strength at the weight-bearing distal tibia and non-weight-bearing ultradistal radius. Serum samples were obtained every 60 min, 2300–0700 h, and pooled for an integrated measure of nocturnal oxytocin secretion. Midnight and 0700 h samples were used to assess diurnal variation of oxytocin.
Results
Nocturnal oxytocin levels were lower in AA and EA than in NA. After controlling for estradiol, the difference in nocturnal oxytocin between AA and NA remained significant. Midnight and 0700 h oxytocin levels did not differ between groups. At the tibia and radius, AA had impaired microarchitecture compared with NA. In AA, nocturnal oxytocin correlated strongly with trabecular and cortical microarchitecture, particularly at the non-weight-bearing radius. In regression models that include known predictors of microarchitecture in AA, oxytocin accounted for a substantial portion of the variability in microarchitectural and strength parameters.
Conclusions
Nocturnal oxytocin secretion is low in AA compared with NA and associated with site-dependent microarchitectural parameters. Oxytocin maycontribute to hypoestrogenemic bone loss inAA.
Introduction
Oxytocin is a nine-amino acid peptide hormone produced in the supraoptic and paraventricular nuclei of the hypothalamus that is secreted in the brain and via the posterior pituitary gland to the circulation. Preclinical data indicate that oxytocin is anabolic to bone (1, 2). Oxytocin knockout mice have severe osteoporosis, and administration of oxytocin increases osteoblastic bone formation and improves microarchitecture, consistent with an anabolic effect of this hormone on bone (1).
Exercise-induced hypothalamic amenorrhea results in low bone mass, despite the known beneficial effects of weight-bearing exercise on bone (3, 4). Our group recently reported impaired bone microarchitecture as assessed by high-resolution peripheral quantitative computed tomography (HR-pQCT) (3) and lower bone strength as estimated using applied finite element analysis (5) in normal-weight amenorrheic athletes (AA) compared with eumenorrheic athletes (EA) and nonathletes (NA). Although there is evidence that oxytocin may increase acutely after some types of exercise, baseline unstimulated oxytocin secretion in athletes is not well defined (6, 7, 8, 9). A measure of unstimulated oxytocin secretion, such as integrated nocturnal levels, would be particularly important to examine in relation to bone parameters, which could be modulated by chronic exposure to this anabolic hormone. Estradiol stimulates oxytocin secretion; we therefore hypothesized that nocturnal oxytocin secretion would be low in hypoestrogenemic AA compared with EA and nonathletic controls. We also hypothesized that oxytocin deficiency may mediate hypoestrogenemic bone loss and therefore expected low nocturnal oxytocin in AA to be associated with impaired bone microarchitecture and strength parameters.
Subjects and methods
Subjects
We enrolled 45 adolescents and young adult women (15 AA, 15 EA, and 15 NA) between 14 and 21 years for this study. Clinical characteristics, bone microarchitecture parameters, and finite element analysis have been previously reported (3, 5). However, oxytocin levels and the relationship between oxytocin secretion and bone parameters have not been reported. All study participants were recruited from the community through advertisements and referrals from health care providers.
We defined amenorrhea as absence of menses for 3 months within a 6-month period of oligoamenorrhea (cycle length >6 weeks) or absence of menses at ≥16 years. We defined EA as those who had had ≥9 menses in the previous year. Inclusion criteria for athletes included at least 4 h of aerobic weight-bearing activity or 20 miles of running weekly for the preceding 6 months. Inclusion criteria for NA included <2 h/week of weight-bearing activities. The study was approved by the Institutional Review Board of the Partners HealthCare system. Informed consent was obtained from subjects at least 18 years old and parents of subjects younger than 18 years. Informed assent was obtained from subjects younger than 18 years.
Experimental protocol
Subjects were seen in the Clinical Research Center of Massachusetts General Hospital. The screening visit included a history and physical examination, and laboratories to rule out conditions other than excessive exercise accompanied by inadequate caloric intake that may cause hypothalamic amenorrhea. We thus ruled out hyperprolactinemia, primary ovarian failure, polycystic ovarian syndrome, and hypothyroidism. No subject had received medications known to impact bone metabolism (other than calcium and vitamin D supplements) within 3 months of the study.
Qualifying subjects were admitted for an overnight stay, which included a history and physical examination, 4-day food log, bone age assessment using the methods of Greulich & Pyle (10), and q 60-min frequent blood sampling overnight between 2300 and 0700 h for oxytocin. Serum samples were stored at −80 °C. Overnight hourly serum samples from each individual were pooled and then run as a single sample for average oxytocin levels. Midnight and 0700 h samples were used to assess diurnal variation. EA and NA were assessed in the early to mid follicular phase of their cycles (based on menstrual history).
Measurement of bone microarchitecture
HR-pQCT was used to measure volumetric density, morphology, and microarchitecture at the ultradistal radius and tibia (XtremeCT, Scanco Medical AG, Bassersdorf, Switzerland) with an isotropic voxel size of 82 μm (3, 11). Measurements were performed at the non-dominant wrist and leg unless there was a history of fracture, in which case the non-fractured side was measured. Outcome variables computed by automated analysis included area and volumetric density for total, trabecular, and cortical regions; cortical thickness and perimeter (12); and trabecular number, thickness, and separation. The precision is 0.7–1.5% for densities and 2.5–4.4% for trabecular and cortical architecture. Effective radiation dose was 0.027 mSv.
Finite element analysis
Linear micro-finite element analysis was used to calculate apparent biomechanical properties under uni-axial compression as described previously (13, 14, 15). Stiffness (kN/m) and load fraction carried by the proximal and distal cortical and trabecular compartments (%) were calculated. Failure load (kN) was estimated per previously published methods (15).
Biochemical analysis
Oxytocin was measured in unextracted serum by ELISA (Assay Designs, Inc., Ann Arbor, MI, USA). Samples from all study subjects were run at the same time. The lowest calibrator for this competitive ELISA is 15.6 pg/ml. The procedure was performed manually according to manufacturer instructions and as reported by others (16, 17, 18, 19, 20, 21). Plates were read at optical density of 405 nm, with correction between 570 and 590, and data calculations were done automatically using an automated ELISA platform (Triturus, Diagnostic Grifols, Barcelona, Spain). The limit of detection (lowest dose distinguishable from zero – 3 s.d.) was 7.0 pg/ml. Recovery based on dilution linearity (dF=1.0, 0.8, 0.6, 0.4) of a pooled serum containing 360 pg/ml oxytocin (based on the unextracted assay of undiluted specimen, dF=1.0) was 103% (range 100–109). While a large pool of serum read roughly tenfold lower when tested after extraction, individual study specimens showed only a roughly twofold difference and values obtained before and after extraction were highly correlated (r=1.00). Testing of unextracted specimens was monitored using in-house frozen quality control sera pools. The interassay coefficient of variations (CV) are 7.3, 10.1, and 8.7% for quality control sera containing 30, 371, and 508 pg/ml respectively. Fasting morning serum estradiol levels were measured using an ultrasensitive ELISA (Alpco, Salem, NH, USA; lower limit of detection 1.399 pg/ml, interassay CV 7.6%).
Statistical analysis
JMP Statistical Discoveries (version 9.0; SAS Institute, Inc., Cary, NC, USA) was used for statistical analyses. Hormone levels were not normally distributed and were therefore log-transformed before analysis. Clinical characteristics, hormone levels, and bone parameters were compared using overall ANOVA; variables that were significantly different were then compared by Fisher's least significant difference test. Within-group comparisons of hormone levels at different timepoints were made using the two-sided paired t-test. Linear regression analyses were used to investigate the relationships between oxytocin secretion and bone parameters. Multivariate least-square analyses were constructed to control for potential confounders. Stepwise regression analyses were performed to further investigate determinants of bone parameters. Statistical significance was defined as a two-tailed P value <0.05. Data are reported as mean±s.e.m.
Results
Subject characteristics
Subject characteristics are presented in Table 1. Bone age (17.6±0.1 years) and BMI (21.6±0.3 kg/m2) were comparable between groups. Mean age of menarche was later for AA compared with EA and NA. Self-reported caloric, calcium, and vitamin D intake did not differ between groups.
Table 1.
Subject characteristics, hormone levels, and bone microarchitecture.
| Mean±s.e.m. (pg/ml) |
P values |
||||||
|---|---|---|---|---|---|---|---|
| AA, n=15 | EA, n=15 | NA, n=15 | AA vs EA | AA vs NA | EA vs NA | Overall | |
| Chronological age (years) | 20.1±0.4 | 18.5±0.4 | 19.2±0.3 | 0.003 | NS | NS | 0.013 |
| Bone age (years) | 17.8±0.14 | 17.4±0.2 | 17.7±0.2 | – | – | – | NS |
| BMI (kg/m2) | 20.9±0.6 | 22.3±0.6 | 21.6±0.6 | – | – | – | NS |
| Age of menarche (years) | 14.6±0.6 | 12.9±0.3 | 12.1±0.4 | 0.012 | 0.0004 | NS | 0.001 |
| Nocturnal oxytocin (pg/ml) | 245±22 | 344±53 | 446±40 | NS | 0.0006 | 0.037 | 0.002 |
| Midnight oxytocin (pg/ml) | 276±45 | 451±115 | 350±63 | – | – | – | NS |
| 0700 h oxytocin (pg/ml) | 311±56 | 433±95 | 322±51 | – | – | – | NS |
| Estradiol (pg/ml) | 12.3±0.3 | 14.4±2.1 | 27.0±7.2 | – | – | – | NS |
| Microarchitecture | |||||||
| Distal tibia | |||||||
| Trabecular area (% total area) | 83.3±0.9 | 81.0±0.9 | 78.5±1.6 | NS | 0.007 | NS | 0.024 |
| Trabecular density (mg HA/cm3) | 192.3±6.6 | 211.5±7.9 | 207.3±8.7 | – | – | – | NS |
| Trabecular number (1/mm) | 1.74±0.06 | 1.99±0.04 | 2.01±0.07 | 0.003 | 0.002 | NS | 0.002 |
| Trabecular thickness (mm) | 0.093±0.004 | 0.089±0.003 | 0.087±0.004 | – | – | – | NS |
| Trabecular separation (mm) | 0.492±0.018 | 0.417±0.010 | 0.419±0.015 | 0.001 | 0.001 | NS | 0.001 |
| Cortical area (% total area) | 16.7±1.0 | 19.0±0.9 | 21.3±1.6 | NS | 0.011 | NS | 0.039 |
| Cortical density (mg HA/cm3) | 869.2±8.2 | 876.5±10.1 | 896.3±10.2 | – | – | – | NS |
| Cortical thickness (mm) | 1.12±0.06 | 1.29±0.05 | 1.29±0.07 | – | – | – | 0.086 |
| Cortical perimeter (mm) | 103.1±2.0 | 103.2±2.0 | 94.4±2.4 | NS | 0.007 | 0.006 | 0.007 |
| Total density (mm HA/cm3) | 305.9±10.3 | 338.0±12.6 | 356.1±18.2 | NS | 0.016 | NS | 0.048 |
| Stiffness (kN/m) | 223.6±7.1 | 247.7±7.6 | 211.3±8.0 | 0.030 | NS | 0.002 | 0.005 |
| Failure load (kN) | 11.2±0.4 | 12.4±0.4 | 10.6±0.4 | 0.028 | NS | 0.002 | 0.006 |
| Ultradistal radius | |||||||
| Trabecular area (% total area) | 80.2±1.1 | 80.3±1.1 | 75.6±1.6 | NS | 0.014 | 0.012 | 0.017 |
| Trabecular density (mg HA/cm3) | 156.0±6.7 | 176.8±8.0 | 191.6±9.1 | 0.074 | 0.003 | NS | 0.012 |
| Trabecular number (1/mm) | 1.94±0.07 | 2.04±0.05 | 2.07±0.06 | – | – | – | NS |
| Trabecular thickness (mm) | 0.067±0.003 | 0.072±0.003 | 0.077±0.004 | – | – | – | 0.080 |
| Trabecular separation (mm) | 0.456±0.019 | 0.423±0.013 | 0.411±0.013 | – | – | – | NS |
| Cortical area (% total area) | 17.9±1.3 | 17.8±1.3 | 23.0±1.7 | NS | 0.015 | 0.014 | 0.019 |
| Cortical density (mg HA/cm3) | 820.7±16.4 | 811.8±15.2 | 850.1±15.1 | – | – | – | NS |
| Cortical thickness (mm) | 0.685±0.044 | 0.710±0.043 | 0.896±0.073 | NS | 0.010 | 0.022 | 0.019 |
| Total density (mm HA/cm3) | 324.5±31.9 | 303.7±13.2 | 353.7±18.7 | – | – | – | NS |
| Cortical perimeter (mm) | 68.0±1.7 | 70.5±1.7 | 69.1±2.4 | – | – | – | NS |
| Stiffness (kN/m) | 70.1±3.8 | 79.8±3.3 | 83.9±4.0 | 0.073 | 0.012 | NS | 0.035 |
| Failure load (kN) | 3.6±0.2 | 4.1±0.2 | 4.2±0.2 | 0.074 | 0.015 | NS | 0.042 |
NS, nonsignificant. Statistically significant values are in boldface.
Oxytocin and estradiol secretion
Hormone levels are included in Table 1. Mean nocturnal oxytocin levels were lower in AA and EA compared with NA but comparable between AA and EA (Fig. 1). Mean midnight and 0700 h oxytocin levels did not differ between groups. There was no evidence of diurnal variation in oxytocin levels, as assessed by the difference between midnight and 0700 h samples, in any of the groups. Across groups, midnight and 0700 h oxytocin levels were highly correlated (r=0.88, P<0.0001). Associations between nocturnal oxytocin secretion and midnight (r=0.34, P=0.02) as well as 0700 h (r=0.25, P=0.095) oxytocin samples were less pronounced. Mean estradiol levels did not significantly differ between groups, likely because blood was drawn during the first 10 days of the menstrual cycle in EA and NA, when estradiol levels are low. There was an association between estradiol and nocturnal oxytocin levels (r=0.40, P=0.006). After controlling for serum estradiol levels, oxytocin differences between AA and NA remained significant (P=0.0001), and those between EA and NA became a trend (P=0.08).
Figure 1.
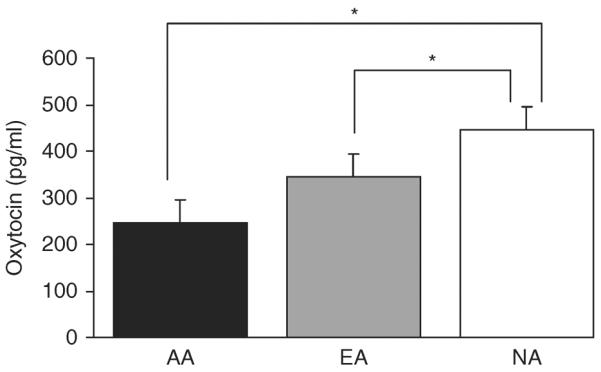
Oxytocin levels. Mean nocturnal oxytocin levels were lower in AA (black, 245±22 pg/ml) and EA (gray, 344±53 pg/ml) compared with NA (white, 446±40 pg/ml), but comparable between AA and EA. *P<0.04 compared with NA.
Bone microarchitecture and finite element analysis
Table 1 summarizes between-group differences in bone microarchitecture and finite element analysis. At the distal tibia, AA compared with NA had higher %trabecular area and trabecular separation and lower trabecular number, %cortical area, and total density. At the distal radius, AA had higher %trabecular area and lower trabecular density, %cortical area, and cortical thickness than NA. Finite element analysis demonstrated lower estimated stiffness and failure load at the ultradistal radius in AA compared with NA.
Relationship between oxytocin secretion and bone parameters
Amenorrheic athletes
Table 2 and Figs 2, 3, and 4 show relationships between nocturnal oxytocin secretion and bone parameters in AA. At the distal tibia, nocturnal oxytocin levels were positively associated with cortical density (r=0.57, P=0.03), whereas at the distal radius, nocturnal oxytocin levels were positively associated with trabecular thickness (r=0.52, P=0.049), %cortical area (r=0.64, P=0.01), cortical density (r=0.60, P=0.02), and cortical thickness (r=0.67, P=0.006) and negatively with %trabecular area (r=−0.62, P=0.01). At the distal radius, there was a trend toward a positive association of nocturnal oxytocin with stiffness (r=0.50, P=0.06) and failure load (r=0.47, P=0.08). Results were similar after controlling for age. When nocturnal oxytocin levels were entered into a stepwise regression model with known contributors to bone microarchitecture in young women, including bone age, age of menarche, and lean body mass (3), oxytocin accounted for a substantial portion of variability in microarchitecture, including, at the distal tibia, cortical density (25%), and at the distal radius, %trabecular area (38%), trabecular thickness (23%), %cortical area (39%), cortical density (31%), cortical thickness (42%), stiffness (47%), and failure load (44%).
Table 2.
Relationship between nocturnal oxytocin secretion and bone parameters.
| AA |
All subjects |
|||
|---|---|---|---|---|
| R | P | R | P | |
| Microarchitecture | ||||
| Distal tibia | ||||
| Trabecular area (% total area) | −0.40 | NS | −0.27 | 0.075 |
| Trabecular number (1/mm) | 0.07 | NS | 0.32 | 0.031 * |
| Trabecular separation (mm) | −0.08 | NS | − 0.30 | 0.043 * |
| Cortical area (% total area) | 0.42 | NS | 0.26 | 0.087 |
| Cortical density (mg HA/cm3) | 0.57 | 0.026 * | 0.25 | NS |
| Cortical thickness (mm) | 0.45 | 0.089 | 0.24 | NS |
| Stiffness (kN/m) | 0.27 | NS | −0.01 | NS |
| Failure load (kN) | 0.27 | NS | 0.01 | NS |
| Ultradistal radius | ||||
| Trabecular area (% total area) | − 0.62 | 0.013 * | −0.29 | 0.053* |
| Trabecular number (1/mm) | −0.51 | 0.052 | −0.03 | NS |
| Trabecular separation (mm) | 0.48 | 0.072 | 0.00 | NS |
| Cortical area (% total area) | 0.64 | 0.010 * | 0.30 | 0.043 * |
| Cortical density (mg HA/cm3) | 0.60 | 0.017 * | 0.26 | 0.085 |
| Cortical thickness (mm) | 0.67 | 0.006 * | 0.30 | 0.044 * |
| Stiffness (kN/m) | 0.50 | 0.060 | 0.33 | 0.028 * |
| Failure load (kN) | 0.47 | 0.081 | 0.31 | 0.037 * |
P<0.05 after controlling for age. Statistically significant values are in boldface.
Figure 2.

Relationship between oxytocin levels and cortical density in AA. Oxytocin levels were positively associated with cortical density at the (A) distal tibia and (B) distal radius. The x-axis indicates the natural log of oxytocin.
Figure 3.

Relationship between oxytocin levels and trabecular and cortical thickness in AA. At the distal radius, oxytocin levels were positively associated with (A) trabecular thickness and (B) cortical thickness. The x-axis indicates the natural log of oxytocin.
Figure 4.

Relationship between oxytocin levels and percent cortical and trabecular area in AA. At the distal radius, oxytocin levels were positively associated with (A) %cortical area and negatively associated with (B) %trabecular area. The x-axis indicates the natural log of oxytocin.
Midnight oxytocin levels were positively correlated with stiffness and failure load at the radius (r=0.61, P=0.02; r=0.60, P=0.02), and 0700 h oxytocin levels were associated with stiffness and failure load at the tibia (r=0.53, P=0.04 and r=0.58, P=0.02 respectively) and radius (r=0.66, P=0.007 and r=0.65, P=0.008 respectively) in AA, independent of age. When midnight oxytocin levels were entered into a stepwise regression model with bone age, age of menarche, and lean body mass, oxytocin accounted for variability in stiffness (40%) and failure load (40%) at the radius. When 0700 h oxytocin levels were substituted for midnight oxytocin in this model, oxytocin accounted for variability in stiffness and failure load at the radius (42 and 40% respectively) and tibia (33 and 39% respectively).
EA and NA
Other than a positive correlation between midnight oxytocin and cortical perimeter at the radius (r=0.59, P=0.02), there were no significant correlations between oxytocin levels and bone parameters at either site in EA. When midnight oxytocin levels were entered into a stepwise regression model with bone age, age of menarche, and lean body mass, oxytocin did not account for a significant portion of variability in cortical perimeter at the radius in EA.
In NA, nocturnal oxytocin secretion was positively associated with trabecular number (r=0.55, P=0.03) and negatively with trabecular separation (r=−0.53, P=0.04) at the distal tibia only. These relationships remained significant after controlling for age. There were no significant relationships between midnight or 0700 h oxytocin levels and bone parameters in NA. When nocturnal oxytocin levels were entered into a stepwise regression model with bone age, age of menarche, and lean body mass in NA, oxytocin accounted for 30% of the variability in trabecular number and 28% of variability in trabecular separation at the distal tibia.
All subjects
Table 2 presents correlations between nocturnal oxytocin secretion and bone parameters. In all subjects, at the distal tibia, nocturnal oxytocin secretion was positively associated with trabecular number (r=0.32, P=0.03) and negatively with trabecular separation (r=−0.30, P=0.04). At the distal radius, nocturnal oxytocin was associated with %cortical area (r=0.30, P=0.04) and cortical thickness (r=0.30, P=0.04). There were positive correlations between nocturnal oxytocin secretion and estimated stiffness (r=0.33, P=0.03) and failure load (r=0.31, P=0.04) at the distal radius. Results were similar after controlling for age. When nocturnal oxytocin levels were entered into a stepwise regression model with bone age, age of menarche, and lean body mass, oxytocin accounted for 11% of the variability in trabecular number and 6% of variability in trabecular separation at the distal tibia.
Midnight oxytocin levels were positively associated with cortical perimeter (P=0.31, r=0.04), stiffness (r=0.36, P=0.02), and failure load (r=0.37, P=0.01) at the radius. When midnight oxytocin levels were entered into a stepwise regression model with bone age, age of menarche, and lean body mass, oxytocin did not account for variability in cortical perimeter, stiffness, or failure load at the radius. 0700 h oxytocin levels were associated with stiffness (r=0.34, P=0.02) and failure load (r=0.35, P=0.02) at the radius. When 0700 h oxytocin levels were entered into a stepwise regression model with bone age, age of menarche, and lean body mass, oxytocin did not account for variability in stiffness or failure load at the radius.
Discussion
We report low nocturnal secretion of the bone anabolic hormone, oxytocin, in AA, associated with impaired bone microarchitecture. This relationship involves both trabecular and cortical bone parameters and is most pronounced at the non-weight-bearing radius, a site where the beneficial effects of weight-bearing exercise are absent. In stepwise regression models that included known contributors to bone microarchitecture in young women (3), including bone age, age of menarche, and lean body mass, oxytocin accounted for a substantial portion of variability in bone microarchitecture and strength parameters. These data suggest that in the setting of estrogen deficiency, low oxytocin secretion may contribute to severity of bone loss and decreased structural integrity of bone in athletes.
There are few available data on oxytocin secretion in athletes, and studies to date have investigated only the acute response in oxytocin secretion to an exercise challenge, with discrepant results (6, 7, 8, 9). Altemus et al. (6) reported no change in oxytocin secretion following treadmill testing to exhaustion in 20 young post partum women of varying physical conditioning whether or not they were lactating. A study of 82 male and female ultramarathon runners showed a significant increase in oxytocin levels after a 56 km race compared with levels measured within the hour before the start of the race (7). In a subset of seven runners, although an increase in oxytocin levels following the ultramarathon was evident, there was no significant change in oxytocin levels following high-intensity or steady-state (60% of peak capacity) treadmill exercise (8). Only one study has compared oxytocin levels in athletes to NA, and females were not investigated. In this study of 12 professional male cyclists and ten sedentary controls, oxytocin levels did not increase after exercising to exhaustion on a cycle ergometer in either group. However, oxytocin levels before, during, and after exercise were lower in the athletes compared with the nonathletic men (9).
To our knowledge, ours is the first study to examine endogenous oxytocin secretion in female athletes compared with nonathletic controls. Furthermore, this is the only investigation to date looking at an integrated measure of unstimulated oxytocin secretion in athletes. In amenorrheic and EA, we found that nocturnal oxytocin secretion was decreased compared with healthy NA. Importantly, the difference in oxytocin secretion between AA and NA was independent of estradiol levels. In contrast, the difference in oxytocin secretion in EA compared with NA was no longer significant after controlling for estradiol. This study suggests that athletic young women in general may have decreased nocturnal oxytocin secretion compared with NA; however, as estradiol stimulates oxytocin secretion, it is possible that slight differences in menstrual phase contribute to the lower oxytocin levels seen in the EA. Therefore, further investigation will be important to determine whether oxytocin secretion is altered in EA, or just those with amenorrhea. Whether there is a diurnal variation of oxytocin in women has not been clearly established. We did not find evidence of diurnal variation in oxytocin secretion, consistent with prior findings in two small studies of healthy individuals (22, 23).
There is a growing body of literature indicating that oxytocin is beneficial to bone. Oxytocin receptors are present on human osteoblasts and osteoclasts (1, 24, 25). Oxytocin promotes differentiation of bone marrow cells from adipocyte to osteoblast lineage and stimulates proliferation of osteoblasts and preosteoclasts in culture (2, 24). Oxytocin and oxytocin receptor knockout mice have severe osteoporosis (1, 2). Peripheral oxytocin administration to animal models of osteoporosis, including oxytocin knockouts and ovariectomized mice, increases osteoblastic bone formation and improves microarchitecture (1, 2). Recent studies have shown that osteoblasts can produce oxytocin, regulated positively by estradiol or negatively through adrenergic input (26, 27). There are few studies reporting oxytocin secretion in relation to bone loss in humans. In postmenopausal women, one group found lower fasting morning oxytocin levels in those with osteoporosis compared with those without, and a positive association between oxytocin levels and bone mineral density independent of estradiol (2, 28). We have previously reported an association between low levels of nocturnal oxytocin and severity of bone loss at the spine as measured by DXA in young women with anorexia nervosa (29). Consistent with these data, we now report robust associations between low levels of oxytocin and impaired bone microarchitecture as well as strength parameters in young normal-weight amenorrheic but not EA. The relationship between oxytocin secretion and bone microarchitecture is most pronounced at the non-weight-bearing radius, where the protective effect of exercise does not play a role. These data support the concept that in the setting of oxytocin deficiency and amenorrhea, the beneficial effects of weight-bearing exercise are diminished.
Limitations of our study include its cross-sectional nature; therefore, causality cannot be established. In addition, our sample size is relatively small, and it will be important to confirm these findings in a larger population. However, despite the small sample size, our findings are consistent and robust. A stricter definition of amenorrhea (e.g. lack of menstruation for at least six consecutive months) and/or inclusion of heavier healthy controls (mean BMI was only 21.6) may have resulted in even greater differences in oxytocin levels and bone microarchitecture. Furthermore, it is possible that oxytocin secretion later in the menstrual cycle, when estradiol levels are higher, is more tightly linked to bone parameters in cycling women. More precise measures of estradiol secretion in EA may be necessary to define the estradiol/oxytocin relationship in that group. Other measures of oxytocin dynamics, for example, assessment of pulsatile secretory patterns using cluster and deconvolutional analyses, may reveal additional differences. Bone parameters are similar but not identical to previously published data due to differences in subject selection based on availability of blood samples for hormone analysis.
In summary, nocturnal secretion of the anabolic hormone oxytocin is decreased in AA compared with NA. In these women, low nocturnal oxytocin levels are associated with impaired cortical and trabecular microarchitecture. This relationship is not present in EA and is strongest at the non-weight-bearing distal radius, a site where the positive effects of exercise on bone are not evident. In stepwise regression models that include known predictors of bone microarchitecture in AA, nocturnal oxytocin accounts for a significant portion of variability in microarchitectural parameters and, along with midnight and 0700 h oxytocin, measures of bone strength. These data are consistent with the hypothesis that oxytocin deficiency in AA may contribute to impaired bone microstructure and strength. Further studies will be important in establishing whether oxytocin agonists alone or in combination with estrogen replacement can prevent or treat bone loss in this population.
Acknowledgments
Funding NIH Grants UL1 RR025758, RO1 HD060827, and K23 MH092560; Massachusetts General Hospital Claflin Distinguished Scholar Award.
Footnotes
Declaration of interest The authors declare that there is no conflict of interest that could be perceived as prejudicing the impartiality of the research reported.
References
- 1.Tamma R, Colaianni G, Zhu LL, DiBenedetto A, Greco G, Montemurro G, Patano N, Strippoli M, Vergari R, Mancini L, et al. Oxytocin is an anabolic bone hormone. PNAS. 2009;106:7149–7154. doi: 10.1073/pnas.0901890106. doi:10.1073/pnas.0901890106. [DOI] [PMC free article] [PubMed] [Google Scholar]
- 2.Elabd C, Basillais A, Beaupied H, Breuil V, Wagner N, Scheideler M, Zaragosi LE, Massiera F, Lemichez E, Trajanoski Z, et al. Oxytocin controls differentiation of human mesenchymal stem cells and reverses osteoporosis. Stem Cells. 2008;26:2399–2407. doi: 10.1634/stemcells.2008-0127. doi:10.1634/stemcells.2008-0127. [DOI] [PubMed] [Google Scholar]
- 3.Ackerman KE, Nazem T, Chapko D, Russell M, Mendes N, Taylor AP, Bouxsein ML, Misra M. Bone microarchitecture is impaired in adolescent amenorrheic athletes compared with eumenorrheic athletes and nonathletic controls. Journal of Clinical Endocrinology and Metabolism. 2011;96:3123–3133. doi: 10.1210/jc.2011-1614. doi:10.1210/jc.2011-1614. [DOI] [PMC free article] [PubMed] [Google Scholar]
- 4.Warren MP, Brooks-Gunn J, Fox RP, Holderness CC, Hyle EP, Hamilton WG. Osteopenia in exercise-associated amenorrhea using ballet dancers as a model: a longitudinal study. Journal of Clinical Endocrinology and Metabolism. 2002;87:3162–3168. doi: 10.1210/jcem.87.7.8637. doi:10.1210/jc.87.7.3162. [DOI] [PubMed] [Google Scholar]
- 5.Ackerman K, Putman M, Guereca G, Taylor A, Pierce L, Herzog D, Klibanski A, Bouxsein M, Misra M. Cortical microstructure and estimated bone strength in young amenorrheic athletes, eumenorrheic athletes and non-athletes. Bone. 2012;51:680–687. doi: 10.1016/j.bone.2012.07.019. doi:10.1016/j.bone.2012.07.019. [DOI] [PMC free article] [PubMed] [Google Scholar]
- 6.Altemus M, Deuster PA, Galliven E, Carter CS, Gold PW. Suppression of hypothalamic–pituitary–adrenal axis responses to stress in lactating women. Journal of Clinical Endocrinology and Metabolism. 1995;80:2954–2959. doi: 10.1210/jcem.80.10.7559880. doi:10.1210/jc.80.10.2954. [DOI] [PubMed] [Google Scholar]
- 7.Hew-Butler T, Jordaan E, Stuempfle KJ, Speedy DB, Siegel AJ, Noakes TD, Soldin SJ, Verbalis JG. Osmotic and nonosmotic regulation of arginine vasopressin during prolonged endurance exercise. Journal of Clinical Endocrinology and Metabolism. 2008;93:2072–2078. doi: 10.1210/jc.2007-2336. doi:10.1210/jc.2007-2336. [DOI] [PMC free article] [PubMed] [Google Scholar]
- 8.Hew-Butler T, Noakes TD, Soldin SJ, Verbalis JG. Acute changes in endocrine and fluid balance markers during high-intensity, steady-state, and prolonged endurance running: unexpected increases in oxytocin and brain natriuretic peptide during exercise. European Journal of Endocrinology. 2008;159:729–737. doi: 10.1530/EJE-08-0064. doi:10.1530/EJE-08-0064. [DOI] [PubMed] [Google Scholar]
- 9.Chicharro JL, Hoyos J, Bandres F, Gomez Gallego F, Perez M, Lucia A. Plasma oxytocin during intense exercise in professional cyclists. Hormone Research. 2001;55:155–159. doi: 10.1159/000049988. doi:10.1159/000049988. [DOI] [PubMed] [Google Scholar]
- 10.Greulich W, Pyle S. 1959 Radiographic atlas of skeletal development of the hand and wrist. 2nd edn. Stanford University Press; Stanford: [Google Scholar]
- 11.Boutroy S, Bouxsein ML, Munoz F, Delmas PD. In vivo assessment of trabecular bone microarchitecture by high-resolution peripheral quantitative computed tomography. Journal of Clinical Endocrinology and Metabolism. 2005;90:6508–6515. doi: 10.1210/jc.2005-1258. doi:10.1210/jc.2005-1258. [DOI] [PubMed] [Google Scholar]
- 12.Nishiyama KK, Macdonald HM, Buie HR, Hanley DA, Boyd SK. Postmenopausal women with osteopenia have higher cortical porosity and thinner cortices at the distal radius and tibia than women with normal aBMD: an in vivo HR-pQCT study. Journal of Bone and Mineral Research. 2010;25:882–890. doi: 10.1359/jbmr.091020. doi:10.1359/jbmr.091020. [DOI] [PubMed] [Google Scholar]
- 13.Burghardt AJ, Kazakia GJ, Ramachandran S, Link TM, Majumdar S. Age- and gender-related differences in the geometric properties and biomechanical significance of intracortical porosity in the distal radius and tibia. Journal of Bone and Mineral Research. 2009;25:983–993. doi: 10.1359/jbmr.091104. doi:10.1359/jbmr.091104. [DOI] [PMC free article] [PubMed] [Google Scholar]
- 14.Macneil JA, Boyd SK. Bone strength at the distal radius can be estimated from high-resolution peripheral quantitative computed tomography and the finite element method. Bone. 2008;42:1203–1213. doi: 10.1016/j.bone.2008.01.017. doi:10.1016/j.bone.2008.01.017. [DOI] [PubMed] [Google Scholar]
- 15.Pistoia W, van Rietbergen B, Lochmuller EM, Lill CA, Eckstein F, Ruegsegger P. Estimation of distal radius failure load with micro-finite element analysis models based on three-dimensional peripheral quantitative computed tomography images. Bone. 2002;30:842–848. doi: 10.1016/s8756-3282(02)00736-6. doi:10.1016/S8756-3282(02)00736-6. [DOI] [PubMed] [Google Scholar]
- 16.Hoge EA, Lawson EA, Metcalf CA, Keshaviah A, Zak PJ, Pollack MH, Simon NM. Plasma oxytocin immunoreactive products and response to trust in patients with social anxiety disorder. Depression and Anxiety. 2012;29:924–930. doi: 10.1002/da.21973. doi:10.1002/da.21973. [DOI] [PMC free article] [PubMed] [Google Scholar]
- 17.Rubin LH, Carter CS, Drogos L, Pournajafi-Nazarloo H, Sweeney JA, Maki PM. Peripheral oxytocin is associated with reduced symptom severity in schizophrenia. Schizophrenia Research. 2010;124:13–21. doi: 10.1016/j.schres.2010.09.014. doi:10.1016/j.schres.2010.09.014. [DOI] [PMC free article] [PubMed] [Google Scholar]
- 18.Sue Carter C, Pournajafi-Nazarloo H, Kramer KM, Ziegler TE, White-Traut R, Bello D, Schwertz D. Oxytocin. Annals of the New York Academy of Sciences. 2007;1098:312–322. doi: 10.1196/annals.1384.006. doi:10.1196/annals.1384.006. [DOI] [PubMed] [Google Scholar]
- 19.Feldman R, Zagoory-Sharon O, Weisman O, Schneiderman I, Gordon I, Maoz R, Shalev I, Ebstein RP. Sensitive parenting is associated with plasma oxytocin and polymorphisms in the OXTR and CD38 genes. Biological Psychiatry. 2012;72:175–181. doi: 10.1016/j.biopsych.2011.12.025. doi:10.1016/j.biopsych.2011.12.025. [DOI] [PubMed] [Google Scholar]
- 20.Kramer KM, Cushing BS, Carter CS, Julie W, Ottinger MA. Sex and species differences in plasma oxytocin using an enzyme immunoassay. Canadian Journal of Zoology. 2004;82:1194–1200. doi:10.1139/z04-098. [Google Scholar]
- 21.Weisman O, Zagoory-Sharon O, Schneiderman I, Gordon I, Feldman R. Plasma oxytocin distributions in a large cohort of women and men and their gender-specific associations with anxiety. Psychoneuroendocrinology. 2013 doi: 10.1016/j.psyneuen.2012.08.011. In Press. [DOI] [PubMed] [Google Scholar]
- 22.Amico JA, Tenicela R, Johnston J, Robinson AG. A time-dependent peak of oxytocin exists in cerebrospinal fluid but not in plasma of humans. Journal of Clinical Endocrinology and Metabolism. 1983;57:947–951. doi: 10.1210/jcem-57-5-947. doi:10.1210/jcem-57-5-947. [DOI] [PubMed] [Google Scholar]
- 23.Kostoglou-Athanassiou I, Athanassiou P, Treacher DF, Wheeler MJ, Forsling ML. Neurohypophysial hormone and melatonin secretion over the natural and suppressed menstrual cycle in premenopausal women. Clinical Endocrinology. 1998;49:209–216. doi: 10.1046/j.1365-2265.1998.00504.x. doi:10.1046/j.1365-2265.1998.00504.x. [DOI] [PubMed] [Google Scholar]
- 24.Colucci S, Colaianni G, Mori G, Grano M, Zallone A. Human osteoclasts express oxytocin receptor. Biochemical and Biophysical Research Communications. 2002;297:442–445. doi: 10.1016/s0006-291x(02)02009-0. doi:10.1016/S0006-291X(02)02009-0. [DOI] [PubMed] [Google Scholar]
- 25.Copland JA, Ives KL, Simmons DJ, Soloff MS. Functional oxytocin receptors discovered in human osteoblasts. Endocrinology. 1999;140:4371–4374. doi: 10.1210/endo.140.9.7130. doi:10.1210/en.140.9.4371. [DOI] [PubMed] [Google Scholar]
- 26.Colaianni G, Di Benedetto A, Zhu LL, Tamma R, Li J, Greco G, Peng Y, Dell'Endice S, Zhu G, Cuscito C, et al. Regulated production of the pituitary hormone oxytocin from murine and human osteoblasts. Biochemical and Biophysical Research Communications. 2011;411:512–515. doi: 10.1016/j.bbrc.2011.06.158. doi:10.1016/j.bbrc.2011.06.158. [DOI] [PubMed] [Google Scholar]
- 27.Cuscito C, Colaianni G, Tamma R, Greco G, Dell'Endice S, Yuen T, Sun L, Zaidi M, Di Benedetto A, Zallone A. Adrenergic stimulation decreases osteoblast oxytocin synthesis. Annals of the New York Academy of Sciences. 2011;1237:53–57. doi: 10.1111/j.1749-6632.2011.06235.x. doi:10.1111/j.1749-6632.2011.06235.x. [DOI] [PubMed] [Google Scholar]
- 28.Breuil V, Amri EZ, Panaia-Ferrari P, Testa J, Elabd C, Albert-Sabonnadiere C, Roux CH, Ailhaud G, Dani C, Carle GF, et al. Oxytocin and bone remodelling: relationships with neuropituitary hormones, bone status and body composition. Joint, Bone, Spine. 2011;78:611–615. doi: 10.1016/j.jbspin.2011.02.002. doi:10.1016/j.jbspin.2011.02.002. [DOI] [PubMed] [Google Scholar]
- 29.Lawson E, Donoho D, Blum J, Meenaghan E, Misra M, Herzog D, Sluss P, Miller K, Klibanski A. Decreased nocturnal oxytocin levels in anorexia nervosa are associated with low bone mineral density and fat mass. Journal of Clinical Psychiatry. 2011;72:1546–1551. doi: 10.4088/JCP.10m06617. doi:10.4088/JCP.10m06617. [DOI] [PMC free article] [PubMed] [Google Scholar]