

Abstract
San Diego County, California, is a major distribution center for methamphetamine entering the U.S. from Mexico. All available indicators suggest that the use and abuse of methamphetamine increased between 2001 and 2005. Drug treatment admissions for primary methamphetamine use accounted for 49% of all drug treatment admissions in 2005, up from 37% in 2001, with trends showing smaller proportions of female and Hispanic users and a larger proportion of methamphetamine smokers (vs. inhalation or injection). Increases in prevalence of methamphetamine use were documented among arrestees as well; by 2005, 51% of female and 21% of juvenile arrestees tested positive for methamphetamine The proportion of emergency department visits involving illicit drugs in which methamphetamine was reported increased from 32% in 2004 to 40% in 2005, although this change was not statistically significant, and methamphetamine-related deaths increased 48% between 2001 and 2005. Data from non-federal drug seizures in San Diego County documented an increase from 21 % of all drug items analyzed in 2001 to 32% in 2005 In summary, methamphetamine remains the drug of utmost concern in San Diego. The availability of multiple data sources is imperative for constructing valid characterizations of trends in methamphetamine use and abuse and its affect on health.
Keywords: drug treatment, epidemiology, indicators, methamphetamine, San Diego
Surveillance of methamphetamine use and abuse in San Diego County, California, is conducted using data provided by a variety of federal, state and local agencies. These data are collected and analyzed semi-annually to contribute to the surveillance efforts of the National Institute on Drug Abuse’s Community Epidemiology Work Group (CEWG). Established in 1976, CEWG regularly convenes researchers from major U.S. metropolitan areas, selected states and border countries to discuss the epidemiology of drug abuse and identify emerging trends. More information on the CEWG process and membership, along with recent reports, can be accessed at www.drugabuse.gov/about/organization/CEWG/CEWGHome.html.
Data sources used in this summary include: drug traffcking data from the U.S. Drug Enforcement Agency; drug treatment admissions data from the California Department of Alcohol and Drug Programs: data on drug-related emergency department visits from the Substance Abuse and Mental Health Services Administration’s Drug Abuse Warning Network; arrestee drug monitoring data from the San Diego Association of Governments’ Substance Abuse Monitoring Program; data on drug-related deaths from the Office of the San Diego County Medical Examiner; and forensic lab data from the Drug Enforcement Administration’s National Forensic Laboratory Information System. All of these sources suggest that methamphetamine abuse and its associated harms rose substantially in San Diego between 2001 and 2005. This article provides an overview of trends in methamphetamine use and its associated impacts in San Diego County.
SAN DIEGO COUNTY DEMOGRAPHICS
San Diego County is located is the southwestern corner of California and shares 80 miles of border with Mexico. The county’s population is increasingly ethnically diverse: in 2005, 52% of 2.9 million San Diego residents were White, 30% Hispanic, 11% Asian/Pacific Islander and 6% African American; compared to a distribution of 55%, 27%, 11% and 7%, respectively, in 2001 (U.S. Census Bureau 2007a). The median age of county residents in 2005 was 34 years and median household income increased from $47,067 in 2000 to $56,335 in 2005 (U.S. Census Bureau 2007b).
METHAMPHETAMINE TRAFFICKING IN SAN DIEGO COUNTY
Prior to 1989, San Diego was home to numerous methamphetamine labs and once led the U.S. in methamphetamine production (National Drug Intelligence Center 2006a); however, increased U.S. law enforcement efforts and implementation of the Chemical Diversion and Traffcking Act of 1988, the Chemical Diversion Control Act of 1993 and the Combat Meth Act of 2005 reduced access to precursor chemicals used to make methamphetamine and led to a substantial decline in domestic methamphetamine production. Pursuant to these changes, the number of meth “incidents” in San Diego (including seizures of labs, dump-sites and chemical and glassware) dropped from 39 in 2000 to 18 in 2005. Table 1 provides a descriptive breakdown of these sites. The reduction in meth incidents across California was even more substantial, dropping from 2,579 in 1999 to 470 in 2005 (USDEA 2007).
TABLE 1.
Clandestine Methamphetamine Lab-Related Incidents in San Diego County, 2000–2005
| Year | Chemicals/Glass/Equipment | Dumpsite | Laboratory | Total |
|---|---|---|---|---|
| 2000 | 1 | 8 | 30 | 39 |
| 2001 | 2 | 0 | 17 | 19 |
| 2002 | 21 | 1 | 20 | 42 |
| 2003 | 25 | 0 | 14 | 39 |
| 2004 | 12 | 0 | 18 | 30 |
| 2005 | 5 | 0 | 13 | 18 |
Source: EPIC National Clandestine Laboratory Seizure System
However, the downturn in domestic methamphetamine production did not result in a significant or prolonged reduction in methamphetamine use in San Diego, as Mexican drug trafficking organizations quickly stepped in to fill the production void. Today, most of the methamphetamine available in San Diego County is produced in Mexico (Brouwer et al. 2006; National Drug Intelligence Center 2006a). San Diego’s proximity to Mexico also makes it the southernmost point on the U.S. West Coast drug transportation corridor and, as such, the county serves as an important national distribution center for methamphetamine and other drugs entering the U.S. from Mexico and Central and South America. The San Ysidro border crossing, which separates San Diego from Tijuana, Mexico, accommodates more than 40 million legal border crossings annually and is the busiest border crossing in the world (Bureau of Transportation Statistics 2007). According to the National Drug Intelligence Center b), from 2001 through 2003 more methamphetamine was seized at San Diego’s San Ysidro port of entry (845 kg) than at any other U.S. port of entry. In 2005, 801.3 kg of methamphetamine were seized in San Diego and neighboring Imperial County, up from 431 kg in 2004.
Perhaps because of its proximity to Mexico, San Diego also has some of the lowest priced methamphetamine in the United States. Street drug prices were just $20 per quarter gram and $40to $50 per gram in 2005, with purity of 50% to 95% (San Diego and Imperial County Regional Narcotic Information Network 2005). Prices per pound were estimated at $4,000 to $10,000 in 2004 (San Diego and Imperial County Regional Narcotic Information Network 2007), $3,500 to $8,500 in 2005 (San Diego and Imperial County Regional Narcotic Information Network 2005) and $5,000 to $ 10,000 in 2006 (San Diego and Imperial County Regional Narcotic Information Network 2006).
DRUG TREATMENT ADMISSIONS
The California Department of Alcohol and Drug Programs requires reporting of all publicly-funded treatment admissions in the state, including admissions for methamphetamine use and abuse in San Diego County. These data do not include services purchased with private insurance or other nonpublic funding sources. Publicly-funded treatment services in San Diego are purchased entirely with funds from state and, to a lesser extent, federal sources.
Methamphetamine is the most commonly reported primary drug of abuse among drug users entering treatment in San Diego County, and the proportion of admissions attributed to the drug has risen steadily over time. In 2001, 37% of admissions (excluding primary alcohol admissions) were for primary methamphetamine use and 31%, 20% and 10% of admissions were attributed to primary heroin, marijuana and cocaine use, respectively. By 2005, primary methamphetamine use accounted for 49% of drug treatment admissions, followed by heroin (24%), marijuana (15%) and cocaine (8%).
The demographic characteristics of primary methamphetamine users admitted to drug treatment in 2005 suggest that they are a somewhat distinct population compared to users of other drugs. Forty percent of admissions were among women, compared to 34% of cocaine admissions, 28% of heroin admissions and 27% of marijuana admissions. The age distribution of methamphetamine users was younger than for any other drug except marijuana, with 58% of admissions attributed to persons Jess than 35 years old. In addition, as is the case in most U.S. metro areas, methamphetamine users admitted to treatment in 2005 were predominantly non-Hispanic Whites (53%), followed by Hispanics (30%), Asian/Pacific Islanders (7%) and African Americans (6%). Most persons admitted to treatment reported that their primary mode of administration was smoking (71 %), followed by inhalation (14%) and injection (14%).
Table 2 compares the characteristics of primary methamphetamine admissions in 2005 to those in 2001, demonstrating notable differences in sex, race/ethnicity, and mode of administration over time. The proportion of primary methamphetamine admissions attributed to women decreased, as did the proportion of White non-Hispanics. Concurrently, the proportion of Hispanics admitted to treatment increased, and there appears to be a shift away from inhalation and injection as the primary mode of administration.
TABLE 2.
Demographic Characteristics of Primary Methamphetamine Admissions in San Diego County, 2001 & 2005
| Percent of Methamphetamine Admissions 2001 (N = 5946) | Percent of Methamphetamine Admissions 2005 (N = 5211) | |
|---|---|---|
| Sex | ||
| Male | 54 | 60 |
| Female | 46 | 40 |
| Age | ||
| ≤17 | 5 | 4 |
| 18–25 | 21 | 24 |
| 26–34 | 34 | 30 |
| ≥35 | 40 | 42 |
| Race/ethnicity | ||
| White, non-Hispanic | 60 | 53 |
| Hispanic | 25 | 30 |
| Asian/Pacific Islander | 6 | 7 |
| African American | 5 | 6 |
| American Indian | 2 | 2 |
| Primary route of administration | ||
| Smoke | 63 | 71 |
| Inhale | 18 | 14 |
| Inject | 18 | 14 |
| Oral | 2 | 1 |
Source: California Alcohol and Drug Data System
In addition to admissions for primary methamphetamine abuse, some admissions also cite it as a secondary or tertiary drug of abuse. In 2001, 1,892 (27%) of admissions reporting a secondary drug and 536 (22%) of those reporting a tertiary drug cited methamphetamine. In 2005, 1,510 (28%) of those reporting a secondary drug and 405 (18%) of those listing a tertiary drug cited methamphetamine, suggesting that there has been little overall change in the role of methamphetamine as a nonprimary drug of abuse.
It should be noted that the period 2001 to 2005 encompassed the initiation of the Substance Abuse and Crime Prevention Act of 2000 (Proposition 36, a “treatment instead of incarceration” initiative), which was instituted in California beginning July 1,2001. Under Proposition 36, nonviolent offenders convicted solely of possessing illicit drugs or paraphernalia are offered drug treatment and probation instead of incarceration. In its first four years, Proposition 36 redirected more than 140,000 individuals with a possession conviction to treatment. More than 10,000 were assigned to drug treatment in San Diego County using state-allocated Proposition 36 funding (Drug Policy Alliance 2006).
Interestingly, as shown in Figure 1, although Proposition 36 redirected a large number of offenders to treatment who would have otherwise been incarcerated, the overall number of admissions for methamphetamine and other major drugs of abuse decreased between 2001 and 2005. There were 16,243 drug treatment admissions (excluding primary alcohol admissions) in San Diego in 2001; by 2005, the total number of admissions had fallen to 10,543 (a 35% decrease). The corresponding reduction in numbers of admissions per primary drug of abuse was 12% for methamphetamine, 50% for heroin, 45% for cocaine and 50% for marijuana. Only admissions for “other opiates” (e.g., hydrocodone, oxycodone) increased during the time period (29%).
FIGURE 1.

Drug Treatment Admissions in San Diego County, 2001–2005
Source: California Alcohol and Drug Data System
While the reasons underlying these reductions are likely multifactorial in nature, it should be noted that both the amount of money budgeted and spent by San Diego County for drug treatment decreased between 2002 and 2005 despite the addition of Proposition 36 funding. Budgeted funds decreased from $54.7 million in FY 2002–2003 to $49.4 million in FY 2005–06, and funds spent went from $45.3 million to $42.1 million over the same period (Henry 2007). It is not clear whether or how these changes in expenditures affected treatment capacity or what other factors contributed to this overall reduction in treatment admissions. There are, however, no clear indications that reductions in drug use in San Diego are responsible for the reduction in treatment admissions.
ARRESTEE MONITORING
Biannually, the San Diego Association of Governments’ (SANDAG) Substance Abuse Monitoring (SAM) system collects data on drug use from a sample of adult and juvenile arrestees at San Diego detention facilities (see article by C. Burke in this issue for more information). Arrestees are approached within 48 hours of their arrest and booking into jail. Those who agree to participate in the study complete an interviewer administered survey and provide a urine sample for drug testing. The refusal rate for participation is generally low, ranging from 14% to 20% among adults and 2% to 4% among juveniles (Burke 2007).
Urinalysis results suggest that methamphetamine use among arrestees in San Diego increased substantially between 2001 and 2005 (Table 3). Most notably, more than half (51%) of female arrestees tested positive for methamphetamine in 2005, up from 37% in 2001. Prevalence of methamphetamine among juvenile arrestees also increased substantially between 2001 and 2005, from 11% to 21%. This increase in prevalence among juveniles is of particular concern as it may be an indicator or harbinger of increased methamphetamine use among San Diego youth in general.
TABLE 3.
Percentage of Arrestees Testing Positive for Methamphetamine in San Diego County, 2001–2005
| 2001 (N = 1041) | 2002 (N = 1100) | 2003 (N = 993) | 2004 (N = 804) | 2005 (N = 772) | % Change | |
|---|---|---|---|---|---|---|
| Male | 32 | 34 | 38 | 43 | 44 | 38 |
| Female | 37 | 37 | 47 | 42 | 51 | 38 |
| (N = 304) | (N = 354) | (N = 344) | (N = 175) | (N = 165) | ||
| Juvenile | 11 | 12 | 15 | 13 | 21 | 91 |
Source: San Diego Association of Governments Substance Abuse Monitoring System
EMERGENCY DEPARTMENT REPORTS
Data on drug-related emergency department (ED) visits in San Diego County were obtained from the Substance Abuse and Mental Health Services Administration’s (SAMHSA) Drug Abuse Warning Network (DAWN), which currently monitors ED visits in 13 U.S. metropolitan areas. A full explanation of the DAWN system reporting and the appropriate uses and limitations of the DAWN data are available at http://dawninfo.samhsa.gov. Seventeen hospitals in San Diego County meet the criteria for DAWN reporting. Although the number of these hospitals reporting and the completeness of the data reported vary by month, the estimates provided have been adjusted to account for sampling probabilities and nonresponse and thus can be considered generalizable to San Diego County overall. Figure 2 presents the proportion of visits involving each illicit drug as a percentage of illicit drugs visits reported from participating hospitals annually. Although the proportion of visits involving methamphetamine increased from 32% in 2004 to 40% in 2005, this increase did not achieve statistical significance (p = 0.31).
FIGURE 2.
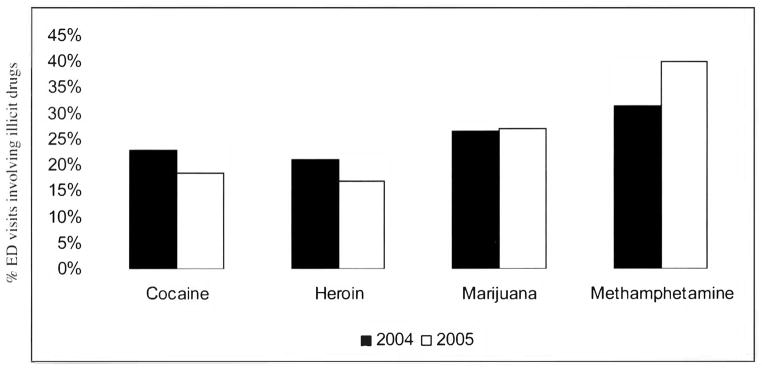
Percent of ED Visits Involving Illicit Drugs that Involved Cocaine, Heroin, Marijuana and/or Methamphetamine, San Diego Metro Area, 2004–2005
Source: OAS, SAMHSA, updated May 1, 2007
Although trends cannot be determined from the two years of available DAWN data, it is notable that the data presented in Figure 2 are broadly consistent with trends in San Diego’s drug treatment admissions data, i.e., an increase (albeit statistically insignificant) in the proportion of methamphetamine reports with concurrent decreases in heroin and cocaine.
MEDICAL EXAMINER DATA
The San Diego County Medical Examiner investigates all non-natural deaths in San Diego, including performing toxicology tests for methamphetamine and other drug of abuse. In 2005, there were 245 deaths involving methamphetamine, a 48% increase over 2001 (Figure 3). Of these 245 deaths, 44 were attributed to overdose involving either methamphetamine alone (n = 13) or in combination with other drugs (n = 31), most commonly heroin/morphine. An additional 64 deaths listed methamphetamine use as a contributing factor. For the remaining deaths, methamphetamine was detected during autopsy but was not listed as causal or contributing factor. The distribution of total methamphetamine-related deaths in 2005 was similar to the overall demographics of the county and of primary methamphetamine drug treatment admissions with regard to race: 57% were White, 30% Hispanic and 7% Black.
FIGURE 3.
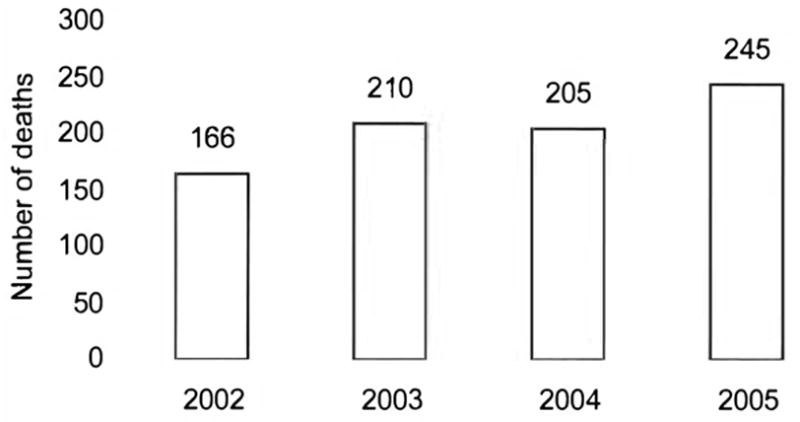
Deaths Involving Methamphetamine, San Diego County, 2002–2005
Source: San Diego County Medical Examiner
NATIONAL FORENSIC LABORATORY INFORMATION SYSTEM (NFLIS)
The NFLIS is a system sponsored by the U.S. Drug Enforcement Administration that systematically collects data from analyses conducted by state and local forensic laboratories on drugs seized during the course of nonfederal law enforcement activities. The proportion of drug items analyzed identified as methamphetamine has increased steadily in San Diego, rising from 21% in 2001 to 32% in 2005. Concurrently, marijuana items have decreased (from a high of 52% in 2002 and 2003 to 44% in 2005) and cocaine and heroin items have remained relatively constant (Figure 4).
FIGURE 4.

Percentage of All Items Tested by National Forensic Laboratory Information System (NFLIS), San Diego County, 2001–2005
Source: NFLIS, DEA
SUMMARY
Despite vigorous legislative and enforcement efforts to reduce trafficking of methamphetamine and its precursors, San Diego County continues to serve as a major distribution center for methamphetamine entering the U.S. from Mexico and to experience the adverse effects associated with high levels of methamphetamine use and abuse. Surveillance data based on drug treatment admissions and emergency department monitoring in San Diego suggest that the impact of methamphetamine increased between 2001 and 2005 in comparison to that of other drugs. The increase in prevalence of methamphetamine use among arrestees and the increasing number of deaths involving methamphetamine suggest that overall use of methamphetamine increased in San Diego between 2001 and 2005.
In contrast, San Diego drug treatment admissions data for 2001–2005 showed a decrease in the absolute number of admissions for primary methamphetamine abuse. If this were the only data source available, one might conclude that methamphetamine use decreased — rather than increased — over the study period. This provides a cautionary note against using a single data source to track trends in use and abuse of methamphetamine and other illicit drugs. Although recent reductions in funding for public health surveillance make maintaining multiple data sources a challenge, it is only through examining multiple data sources from variety of statistical perspectives that trends in the use and abuse of methamphetamine and other illicit drugs — and their impact on the health of communities like San Diego County — can be accurately determined.
Footnotes
The authors wish to thank all of the federal, state and local agencies that provide the data on which this report is based. Special thanks to Larry Carr and Faith Boucher of the California Department of Alcohol and Drug Programs: Judy Ball and Elizabeth Crane of the Substance Abuse and Mental Health Services Administration: Cynthia Burke of the San Diego Association of Governments; Christina Stanley of the San Diego County Medical Examiner’s Office: Liqun Wong of the Drug Enforcement Administration: and Angela Goldberg of the San Diego Methamphetamine Strike Force.
References
- Brouwer KC, Case P, Ramos R, Magis-Rodriguez C, Bucardo J, Patterson TL, Strathdee SA. Trends in production, trafficking and consumption of methamphetamine and cocaine in Mexico. Substance Use & Misuse. 2006;41:707–27. doi: 10.1080/10826080500411478. [DOI] [PMC free article] [PubMed] [Google Scholar]
- Bureau of Transportation Statistics. Transtats Intermodal Transportation Database. 2007 Accessed at www.transtats.bts.gov/bordercrossing.aspx.
- Burke C., SANDAG Personal communication. 2007.
- Drug Policy Alliance. Proposition 36: Improving Lives. Delivering Results. 2006 Accessed at http://www.drugpolicy.org/docUploads/Prop36March2006.pdf.
- Henry T. Personal communication. San Diego: County Alcohol and Drug Programs; 2007. [Google Scholar]
- National Drug Intelligence Center. U.S. Department of Justice. National Drug Threat Assessment 2007. Washington. DC: National Drug Intelligence Center; 2006a. [Google Scholar]
- National Drug Intelligence Center. U.S. Department of Justice. National Methamphetamine Threat Assessment 2007. Washington, DC: National Drug Intelligence Center; 2006b. [Google Scholar]
- San Diego and Imperial County Regional Narcotic Information Network (NIN) Narcotics Threat Assessment Fiscal Year 2007. San Diego, CA: NIN; 2007. [Google Scholar]
- San Diego and Imperial County Regional Narcotic Information Network (NIN) Street Drug Price List. San Diego, CA: NIN; 2006. [Google Scholar]
- San Diego and Imperial County Regional Narcotic Information Network (NIN) Street Drug Price List. San Diego. CA: NIN; 2005. [Google Scholar]
- U.S. Census Bureau. State and Country QuickFacts. 2007a Accessed at http://quickfacts.census.gov/qfd/states/06/06073.html.
- U.S. Census Bureau. American FactFinder. 2007b Accessed at http://factfinder.census.gov.
- U.S. Drug Enforcement Administration (DEA) Maps of Methamphetamine Lab Incidents. 2007 Accessed at www.dea.gov/concern/map_lab_seizures.html.