

Abstract
OBJECTIVES
To develop and validate a picture-based memory impairment screen (PMIS) for the detection of dementia.
DESIGN
Cross-sectional.
SETTING
Outpatient clinics, Baby Memorial Hospital, Kozhikode city in the southern Indian state of Kerala.
PARTICIPANTS
Three hundred four community-residing adults aged 55 to 94 with a mean education level of 8 years; 65 were diagnosed with dementia.
MEASUREMENTS
PMIS: a culture-fair picture-based cognitive screen designed to be administered by nonspecialists. Diagnostic accuracy estimates (sensitivity, specificity, positive and negative predictive power) of PMIS cut-scores in detecting dementia (range 0–8).
RESULTS
PMIS scores were worse in participants with dementia (1.5) than in controls (7.7, P < .001). At the optimal cut-score of 5, PMIS had a sensitivity of 95.4% (95% confidence interval (CI) = 90.3–100.0%) and a specificity of 99.2% (95% CI = 98.0–100.0%) for detecting dementia. In the 167 participants with <10 years of education, PMIS scores of five or less had a sensitivity of 97.8% (95% CI = 93.6–100.0%) and specificity of 99.2% (95% CI = 97.6–100.0%). The PMIS had better specificity than the Mini-Mental State Examination in detecting dementia, especially in older adults with low education.
CONCLUSION
The PMIS is a brief and reliable screen for dementia in elderly populations with variable literacy rates.
Keywords: Alzheimer's disease, dementia, sensitivity, specificity, diagnosis, primary care
The prevalence of dementia is predicted to increase three to four times more in developing than developed regions.1 A recent review noted that only 20% to 50% of older adults with dementia are recognized in primary care in high-income countries.2 Underdetection of dementia is expected to be greater in low- and middle-income countries. A study in India suggested that 90% of dementia cases remain unidentified.3 It is estimated that as many as 28 million of the world's 36 million people with dementia have yet to receive a diagnosis and are therefore not receiving appropriate treatment, information, and care.2 More research is needed for developing countries to estimate the extent of and risk factors for dementia and to make confident predictions of future needs.4–6
A major limiting factor in identifying dementia in developing countries is the lack of cognitive screens that account for cultural differences and variable literacy rates.4,5,7–9 Furthermore, many cognitive screens are lengthy and not designed for nonspecialist use.10,11 The Memory Impairment Screen (MIS) is a brief, four-item delayed free- and cued-recall memory test.12 It has been translated into other languages,13 correlates highly with Alzheimer's pathology,14 and is recommended for dementia screening,10,11 but it requires minimum literacy levels that restrict its use in low-education populations.13
The primary aim of the current study was to develop a picture-based version of the MIS (PMIS) to screen for dementia that would account for limitations of the MIS and other screens.11 The diagnostic accuracy of the PMIS was examined in a clinic-based sample of 304 individuals aged 55 to 94, 65 with dementia, participating in the Kerala-Einstein Study (KES).15 Feasibility of administration of the PMIS by nonspecialists was examined as a secondary aim.
METHODS
Participants
The goals of the KES were to build research infrastructure and to identify risk factors for dementia in the southern Indian state of Kerala. KES is based in Kozhikode and Thiruvananthapuram cities, as well as a rural site in Thrissur district.15 The PMIS validation study was conducted at Kozhikode and the feasibility study at Thrissur. Consecutive patient referrals to the neurology clinics at Baby Memorial Hospital, Kozhikode, between October 2008 and October 2010 were prospectively recruited.15 Reasons for referral to clinic included cognitive complaints or other neurological symptoms such as headache, strokes, or neuropathy. Additional controls were recruited from relatives of clinic patients. Inclusion criteria were aged 55 and older and willing to complete study procedures. Exclusion criteria included severe audiovisual loss or presence of active medical, neurological, or psychiatric illness that in the judgment of the study clinician (MLN) would interfere with completion of study procedures. During the 25-month study period, 360 individuals were identified, of whom 304 met study criteria. Informed consent was obtained before enrollment, and study evaluations followed protocols approved by the Baby Memorial Hospital and the Albert Einstein College of Medicine institutional review boards.
Clinical Evaluations
All interviews and tests were conducted in the local language (Malayalam). A study clinician (MN) obtained medical history, conducted a neurological examination, completed the Clinical Dementia Rating scale (CDR),16 and administered the PMIS. Another clinician (BJ) with behavioral neurology expertise assessed the following cognitive domains using locally validated tests: Addenbrooke Cognitive Examination (ACE, general cognition),8,9 Rey Auditory Verbal Learning Test (memory),17 Digit Span Test (attention and executive function),18 and 15-item Geriatric Depression Scale (mood).19 The ACE incorporates the Mini-Mental State Examination (MMSE).9 Clinicians administering PMIS and cognitive tests were blinded to each other's evaluations and to evaluations done at the clinic before enrollment.
PMIS Development and Administration
A pool of 30 color digital photographs was created based on items with high naming and familiarity scores on a locally validated line drawing series.20 The photographs were shown to 25 volunteers (40% women) aged 18 to 76 who did not participate in the validation study. The list was narrowed down to 12 photographs that all volunteers easily recognized. The photographs were randomly assigned to three sets of four pictures each. Each picture in the set belonged to a different category (Figure 1).
Figure 1.
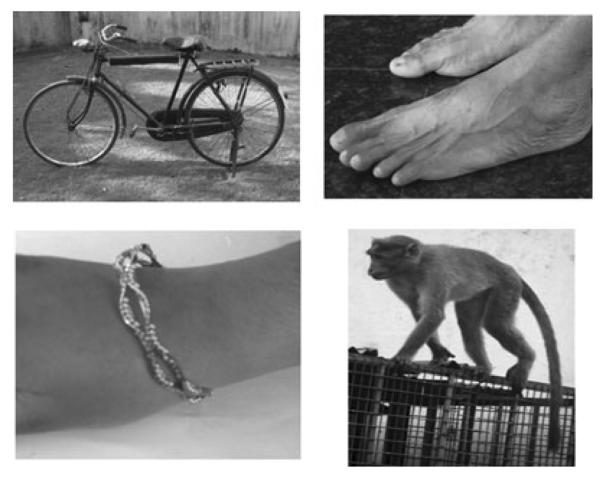
Picture-based memory impairment screen picture set example. Items with category cues clockwise from top left are bicycle (mode of transportation), feet (body part), monkey (animal), and bangle (ornament).
PMIS administration procedures followed those for MIS.12 Participants were tested individually and were randomly administered one of three sets. Participants were asked to identify the pictures shown one by one on a 13.3-inch computer screen. The computer program did not allow the examiner to change the picture set or retake the set. Participants were then asked to name each item (e.g., feet) when the tester said its category cue (e.g., body part). After an interference task lasting approximately 2 minutes (repeated counting from 1 to 20 and back or questions about activities of daily living in participants unable to count), the individual was asked to recall the pictures in any order. Category cues were presented to elicit recall only of items that were not retrieved by free recall. Two points were given for each freely recalled picture and 1 point for pictures recalled with cues (range 0–8).
Diagnostic Procedure
All clinical and neuropsychological information (except PMIS) was reviewed at consensus case conferences that two or more study clinicians attended. Dementia was diagnosed according to Diagnostic and Statistical Manual of Mental Disorders, Fourth Edition criteria.21 The clinician (MN) administering the PMIS did not assign the final diagnosis.
Statistical Methods
Analysis of variance for continuous variables and chi-square tests for categorical variables were used to test differences in baseline characteristics according to dementia status.22 The three PMIS forms were compared using the Kruskal-Wallis test.22 Internal consistency of PMIS was determined using the Cronbach coefficient alpha.22 Interrater reliability was examined in 20 participants assessed by the study clinician and a nurse independently. Twenty participants were administered the MIS, and Pearson correlations with PMIS were examined.
Discriminative validity was assessed by calculating the sensitivity and specificity of the PMIS for detecting dementia for various cut-scores.22 The base rate of dementia in the sample was 21% (65/304). Because base rate of dementia varies with setting and age, positive predictive value (PPV) and negative predictive value (NPV) are presented under different assumptions of dementia prevalence (%) using Bayes Theorem.
The discriminative validity of the PMIS was examined in participants with less than a high school-level education. Six participants could not complete the ACE (but did the PMIS).9 The discriminatory validity of the MMSE and the PMIS were compared at optimal cut-scores23 to detect dementia in the overall and low-education samples. Sensitivity analyses were conducted to account for the influence of mild cognitive impairment (MCI)24 on the PMIS. To increase generalizability, participants with depression were not excluded. All statistical analyses were performed using SAS 9.2 (SAS Institute, Inc., Cary, NC).
Power
Initial power estimates, based on the MIS study,12 indicated that 100 participants without and 50 with dementia would provide 85% power to test PMIS validity. The KES recruited a larger sample to serve other aims.15 Because all participants readily accepted the PMIS, testing was extended to the larger sample to increase power (>90%), enabling estimates of sensitivity with a standard error of 5% or less and specificity with a standard error of 3% or less.
RESULTS
Of the 304 eligible KES participants, 160 (52.6%) were men, and 144 (47.4%) were women. Mean age was 68.3. Mean education was 8 years, with 167 (54.9%) participants with less than a high school–level education (<10 years) and 16 (5.3%) without formal schooling. Sixty-five participants met dementia criteria (34 Alzheimer's disease (AD), 17 vascular dementia, 12 mixed dementia, and one unspecified).
All participants completed the PMIS in 4 minutes. Mean PMIS score was 6.4 ± 2.8. PMIS scores showed good correlation with the ACE (Pearson correlation coefficient (r) = 0.79, P < .001) and the MMSE (r = 0.80, P < .001). PMIS scores were weakly correlated with age (r = −0.36), education (r = −0.21) and depressive symptoms (r = −0.15). PMIS scores were not different in men (6.6 ± 2.5) and women (6.3 ± 3.0, P = .35). PMIS scores were worse in individuals with dementia (1.5) than in controls (7.7, P < .001), as were other cognitive test scores (Table 1). The 44 participants with Geriatric Depression Scale scores of 10 or greater (cut-score for major depression) had worse MMSE (20.8 ± 2.9 vs 25.8 ± 2.8, P < .001) but not PMIS scores (6.7 ± 1.1 vs 7.6 ± 0.4, P = .35) than the other participants.
Table 1.
Demographic Variables and Cognitive Performance Overall and According to Dementia Status
| Variable | Overall, n = 304 | Dementia, n = 65 | Controls, n = 239 | P-Value |
|---|---|---|---|---|
| Age, mean ± SD | 68.3 ± 6.3 | 72.2 ± 7.2 | 67.3 ± 5.7 | <.001 |
| Female (%) | 47.4 | 55.4 | 45.1 | .09 |
| Education, years, mean ± SD | 8.0 ± 3.8 | 6.5 ± 3.5 | 8.4 ± 3.8 | <.001 |
| Cognitive tests, mean ± SD | ||||
| Picture-based Memory Impairment Screen (range 0–8) | 6.4 ± 2.8 | 1.5 ± 2.0 | 7.7 ± 0.5 | <.001 |
| Addenbrooke Cognitive Examination (range 0–100) | 69.5 ± 22.2 | 35.9 ± 16.7 | 78.4 ± 13.1 | <.001 |
| Mini-Mental State Examination (range 0–30) | 24.9 ± 7.0 | 13.5 ± 6.1 | 27.4 ± 3.2 | <.001 |
| Rey Auditory Verbal Learning Test 20-minute recall | 3.8 ± 3.5 | 0.1 ± 0.6 | 4.8 ± 3.2 | <.001 |
| Digit span forward | 5.5 ± 3.4 | 3.9 ± 1.1 | 5.9 ± 1.1 | <.001 |
| Digit span backward | 3.4 ± 2.8 | 1.3 ± 1.4 | 3.9 ± 2.8 | <.001 |
| Geriatric Depression Scale (range 0–15) | 4.9 ± 3.4 | 6.1 ± 3.1 | 4.6 ± 3.4 | .001 |
SD = standard deviation.
P-values are for comparisons between participants with dementia and controls using chi-square and t-tests.
Reliability and Feasibility
No effect of picture set was found on PMIS (P = .77), indicating high alternate forms reliability. The Cronbach alpha for all participants was 0.90. Interrater reliability on PMIS scores between the study clinician (MN) and nurse in 20 participants was excellent (intraclass correlation (ICC) = 0.91). Concordance between PMIS and MIS scores in 20 participants was excellent (ICC = 0.88).
To demonstrate feasibility of administering PMIS by nonspecialists, two healthcare workers with 10 years of education were trained in one session to administer the PMIS. Individual picture prints were used. The healthcare workers administered the PMIS to 21 individuals (aged 60–84, 52% women) at the rural KES site. Mean PMIS score was 7.2 ± 0.5. A psychiatrist (KSS) blinded to PMIS scores diagnosed all participants as cognitively normal (ICC = 1.00). The psychiatrist did not participate in diagnostic conferences for the primary study. The site and participants were not part of the validation study.
Validity
The optimal PMIS cut-score is 5 (sensitivity 95.4%, 95% confidence interval (CI) = 90.3–100.0%; specificity 99.2%, 95% CI = 98.0–100.0%). The association of this cut-score with dementia remained significant even after adjustments for age, sex, education, and depressive symptoms (P < .001). In a subgroup analysis matching the 65 individuals with dementia to 103 controls according to median age, sex, and low education, the PMIS cut-score retained high sensitivity (95.0%) and specificity (98.1%).
Table 2 shows the PPV and NPV of PMIS scores at different dementia base rates. The PPV for a PMIS score of 5 or less for detecting dementia varies from 53.5% at a 1% dementia base rate to 96.6% at a 20% rate. NPV varied from 85.7% to 98.8% at different dementia rates.
Table 2.
Discriminative Validity of Picture-Based Memory Impairment Screen (PMIS)
| Prevalence of Dementia |
||||||||||
|---|---|---|---|---|---|---|---|---|---|---|
| 1% |
5% |
10% |
20% |
|||||||
| PMIS Score | Sensitivity | Specificity | PPV | NPV | PPV | NPV | PPV | NPV | PPV | NPV |
| 0 | 0.523 | 1.000 | 1.000 | 0.995 | 1.000 | 0.976 | 1.000 | 0.950 | 1.000 | 0.893 |
| 1 | 0.615 | 1.000 | 1.000 | 0.996 | 1.000 | 0.980 | 1.000 | 0.959 | 1.000 | 0.912 |
| 2 | 0.723 | 1.000 | 1.000 | 0.997 | 1.000 | 0.986 | 1.000 | 0.970 | 1.000 | 0.935 |
| 3 | 0.815 | 1.000 | 1.000 | 0.998 | 1.000 | 0.990 | 1.000 | 0.980 | 1.000 | 0.956 |
| 4 | 0.862 | 0.996 | 0.675 | 0.999 | 0.916 | 0.993 | 0.958 | 0.985 | 0.981 | 0.966 |
| 5 | 0.954 | 0.992 | 0.535 | 1.000 | 0.857 | 0.998 | 0.927 | 0.995 | 0.966 | 0.988 |
| 6 | 0.985 | 0.946 | 0.155 | 1.000 | 0.488 | 0.999 | 0.668 | 0.998 | 0.819 | 0.996 |
| 7 | 0.985 | 0.824 | 0.054 | 1.000 | 0.228 | 0.999 | 0.384 | 0.998 | 0.583 | 0.995 |
| 8 | 1.000 | 0.000 | 0.010 | — | 0.050 | — | 0.100 | — | 0.200 | — |
Sensitivity and specificity were calculated based on results obtained from the study sample. Positive predictive value (PPV) and negative predictive value (NPV) were calculated at different hypothetical dementia base rates (see Methods).
The mean PMIS score was 1.7 ± 2.1 in 34 participants with AD and 1.4 ± 2.0 in 31 with dementia other than AD. The PMIS score of 5 or less detected AD with a sensitivity of 94.1% (95% CI = 86.2–100.0%) and a specificity of 99.2% (95% CI = 98.0–100.0%). CDR score16 in the dementia cases was 0.5 in four participants, one in 12, and two or greater in 49. The sensitivity of a PMIS score of 5 or less to detect 16 mild dementia cases (CDR score of 0.5 or 1) was 82.4%, specificity was 99.2%, PPV was 87.5%, and NPV was 98.8%.
The established MMSE dementia cut-score of 24 had a sensitivity of 96.9% (95% CI = 92.7–100.0%) and a specificity of 83.3% (95% CI = 78.5–88.0%). The sensitivity of the MMSE, hence, was similar to that of the PMIS, although the specificity of the PMIS was higher. When restricted to 167 participants with low or no education, a PMIS score of 5 or less had a sensitivity of 97.8% (95% CI = 93.6–100.0%) and a specificity of 99.2% (95% CI = 97.6–100.0%) for detecting dementia. In contrast, the MMSE cut-score of 24 had a sensitivity of 100% and a specificity of 71.1% (95% CI = 63.0–79.2%). A PMIS score of 5 or less had high sensitivity (89.5%) and specificity (99.2%) in the 137 participants with high school–level education or higher.
Twenty-seven participants met criteria for MCI (74% amnestic).24 Mean PMIS score in participants with MCI was 7.2 ± 1.0. Sensitivity (95.4%) and specificity (99.5%) for a PMIS score of 5 or less remained high after excluding MCI cases.
DISCUSSION
The PMIS is a quick and reliable screen for dementia that can be used in older adults with little or no education. It discriminated cognitively normal older adults from those with dementia regardless of age, sex, education, severity of dementia, or presence of depression. All participants completed the PMIS, which took approximately 4 minutes including the interference task. High interrater reliability was demonstrated between administration of PMIS by the clinician and the nurse. The high alternate-forms reliability supports use of different PMIS sets for repeated testing. Professionals and nonprofessionals successfully administered the PMIS in urban and rural clinic settings. The PMIS was administered on a computer screen and using cards. These findings support the feasibility of using the PMIS in various settings and by personnel with different levels of expertise.
High concordance was seen as expected between the MIS and the PMIS,12 although a main limitation of the MIS is that it cannot be applied to low-education populations. Low education and cultural differences can result in cognitively unimpaired people screening positive for dementia.6 Most screens have not been validated in samples with low education or illiterate individuals.6,7 More than half of the participants in the current study had low education, including one-third who had 5 years or less of schooling or were illiterate. The PMIS was successfully administered to all of these participants (six could not do ACE) and had high diagnostic accuracy. Most of these participants would not be able to complete the MIS. In a study from Spain, 16% of the sample with low education could not complete the MIS.13 The PMIS had better specificity than the MMSE, especially in the low-education group. Dementia screens that are designed to be self-administered25 or rely on reliable and educated informants26 may have limited generalizability in populations with low or no literacy.
Pictures are remembered better than words. The visual component of the PMIS involves deeper or additional layers of cognitive processing; enhancing learning and recall. Poor visual memory predicts dementia,27 suggesting an alternate mechanism (not tapped by the MIS) for PMIS validity in detecting dementia. Other pictorial tests such as the visual association test,28 phototest,13 and scenery picture memory test29 have reliably detected dementia in developed countries, supporting the approach of the current study.
Table 2 shows sensitivity and specificity based on the sample and PPV and NPV at hypothetical dementia base rates that can guide choice of cut-scores. A sensitive PMIS cut-score can be used to monitor cognitive function in older adults and guide timing of follow-up visits, whereas a specific cut-score with high PPV can be used to avoid false-positive cases when recruiting candidates for clinical trials involving potentially toxic medications.
As with any volunteer sample, selection biases limit generalization of results. The sample was less selective than samples excluding individuals with MCI, depression, or low education.10–12,25 As with any cognitive test, cross-validation in other settings and populations is necessary. Pictures that are locally relevant can be selected when using the PMIS in other parts of the world, although test principles and procedures will remain the same. Although some but not all previous studies have used larger samples,11,25,26 absence of power estimates is a major limitation of most reports of diagnostic tests.30 Depression can lead to false-positive dementia diagnoses.31 Depressive symptoms are common in older adults and often coexist with cognitive impairment.31 Hence, individuals with depression were not excluded, which would reduce generalizability. PMIS scores were only weakly correlated with depressive symptoms.
The initial step in evaluating older adults presenting with cognitive complaints is to detect or exclude dementia regardless of subtype. Because the PMIS is a cognitive screening test, individuals who fail it should be referred for definitive diagnostic assessment. Alternatively, individuals scoring in the normal range could be asked to return for a repeat screen at a longer interval.
ACKNOWLEDGMENTS
Preliminary findings from this study were presented at the International Conference on Alzheimer's Disease meetings, Vienna, Austria, July 2009 (lecture), and Paris, France, July 2011 (poster).
Sponsors Role: The sponsor had no role in the design, collection, analysis, or interpretation of the data, the writing of the article, or the decision to submit it for publication.
Footnotes
Conflict of Interest: The study was supported by National Institute on Aging Grants R01 AG039330–01 and R21AG029799.
Author Contributions: JV provided the study concept and wrote the initial draft of the manuscript. MLN, BJ, KAS, AA, HB, CW, KSS, VGP, and PSM made critical revisions to the manuscript. JV, PSM, AA, KAS, VGP, and KSS formed the KES research committee, which designed and implemented the study. CW performed the statistical analysis. All authors had full access to all of the data (including statistical reports and tables) in the study and take responsibility for the integrity of the data and the accuracy of the data analysis.
REFERENCES
- 1.Ferri CP, Prince M, Brayne C, et al. Global prevalence of dementia: A Delphi consensus study. Lancet. 2005;366:2112–2117. doi: 10.1016/S0140-6736(05)67889-0. [DOI] [PMC free article] [PubMed] [Google Scholar]
- 2.Prince M, Bryce R. World Alzheimer Report 2011. [Accessed July 31, 2012];The Benefits of Early Diagnosis and Intervention [on-line] Available at http://www.alz.co.uk/research/WorldAlzheimerReport2011.pdf.
- 3.Dias A, Patel V. Closing the treatment gap for dementia in India. Indian J Psychiatry. 2009;51:S93–S97. [PMC free article] [PubMed] [Google Scholar]
- 4.Ganguli M, Hendrie HC. Screening for cognitive impairment and depression in ethnically diverse older populations. Alzheimer Dis Assoc Disord. 2005;19:275–278. doi: 10.1097/01.wad.0000190807.90254.24. [DOI] [PubMed] [Google Scholar]
- 5.Keefover RW, Rankin ED, Keyl PM, et al. Dementing illnesses in rural populations: The need for research and challenges confronting investigators. J Rural Health. 1996;12:178–187. doi: 10.1111/j.1748-0361.1996.tb00792.x. [DOI] [PubMed] [Google Scholar]
- 6.Prince M. Methodological issues for population-based research into dementia in developing countries. A position paper from the 10/66 Dementia Research Group. Int J Geriatr Psychiatry. 2000;15:21–30. doi: 10.1002/(sici)1099-1166(200001)15:1<21::aid-gps71>3.0.co;2-5. [DOI] [PubMed] [Google Scholar]
- 7.Chandra V, Ganguli M, Ratcliff G, et al. Practical issues in cognitive screening of elderly illiterate populations in developing countries. The Indo-US Cross-National Dementia Epidemiology Study. Aging (Milano) 1998;10:349–357. doi: 10.1007/BF03339881. [DOI] [PubMed] [Google Scholar]
- 8.Mathuranath PS, Cherian JP, Mathew R, et al. Mini Mental State Examination and the Addenbrooke's cognitive examination: Effect of education and norms for a multicultural population. Neurol India. 2007;55:106–110. doi: 10.4103/0028-3886.32779. [DOI] [PubMed] [Google Scholar]
- 9.Mathuranath PS, Hodges JR, Mathew R, et al. Adaptation of the ACE for a Malayalam speaking population in southern India. Int J Geriatr Psychiatry. 2004;19:1188–1194. doi: 10.1002/gps.1239. [DOI] [PubMed] [Google Scholar]
- 10.Holsinger T, Deveau J, Boustani M, et al. Does this patient have dementia? JAMA. 2007;297:2391–2404. doi: 10.1001/jama.297.21.2391. [DOI] [PubMed] [Google Scholar]
- 11.Lorentz WJ, Scanlan JM, Borson S. Brief screening tests for dementia. Can J Psychiatry. 2002;47:723–733. doi: 10.1177/070674370204700803. [DOI] [PubMed] [Google Scholar]
- 12.Buschke H, Kuslansky G, Katz M, et al. Screening for dementia with the memory impairment screen. Neurology. 1999;52:231–238. doi: 10.1212/wnl.52.2.231. [DOI] [PubMed] [Google Scholar]
- 13.Carnero-Pardo C, Espejo-Martinez B, Lopez-Alcalde S, et al. Effectiveness and costs of phototest in dementia and cognitive impairment screening. BMC Neurol. 2011;11:92. doi: 10.1186/1471-2377-11-92. [DOI] [PMC free article] [PubMed] [Google Scholar]
- 14.Verghese J, Buschke H, Kuslansky G, et al. Antemortem memory impairment screen performance is correlated with postmortem Alzheimer pathology. J Am Geriatr Soc. 2003;51:1043–1045. doi: 10.1046/j.1365-2389.2003.51326.x. [DOI] [PubMed] [Google Scholar]
- 15.Ambrose AF, Noone ML, Pradeep VG, et al. Gait and cognition in older adults: Insights from the Bronx and Kerala. Ann Indian Acad Neurol. 2011;13:S99–S103. doi: 10.4103/0972-2327.74253. [DOI] [PMC free article] [PubMed] [Google Scholar]
- 16.Morris JC. The Clinical Dementia Rating (CDR): Current version and scoring rules. Neurology. 1993;43:2412–2414. doi: 10.1212/wnl.43.11.2412-a. [DOI] [PubMed] [Google Scholar]
- 17.Ranjith N, Mathuranath PS, Sharma G, et al. Qualitative aspects of learning, recall, and recognition in dementia. Ann Indian Acad Neurol. 2010;13:117–122. doi: 10.4103/0972-2327.64639. [DOI] [PMC free article] [PubMed] [Google Scholar]
- 18.Wechsler D. Wechsler Adult Intelligence Scale—Revised (WAIS-R) Psychological Corporation; New York: 1981. [Google Scholar]
- 19.Yesavage JA, Brink TL, Rose TL, et al. Development and validation of a geriatric depression screening scale: A preliminary report. J Psychiatr Res. 1982;17:37–49. doi: 10.1016/0022-3956(82)90033-4. [DOI] [PubMed] [Google Scholar]
- 20.George A, Mathuranath PS. Community-based naming agreement, familiarity, image agreement and visual complexity ratings among adult Indians. Ann Indian Acad Neurol. 2007;10:92–99. [Google Scholar]
- 21.American Psychiatric Association . Diagnostic and Statistical Manual of Mental Disorders. 4th Ed American Psychiatric Association; Washington, DC: 1994. [Google Scholar]
- 22.Altman DG. Practical Statistics for Medical Research. 2nd Ed Chapman & Hall/CRC; London: 2006. [Google Scholar]
- 23.Feher EP, Mahurin RK, Doody RS, et al. Establishing the limits of the Mini-Mental State Examination of `subtests'. Arch Neurol. 1992;49:87–92. doi: 10.1001/archneur.1992.00530250091022. [DOI] [PubMed] [Google Scholar]
- 24.Petersen RC. Mild cognitive impairment as a diagnostic entity. J Intern Med. 2004;256:183–194. doi: 10.1111/j.1365-2796.2004.01388.x. [DOI] [PubMed] [Google Scholar]
- 25.Brown J, Pengas G, Dawson K, et al. Self administered cognitive screening test (TYM) for detection of Alzheimer's disease: Cross sectional study. BMJ. 2009;338:b2030. doi: 10.1136/bmj.b2030. [DOI] [PMC free article] [PubMed] [Google Scholar]
- 26.Galvin JE, Roe CM, Powlishta KK, et al. The AD8: A brief informant interview to detect dementia. Neurology. 2005;65:559–564. doi: 10.1212/01.wnl.0000172958.95282.2a. [DOI] [PubMed] [Google Scholar]
- 27.Kawas CH, Corrada MM, Brookmeyer R, et al. Visual memory predicts Alzheimer's disease more than a decade before diagnosis. Neurology. 2003;60:1089–1093. doi: 10.1212/01.wnl.0000055813.36504.bf. [DOI] [PubMed] [Google Scholar]
- 28.Lindeboom J, Schmand B, Tulner L, et al. Visual association test to detect early dementia of the Alzheimer type. J Neurol Neurosurg Psychiatry. 2002;73:126–133. doi: 10.1136/jnnp.73.2.126. [DOI] [PMC free article] [PubMed] [Google Scholar]
- 29.Takechi H, Dodge HH. Scenery Picture Memory Test: A new type of quick and effective screening test to detect early stage Alzheimer's disease patients. Geriatr Gerontol Int. 2010;10:183–190. doi: 10.1111/j.1447-0594.2009.00576.x. [DOI] [PMC free article] [PubMed] [Google Scholar]
- 30.Bachmann LM, Puhan MA, ter Riet G, et al. Sample sizes of studies on diagnostic accuracy: Literature survey. BMJ. 2006;332:1127–1129. doi: 10.1136/bmj.38793.637789.2F. [DOI] [PMC free article] [PubMed] [Google Scholar]
- 31.Wright SL, Persad C. Distinguishing between depression and dementia in older persons: Neuropsychological and neuropathological correlates. J Geriatr Psychiatry Neurol. 2007;20:189–198. doi: 10.1177/0891988707308801. [DOI] [PubMed] [Google Scholar]