

Abstract
The emergence of next-generation sequencing (NGS) technologies offers an incredible opportunity to comprehensively study DNA sequence variation in human genomes. Commercially available platforms from Roche (454), Illumina (Genome Analyzer and Hiseq 2000), and Applied Biosystems (SOLiD) have the capability to completely sequence individual genomes to high levels of coverage. NGS data is particularly advantageous for the study of structural variation (SV) because it offers the sensitivity to detect variants of various sizes and types, as well as the precision to characterize their breakpoints at base pair resolution. In this chapter, we present methods and software algorithms that have been developed to detect SVs and copy number changes using massively parallel sequencing data. We describe visualization and de novo assembly strategies for characterizing SV breakpoints and removing false positives.
Keywords: Next-generation sequencing, Paired-end sequencing, 454, Illumina, Solexa, Abi solid, Insertions, Deletions, Duplications, Inversions, Translocations, Indels, Copy number variants
1. Introduction
Massively parallel sequencing technologies have fundamentally changed the study of genetics and genomics. New instruments from Roche (454), Illumina (Genome Analyzer and Hiseq 2000), and Applied Biosystems (SOLiD) generate millions of DNA sequence reads in a single run, enabling researchers to address questions with unprecedented speed (1). These next-generation sequencing (NGS) technologies make it feasible to sequence entire genomes to high levels of coverage in a matter of weeks. Indeed, the complete genomes of several individuals have been sequenced on new platforms (2–9), and ambitious efforts like the 1,000 Genomes Project (http://www.1000genomes.org) aim to add thousands more, offering an unprecedented survey of DNA sequence variation in humans.
NGS has enabled powerful new approaches for the detection of copy number variation (CNV) and structural variation (SV) in the human genome. Compared to array-based methods, NGS has demonstrated higher sensitivity, in terms of the types and sizes of variants that can be detected. Furthermore, sequencing enabled the precise definition of SV breakpoints, information that is critical for assessing functional impact and inferring likely mutational mechanisms of origin.
Most current approaches to sequence-based SV detection extend seminal work by Volik et al. (10) and Raphael et al. (11). Their method, first presented in 2003, applied end-sequence profiling (ESP) of bacterial artificial chromosomes to map structural rearrangements in cancer cell lines. The ESP method requires sequencing both ends of a genomic fragment of known size (e.g., a 200-kb BAC insert) and then mapping the end-sequence pair to a reference sequence. Fragments overlapping SV events result in paired sequences that map to different parts of the reference genome, possibly another chromosome entirely. In 2005, Tuzun et al. (12) used this approach to systematically discover SVs in a human genome, reporting hundreds of intermediate-sized variants, including insertions, deletions, and inversions.
Paired-end sequencing on NGS platforms has enabled detection of CNV and SV in the human genome at unprecedented scale and throughput, and at a substantially reduced cost. Korbel et al. (13) developed a paired-end mapping (PEM) approach for the Roche/454 platform and used it to fine-map more than 1,000 SVs in two human genomes. Campbell et al. (14) used Illumina paired-end sequencing to characterize genomic rearrangements in cancer cell lines. Massively parallel sequencing has since been employed to systematically characterize large-scale variation in individual (2, 6, 8, 13) and cancer (14–17) genomes.
Although NGS platforms are well-suited to CNV and SV detection, analysis of NGS data presents substantial bioinformatics challenges due to the relatively short read lengths (36–250 bp) and the unprecedented volume of data. In this chapter, we discuss the tools and methods that have been developed for NGS data analysis – including alignment, assembly, variant detection, and visualization – for the characterization of CNV and structural variation.
2. Materials
2.1. Massively Parallel Sequencing Data
Three commercially available NGS platforms have been successfully applied to the discovery of CNV/SV in humans, and will be the focus of this review: the 454 platform (Roche), the GenomeAnalyzer/HiSeq2000 platform (Illumina), and the SOLiD platform (Life Technologies).
2.1.1. Roche (454) Data
The Roche (454) Genome Sequencer FLX (18) utilizes massively parallel pyrosequencing of DNA fragments that are amplified en masse by emulsion PCR (1). The current FLX Titanium chemistry produces up to 1.25 million reads per run, with read lengths of ~400 bp. A single run yields almost half a billion base pairs (0.5 gb) of high-quality sequence. While the 454 platform is prone to indel errors near runs of multiple nucleotides (homopolymers), the substitution error rate is very low, and the relatively long reads are well-suited to alignment or de novo assembly.
2.1.2. Illumina (Solexa) Data
The Illumina (Solexa) Genome Analyzer IIx utilizes sequencing-by-synthesis of surface-amplified DNA fragments (3). While the reads produced on the Illumina platform were initially quite short (~32–40 bp), the current instrument yields ~500 million 100-bp reads (50 gb) per run. The astonishing sequence throughput of Illumina machines present substantial informatics challenges, particularly the alignment of short sequences of imperfect quality to large reference sequences. Indeed, an entire generation of novel algorithms (Maq, BWA, Novoalign, Bowtie, and others) has been developed to address the analysis challenges of Illumina sequencing.
2.1.3. ABI SOLiD Data
The Applied Biosystems SOLiD sequencer uses a unique process catalyzed by DNA ligase, in which oligo adapter-linked DNA fragments are coupled to magnetic beads and amplified by emulsion PCR (6). The current instrument (SOLiD 3) produces up to 50 gb of high-quality sequence per slide in the form of 35- or 50-bp reads. A unique advantage of the ABI SOLiD platform is its di-base encoding scheme, in which each base is effectively called twice in a sequencing read. The availability of two calls per base makes it possible to distinguish between sequencing errors and true variation, thereby improving the overall accuracy of reads from this platform.
2.1.4. Paired-End Libraries
The optimal dataset for SV detection is paired-end sequence data, produced by sequencing both ends of randomly sheared DNA fragments that have been size-selected by gel electrophoresis or other techniques. Because both reads in a pair come from a linear DNA fragment of known (approximate) size, their relative distance and orientation when mapped to a reference sequence can indicate the presence of underlying structural variation.
2.2. Bioinformatics Resources
Most NGS platforms include basecalling software from the manufacturer. Systematic mapping and/or assembly of NGS data require additional software. A selection of the tools available for short read alignment, assembly, and data handling is provided in Table 1.
Table 1.
Software tools and algorithms for alignment, SAM/BAM integration, copy number estimation, SV detection, and de novo assembly using NGS data
| Software | Description | URL |
|---|---|---|
| Read alignment/mapping | ||
| Maq | Widely used mapping algorithm for short NGS reads | http://www.maq.sourceforge.net |
| BWA/BWASW | Burrows-Wheeler Aligner for mapping short (bwa) or long (bwasw) reads | http://www.bio-bwa.sourceforge.net |
| Bowtie | Ultrafast short read aligner for Illumina data | http://www.bowtie-bio.sourceforge.net |
| BFAST | Customizable BLAT-like read mapping tool for NGS data | http://www.genome.ucla.edu/bfast |
| SHRiMP | Efficient Smith-Waterman aligner for short read data | http://www.compbio.cs.toronto.edu/shrimp |
| SOAP | Short oligo analysis package for alignment and variant calling | http://www.soap.genomics.org.cn/ |
| mrFAST | Maps read to all possible locations for duplication/CNV detection. | http://www.mrfast.sourceforge.net |
| SSAHA2 | Sequence Search and Alignment by Hashing Algorithm | http://www.sanger.ac.uk/resources/software/ssaha2 |
|
| ||
| SAM/BAM file operations | ||
| SAMtools | A suite of tools for manipulating NGS data in SAM/BAM format | http://www.samtools.sourceforge.net |
| Picard | A suite of Java tools for validating and de-duplicating SAM/BAM files | http://www.picard.sourceforge.net |
|
| ||
| Copy number estimation | ||
| EWT | CNV calling with event-wise testing (EWT) | http://www.genome.cshlp.org/content/19/9/1586 |
| SegSeq | CNV calling with local changepoint analysis and merging | http://www.broad.mit.edu/cancer/pub/solexa_copy_numbers |
| CMDS | Recurrent CNA calling in sample populations | https://www.dsgweb.wustl.edu/qunyuan/software/cmds |
|
| ||
| Structural variation detection | ||
| BreakDancer | SV prediction tool for paired-end Illumina data | http://www.genome.wustl.edu/tools/cancer-genomics |
| GASV | Geometric method for SV detection | http://www.cs.brown.edu/people/braphael/software.html |
| Pindel | Indel prediction tool for paired-end NGS data | http://www.ebi.ac.uk/~kye/pindel |
|
| ||
| De novo assembly | ||
| ABySS | A de novo, parallel, paired-end sequence assembler for short reads | http://www.bcgsc.ca/platform/bioinfo/software/abyss |
| Velvet | A de novo sequence assembler for short reads | http://www.ebi.ac.uk/~zerbino/velvet |
| TIGRA | De novo assembly of SV breakpoints | http://www.genome.wustl.edu/ |
|
| ||
| Visualization | ||
| Circos | Circular visualization of genome and comparative genomics data | http://www.mkweb.bcgsc.ca/circos/ |
| IGV | BAM-driven integrative genomics viewer for NGS data | http://www.broadinstitute.org/igv |
| LookSeq | Web-based tool for visualization and analysis of sequence alignments | http://www.sanger.ac.uk/resources/software/lookseq |
| Pairoscope | BAM-driven visualization of predicted structural variants | http://www.pairoscope.sourceforge.net |
| Savant | Desktop visualization tool that represents paired-end reads for SV identification. | http://www.compbio.cs.toronto.edu/savant |
2.2.1. Computing Resources
It should be noted that the processing of large massively parallel sequencing datasets, even with advanced algorithms, requires substantial computational resources. At the very least, a dedicated Linux/UNIX/MacOSX server (preferably 64-bit) with at least 2 GB of RAM will be required for data processing. Alignment of just a single lane of Illumina paired-end data (25–30 million read pairs) to the human genome takes anywhere from 4 to 24 h, depending on the hardware, data quality, read length, and mapping parameters.
2.2.2. Short Read Aligners
The critical first step to analysis of NGS data is alignment to a reference sequence. Several short read mapping tools have been developed to address the relatively short read lengths and sheer volume of data produced by NGS platforms. These have been reviewed extensively elsewhere (19); a selection of short read aligners is provided in Table 1. Widely used aligners for Illumina and ABI SOLiD data include Maq (20), BWA (21), Bowtie (22), BFAST (23), and SHRiMP (24). For longer reads generated on the Roche/454 platform, SSAHA2 (25) and BWASW (26) are widely used. Perhaps the most important consideration in selecting an alignment algorithm is its compatibility with the SAM format specification, which is described below.
2.2.3. SAM/BAM Format Specification
The specification of the sequence alignment/map (SAM) format and its compressed binary equivalent (BAM) has simplified NGS data analysis dramatically (27). In essence, SAM format (http://www.samtools.sourceforge.net/SAM1.pdf) enables storing large numbers of sequences (reads), along with their alignments to a reference genome or assembly, in a single file. SAM/BAM files are compact, but flexible enough to accommodate multiple NGS data types and software algorithms. The SAM specification has been widely adopted by the NGS bioinformatics community; many aligners can output directly into SAM/BAM, and a number of freely available tools, including SAMtools ((27), http://www.samtools.sourceforge.net) and Picard (http://www.picard.sourceforge.net) provide the functions to view, merge, sort, index, filter, assemble, and perform other operations on SAM/BAM files.
2.3. Ancillary CNV/SV Data
To fine-tune and evaluate the performance of SV detection, a set of known structural events can be valuable. Spectral karyotyping data and even cytogenetic analysis can reveal chromosomal deletions, duplications, or translocations that should manifest in the sequence data. Copy number changes and structural variants inferred from high-resolution array data (SNP or CGH), if available, serve as true positive controls; studies have shown that sequence-based approaches are highly sensitive for identifying SVs detected by array-based methods (28).
3. Methods
Massively parallel sequencing technologies have enabled genome-wide characterization of CNV and structural variation in a single experiment (Fig. 1). It begins with the alignment of sequence reads to a reference sequence. In paired-end sequencing, the alignment process yields three smaller datasets: (1) reads mapped with “correct” pairing, with expected orientation and distance between mates, (2) reads mapped in pairs deemed “discordant” in terms of distance and/or orientation, or where only one read is mapped, and (3) reads that are not mapped at all. Once all possible reads have been mapped, the resulting read depth (after some normalization) serves as a quantitative measure of genome-wide copy number. Segmentation algorithms and other methods have been developed to call copy number variants (CNVs) from read depth. For SV detection, most approaches first examine reads in set (2) above whose discordant mapping suggests the presence of underlying variation.
Fig. 1.

Detection of copy number variation (CNV) and structural variation (SV) by massively parallel sequencing. When aligned to a reference sequence, read pairs are classified as mapped normally, mapped discordantly, or unmapped. Both classes of mapped reads are used for inference of read depth and then CNV calling. Discordant pairs are utilized for prediction of SVs, which are further resolved by de novo assembly using both discordant and unmapped reads.
3.1. Copy Number Analysis
Massively parallel sequencing data can be used to infer DNA CNVs throughout the genome. Most sequencing-based approaches for CNV detection partition the genome into nonoverlapping bins and use the read depth (RD) to look for regions that differ in copy number. In contrast to methods for SV detection, estimates of copy number typically utilize read pairs that map uniquely to the genome with correct spacing and orientation. Fragment-end (unpaired) reads may also be used.
3.1.1. Addressing Mapping Bias
To address issues related to read mapping bias, it is important to correct for varying levels of uniqueness across the genome. Campbell et al. (14) performed this correction after in silico simulations of Illumina 2 × 35 bp paired-end reads, which were mapped to the genome using Maq (20). The genome was divided into nonoverlapping windows of varying widths such that each window contained a 425 uniquely mapped reads, equivalent to ~15 kb of mapped sequence.
3.1.2. Addressing GC Content Bias
Sequencing coverage on NGS platforms is influenced by G + C content. On the Illumina platform, average sequence coverage is significantly reduced for regions with particularly low (<20%) or high (>60%) G + C content (3). Yoon et al. (29) addressed G + C bias by segmenting the genome into 100-bp windows, and adjusting each window’s read counts based on the observed deviation in coverage for a given G + C percentage.
3.1.3. Circular Binary Segmentation
The GC-adjusted read depth within defined windows serves as a quantitative measurement of genome copy number. Thus, copy number changes can be detected using the same types of segmentation algorithms that were developed for SNP or CGH microarray data. Campbell et al. adapted a circular binary segmentation algorithm for SNP array data to detect statistically significant copy number changes. Their adapted algorithm, implemented in R as the “DNAcopy” library of the Bioconductor project (http://www.bioconductor.org), takes the normalized read count for each window as input and estimates both the copy number in each region and the boundaries (change points) defining the copy number change. To evaluate the accuracy of their method, Campbell et al. compared CNV calls based on uniquely mapped, correctly paired reads to predictions of structural variants from aberrantly mapped read pairs. Their CNV algorithm identified all nine tandem duplications in a cancer cell line (ranging in size from <1 kb to 2.7 Mb) and correctly predicted the breakpoints to within 30 kb (14).
3.1.4. Event-Wise Testing
Yoon et al. developed a novel three-step algorithm, called event-wise testing (EWT), to identify CNVs from read depth data (29). First, EWT rapidly searches the genome for specific classes of small events that meet predefined criteria for statistical significance. Then, clusters of small events with a copy number changed in the same direction are merged together into a single CNV call. Events with a low absolute difference in read depth (between 0.75 and 1.25 times the mean) are removed. Finally, the significance of each merged event is assessed with a one-sided Z-test. Application of EWT to simulated data, as well as real data from the 1,000 Genomes Project, suggested a good sensitivity for events larger than 1 kb, and high specificity (75–89%) for CNV calls that were polymorphic in multiple individuals (29).
3.1.5. SegSeq
Chiang et al. (30) applied massively parallel sequencing to map copy number alterations in tumor cell lines. Their method, called SegSeq, combines local change-point analysis with a merging procedure that joins adjacent segments. Tumor and normal read counts for the full segments are used to determine statistical significance. When applied to three tumor cell lines, their algorithm identified 194, 126, and 15 copy number alterations, compared to 153, 93, and 18 alterations identified from SNP array data. The results from both methods were highly concordant, but the sequencing approach yielded better breakpoint resolution and a higher dynamic range for copy number estimation (30).
3.2. Mapping Segmental Duplications
Duplicated regions play important roles in genetic and phenotypic variation, but have been refractory to characterization due to their repetitive structure and high copy number in the human genome. Alkan et al. (31) developed an approach to comprehensively map these regions using NGS. Their algorithm, mrFAST, places NGS reads to all possible locations in the reference genome, which is critical to accurately determine the copy number of duplicated sequences. When applied to three human genomes, this approach revealed that individuals differ in copy number for 73–87 genes on average, differences that largely correspond to segmental duplications (31).
3.3. Detection of Structural Variation
Numerous algorithms have been developed in recent years to identify and characterize SVs from massively parallel sequencing data. Many of these leverage paired-end sequencing, in which a fragment of known size is sequenced at both ends. Read pairing information not only improves the accuracy of read mapping (32), but can be used to infer the presence of underlying structural variation (33) (see Fig. 2). Several diverse yet robust methods have been successfully applied to SV detection using paired-end sequencing datasets.
Fig. 2.
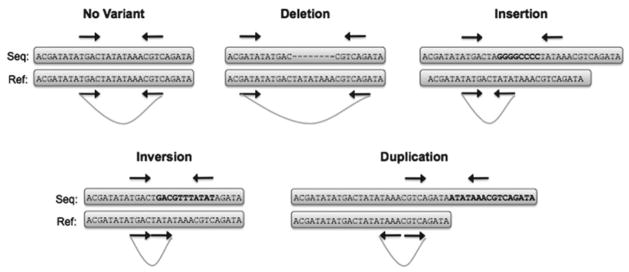
Detecting structural variants by paired-end mapping. The distance between and relative orientation of associated read pairs suggests specific classes of SVs. Deletions produce reads that map more distant from one another than expected while insertions have the opposite effect. Read pairs spanning breakpoints of inversions and duplications have altered distance and orientation while read pairs spanning translocations (not shown) will map to different chromosomes.
3.3.1. Geometric Analysis
Raphael et al. (34) have introduced a geometric approach to the detection, classification, and comparison of SVs from sequencing data. Their method, called Geometric Analysis of Structural Variants (GASV), represents putative SVs as polygons in a plane, and employs a computational geometry algorithm to merge read pairs supporting the same event. When applied to the genomes of nine individuals already characterized for SVs, GASV provided better localization of SV breakpoints. The authors also applied GASV to data from several cancer cell lines, and compared these results to those from normal individuals to distinguish germline and somatic variants.
3.3.2. Pindel
Pindel (35) employs a pattern growth approach to detect the breakpoints of large insertions and deletions using NGS data. First, all reads are mapped to the reference genome using SSAHA2 (25). The mapping results are examined to identify read pairs for which only one end was placed in the reference. Using the mapped location as an anchor point, Pindel splits the unmapped read into two (for deletions) or three (for insertions) fragments and attempts to map them individually to the anchored subregion of the reference genome. The maximum deletion size is a user-provided parameter that decides the size of the region that will be searched (typically 1–10,000 bp), while the maximum insertion size corresponds to read length (16 bp for 36-bp reads).
3.3.3. BreakDancer
Our group has developed a discovery pipeline for SVs that conducts de novo prediction and in silico confirmation using Illumina paired-end data. The de novo prediction program, BreakDancer (36), consists of two complementary algorithms.
The first algorithm (BreakDancerMax) identifies anomalously mapped read pairs (ARPs) whose ends are mapped in unexpected distances or orientations. It searches for genomic regions that anchor significantly more ARPs than expected by chance, and derives putative SVs from one or more regions that are interconnected by at least two ARPs. The confidence score for each SV prediction is estimated using a Poisson model that takes into consideration the number of supporting ARPs, the size of the anchoring regions, and the coverage of the genome. BreakDancerMax outputs five types of SVs: insertions, large deletions (>100 bp), inversions, intrachromosomal rearrangements, and interchromosomal translocations.
The second algorithm (BreakDancerMini) predicts small indels 10–100 bp by examining the normally mapped read pairs (NRPs) that are ignored by BreakDancerMax. It employs a Kolmogorov-Smirnov test to identify indel-containing regions and makes SV predictions using procedures similar to BreakDancerMax. Both BreakDancerMax and BreakDancerMini can be applied to a pool of DNA samples to identify common and novel variants. To further resolve breakpoints and reduce false positives, we perform de novo assembly on all predicted SVs (see Subheading 5).
3.4. Detection of Fusion Transcripts by RNA-Seq
Gene fusion events that result from chromosomal rearrangements are a common form of somatic mutation in human cancers (37). Massively parallel sequencing of cDNA libraries, or RNA-Seq, enables the identification of gene fusions despite the high background of abundant housekeeping genes. Maher et al. (38) developed pipeline for gene fusion discovery that utilizes data from two NGS platforms: long fragment-end reads from the Roche/454 platform and short paired-end reads from the Illumina GAII platform. This hybrid approach proved a powerful system for gene fusion discovery by transcriptomes sequencing, as exemplified by the detection of multiple gene fusions in cancer cell lines and tissues. Levin et al. (39) applied targeted RNA-Seq to 467 cancer-related genes in K-562, a well-characterized chronic myeloid leukemia (CML) cell line. Using paired-end Illumina sequencing, they identified the known BCR-ABL fusion transcript as well as several novel gene fusions.
3.5. Visualization
Although many methods for SV detection have been published for NGS data, there remains a paucity of tools for visualizing predicted SVs in the context of supporting data and relevant genome annotations.
3.5.1. Integrative Genomics Viewer and Savant
The Integrated Genomics Viewer (IGV, http://www.broadinstitute.org/igv) is a BAM-driven visualization tool for NGS data that displays read depth at each position, and color-codes reads according to the chromosome of their mate pairs; as such, it can be used to infer translocations and SNP/indel variants. The Savant Genome Browser ((40), http://www.compbio.cs.toronto.edu/savant) offers similar features, but also provides a novel representation of paired end reads to assist the identification of structural variation.
3.5.2. LookSeq and Circos
The Web-based application LookSeq (41) offers visualization of NGS data by sorting paired reads according to insert size; apparent valleys and peaks in the visualization indicate insertions and deletions, respectively. Currently, LookSeq does not support the visualization of other SVs, such as translocations and inversions. These variants (along with insertions and deletions) can be visualized using the circular graphing tool Circos (42), but require preformatting by the user.
3.5.3. Pairoscope
We recently developed a visualization tool (Pairoscope, http://www.pairoscope.sourceforge.net) to display inversions, duplications, and translocations detected in NGS data. Pairoscope accepts standard sequence BAM format files as input, as well as an “annotation BAM” file containing gene/transcript information. Using mate-pair information embedded in the sequence BAM file, Pairoscope generates three plots for each region that is requested (Fig. 3). First, it displays an auto-scaled graph of read depth per base to show the sequencing coverage across the region. SVs associated with copy number changes (insertions, deletions, and duplications) are indicated by changes in read depth. Second, Pairoscope plots a “bar-code” graph indicating the aberrantly mapped read pairs in the region. Each aberrant read is represented as a vertical bar, color-coded by aberration class. If both reads in a pair are present in the region, they are linked by a line arc. When visualized in Pairoscope, translocations are apparent as a series of mate-pair arcs linking the regions of two separate chromosomes. Inversions are apparent as two separate clusters of arcs at the breakpoints of the inverted sequence whose colors indicate aberrant orientation of read pairs. Because mapping quality can play a large part in determining the veracity of an SV prediction, Pairoscope allows the user to filter displayed read pairs according to mapping quality. Third, Pairoscope displays exon information for a region of interest. The required input is an annotation BAM file with custom tags indicating transcript-specific information. By displaying predicted SVs in the context of protein-coding genes, Pairoscope allows for the analysis and interpretation of how variants may affect gene structure. This feature is particularly valuable for identifying translocations that create fusion genes, which are prevalent in many cancers (43).
Fig. 3.

Pairoscope graph of predicted inversion and translocation. The top two tracks show the read depth for these regions. The second two show color-coded read pairs indicating the orientation of abnormal read pairs. Single bars in yellow represent reads whose mate did not map. The cyan arcs support a translocation between chromosomes 1 and 4. The red and blue arcs indicate reads oriented in a forward–forward and reverse–reverse orientation, respectively. The gene model shown in the last track indicate this translocation occurs upstream of the translocation start site of an open reading frame.
4. Conclusions
In summary, NGS technologies have become powerful tools for the characterization of copy number and structural variation in human genomes. Sequence-based detection of CNV and SV is particularly appealing for tumor genomes. Somatic rearrangements resulting in fusion genes (e.g., BCR-ABL) are both common to many tumor types, and promising as candidates for targeted therapy. Ambitious efforts like the Cancer Genome Atlas project (TCGA) will sequence hundreds of tumor genomes in the coming years; detection of somatic structural and copy number alterations in such datasets will be critical for characterizing the full set of acquired genetic changes underlying tumor development and growth.
As the throughput and number of NGS platforms continues to grow, so too does the set of tools for sequence alignment, variant detection, de novo assembly, visualization of high-throughput sequencing data. These and other analysis tools, in conjunction with the availability of hundreds or thousands of individual genome sequences, will undoubtedly shed light on the full spectrum of genetic variation in humans, from single base changes (SNPs) to structural events spanning millions of base pairs.
Acknowledgments
We thank John Wallis for insightful discussions on structural variant analysis. We are also grateful for the support of the medical genomics, analysis pipeline, and technology development groups of the Genome Institute at Washington University in St. Louis.
Footnotes
Mapping reads to a reference genome represents the critical first step in analyzing NGS data. Yet when aligning short sequences of imperfect quality to large reference genomes, it is important to realize that a considerable fraction of reads maps incorrectly or not at all. While longer read lengths (~75–100 bp) and read pairing information will help address this issue, the improvements will be marginal. Currently, as many as 5–15% of reads from a high quality paired-end sequencing run cannot be uniquely mapped to the human genome. An obvious approach to improving read alignment rates is to use a more sensitive aligner, such as Novoalign for Illumina data or SHRiMP (http://www.compbio.cs.toronto.edu/shrimp) for ABI SOLiD data. Unfortunately, more sensitive aligners also increase computational load and execution time. A better solution might be a two-step mapping strategy, in which a fast aligner (Bowtie or BWA) quickly places 70–80% of reads in a dataset, and then a more sensitive aligner is applied to the remaining unplaced reads. The output of most aligners can be converted to SAM/BAM format and merged together using SAMtools (http://www.samtools.sourceforge.net).
Reads that map incorrectly to the reference sequence are a more difficult and potentially more worrisome problem to address. Many aligners now provide a “mapping quality” score, a log-scaled numerical representation of the confidence that a read is correctly mapped. Filtering reads by mapping quality may remove alignment-related artifacts. In our experience with Illumina data, 45 and 70 make good cutoffs for BWA and Maq, respectively. Another approach to remove misaligned reads prior to SV detection is to identify and remove troublesome regions of the reference sequence, such as centromeres, telomeres, and regions enriched for tandem duplications. The disadvantage of this approach, of course, is that such regions are often enriched for structural variation (28, 44).
CNV detection using read depth (RD) and SV detection with PEM each have different advantages and limitations. RD-based methods can utilize both fragment-end and paired-end data to infer CNVs, and often detect certain classes of SV – segmental duplications, for example – that are refractory to PEM. In contrast, PEM approaches can identify copy-number-neutral events (e.g., inversions) and novel insertions to the reference genome that would be missed by RD approaches alone. Both approaches are limited in their ability to characterize variation in highly repetitive regions, where short reads cannot be uniquely mapped with high accuracy. Ultimately, a combined approach of RD and PEM methods yields the most comprehensive information about structural variation in a sequenced genome.
While traditional ESP approaches have the advantage of sequencing an entire clone to resolve complex structural events, they are also costly and labor-intensive compared to massively parallel sequencing. As the range of available insert sizes for paired-end sequencing (250 bp–3 kbp) continues to grow, so too does the sensitivity for SVs. Currently, as many as 90% of large deletions detected by ESP of BACs on capillary sequencers are detectable with long insert libraries on next-generation platforms. Of course, long insert libraries typically require more input DNA, which is disadvantageous when samples are in limited supply. This practical reality, combined with statistical analyses of the contributions of various insert sizes to SV detection, suggest that a combined library approach of small and large insert sizes offers the greatest probability of resolving SVs on NGS platforms (6).
Some classes of SVs, such as inversions and translocations, are more difficult to detect and validate using current technologies. Furthermore, studies of structural variation in humans have shown that SV events are enriched near duplicated or repetitive regions of the human genome (28, 44) that are refractory to accurate mapping of short NGS reads. Detecting these variants with high specificity require further analysis and filtering.
To remove false positives from alignment artifacts, and to precisely define the breakpoints of predicted SVs, we perform de novo assembly of all read pairs that have at least one end mapped to the predicted intervals. Our internally developed short read assembler TIGRA (Chen et al. unpublished) returns the exact locations of SVs and the nucleotide sequences that span each SV’s breakpoint(s). TIGRA has achieved confirmation rates as high as 93%.
Validating SVs predicted by NGS is a necessary step, but can be difficult because these variants are often flanked by repetitive sequence and encompass hundreds or thousands of base pairs. The first phase of the Human Genome Structural Variation (HGSV) Project (28), while reliant on traditional ESP approaches, employed multiple validation strategies that are suitable for SVs predicted from NGS data.
First, discordant fosmids whose apparent insert sizes suggested the presence of underlying SV were subjected to four complete restriction digests and resequenced via ESP. In NGS, this is analogous to sequencing multiple paired-end libraries with varying insert sizes, an approach which statistical theory suggests is most likely to resolve SV breakpoints (6).
A second validation strategy is to design custom high-density oligonucleotide arrays targeting specific insertions and deletions. Such custom arrays not only offer tools for validation, but also offer the opportunity to screen for validated SVs in other samples or populations. Orthogonal datasets, such as those described in Subheading 2 offer a third avenue of SV validation. High-density SNP arrays, spectral karyotyping, and even cytogenetic screens can provide evidence of large structural variants to corroborate predictions from NGS data.
References
- 1.Mardis ER. The impact of next-generation sequencing technology on genetics. Trends Genet. 2008;24(3):133–41. doi: 10.1016/j.tig.2007.12.007. [DOI] [PubMed] [Google Scholar]
- 2.Ahn SM, Kim TH, Lee S, et al. The first Korean genome sequence and analysis: full genome sequencing for a socio-ethnic group. Genome Res. 2009;19(9):1622–9. doi: 10.1101/gr.092197.109. [DOI] [PMC free article] [PubMed] [Google Scholar]
- 3.Bentley DR, Balasubramanian S, Swerdlow HP, et al. Accurate whole human genome sequencing using reversible terminator chemistry. Nature. 2008;456(7218):53–9. doi: 10.1038/nature07517. [DOI] [PMC free article] [PubMed] [Google Scholar]
- 4.Drmanac R, Sparks AB, Callow MJ, et al. Human genome sequencing using unchained base reads on self-assembling DNA nanoarrays. Science. 327(5961):78–81. doi: 10.1126/science.1181498. [DOI] [PubMed] [Google Scholar]
- 5.Kim JI, Ju YS, Park H, et al. A highly annotated whole-genome sequence of a Korean individual. Nature. 2009;460(7258):1011–5. doi: 10.1038/nature08211. [DOI] [PMC free article] [PubMed] [Google Scholar]
- 6.McKernan KJ, Peckham HE, Costa GL, et al. Sequence and structural variation in a human genome uncovered by short-read, massively parallel ligation sequencing using two-base encoding. Genome Res. 2009;19(9):1527–41. doi: 10.1101/gr.091868.109. [DOI] [PMC free article] [PubMed] [Google Scholar]
- 7.Pushkarev D, Neff NF, Quake SR. Single-molecule sequencing of an individual human genome. Nat Biotechnol. 2009;27(9):847–52. doi: 10.1038/nbt.1561. [DOI] [PMC free article] [PubMed] [Google Scholar]
- 8.Wang J, Wang W, Li R, et al. The diploid genome sequence of an Asian individual. Nature. 2008;456(7218):60–5. doi: 10.1038/nature07484. [DOI] [PMC free article] [PubMed] [Google Scholar]
- 9.Wheeler DA, Srinivasan M, Egholm M, et al. The complete genome of an individual by massively parallel DNA sequencing. Nature. 2008;452(7189):872–6. doi: 10.1038/nature06884. [DOI] [PubMed] [Google Scholar]
- 10.Volik S, Zhao S, Chin K, et al. End-sequence profiling: sequence-based analysis of aberrant genomes. Proc Natl Acad Sci U S A. 2003;100(13):7696–701. doi: 10.1073/pnas.1232418100. [DOI] [PMC free article] [PubMed] [Google Scholar]
- 11.Raphael BJ, Volik S, Collins C, et al. Reconstructing tumor genome architectures. Bioinformatics. 2003;19(Suppl 2):ii162–71. doi: 10.1093/bioinformatics/btg1074. [DOI] [PubMed] [Google Scholar]
- 12.Tuzun E, Sharp AJ, Bailey JA, et al. Fine-scale structural variation of the human genome. Nat Genet. 2005;37(7):727–32. doi: 10.1038/ng1562. [DOI] [PubMed] [Google Scholar]
- 13.Korbel JO, Urban AE, Affourtit JP, et al. Paired-end mapping reveals extensive structural variation in the human genome. Science. 2007;318(5849):420–6. doi: 10.1126/science.1149504. [DOI] [PMC free article] [PubMed] [Google Scholar]
- 14.Campbell PJ, Stephens PJ, Pleasance ED, et al. Identification of somatically acquired rearrangements in cancer using genome-wide massively parallel paired-end sequencing. Nat Genet. 2008;40(6):722–9. doi: 10.1038/ng.128. [DOI] [PMC free article] [PubMed] [Google Scholar]
- 15.Stephens PJ, McBride DJ, Lin ML, et al. Complex landscapes of somatic rearrangement in human breast cancer genomes. Nature. 2009;462(7276):1005–10. doi: 10.1038/nature08645. [DOI] [PMC free article] [PubMed] [Google Scholar]
- 16.Pleasance ED, Stephens PJ, O’Meara S, et al. A small-cell lung cancer genome with complex signatures of tobacco exposure. Nature. 463(7278):184–90. doi: 10.1038/nature08629. [DOI] [PMC free article] [PubMed] [Google Scholar]
- 17.Pleasance ED, Cheetham RK, Stephens PJ, et al. A comprehensive catalogue of somatic mutations from a human cancer genome. Nature. 463(7278):191–6. doi: 10.1038/nature08658. [DOI] [PMC free article] [PubMed] [Google Scholar]
- 18.Margulies M, Egholm M, Altman WE, et al. Genome sequencing in microfabricated high-density picolitre reactors. Nature. 2005;437(7057):376–80. doi: 10.1038/nature03959. [DOI] [PMC free article] [PubMed] [Google Scholar]
- 19.Li H, Homer N. A survey of sequence alignment algorithms for next-generation sequencing. Brief Bioinform. doi: 10.1093/bib/bbq015. [DOI] [PMC free article] [PubMed] [Google Scholar]
- 20.Li H, Ruan J, Durbin R. Mapping short DNA sequencing reads and calling variants using mapping quality scores. Genome Res. 2008;18(11):1851–8. doi: 10.1101/gr.078212.108. [DOI] [PMC free article] [PubMed] [Google Scholar]
- 21.Li H, Durbin R. Fast and accurate short read alignment with Burrows-Wheeler transform. Bioinformatics. 2009;25(14):1754–60. doi: 10.1093/bioinformatics/btp324. [DOI] [PMC free article] [PubMed] [Google Scholar]
- 22.Langmead B, Trapnell C, Pop M, et al. Ultrafast and memory-efficient alignment of short DNA sequences to the human genome. Genome Biol. 2009;10(3):R25. doi: 10.1186/gb-2009-10-3-r25. [DOI] [PMC free article] [PubMed] [Google Scholar]
- 23.Homer N, Merriman B, Nelson SF. BFAST: an alignment tool for large scale genome resequencing. PLoS One. 2009;4(11):e7767. doi: 10.1371/journal.pone.0007767. [DOI] [PMC free article] [PubMed] [Google Scholar]
- 24.Rumble SM, Lacroute P, Dalca AV, et al. SHRiMP: accurate mapping of short color-space reads. PLoS Comput Biol. 2009;5(5):e1000386. doi: 10.1371/journal.pcbi.1000386. [DOI] [PMC free article] [PubMed] [Google Scholar]
- 25.Ning Z, Cox AJ, Mullikin JC. SSAHA: a fast search method for large DNA databases. Genome Res. 2001;11(10):1725–9. doi: 10.1101/gr.194201. [DOI] [PMC free article] [PubMed] [Google Scholar]
- 26.Li H, Durbin R. Fast and accurate long-read alignment with Burrows-Wheeler transform. Bioinformatics. 26(5):589–95. doi: 10.1093/bioinformatics/btp698. [DOI] [PMC free article] [PubMed] [Google Scholar]
- 27.Li H, Handsaker B, Wysoker A, et al. The Sequence Alignment/Map format and SAMtools. Bioinformatics. 2009;25(16):2078–9. doi: 10.1093/bioinformatics/btp352. [DOI] [PMC free article] [PubMed] [Google Scholar]
- 28.Kidd JM, Cooper GM, Donahue WF, et al. Mapping and sequencing of structural variation from eight human genomes. Nature. 2008;453(7191):56–64. doi: 10.1038/nature06862. [DOI] [PMC free article] [PubMed] [Google Scholar]
- 29.Yoon S, Xuan Z, Makarov V, et al. Sensitive and accurate detection of copy number variants using read depth of coverage. Genome Res. 2009;19(9):1586–92. doi: 10.1101/gr.092981.109. [DOI] [PMC free article] [PubMed] [Google Scholar]
- 30.Chiang DY, Getz G, Jaffe DB, et al. High-resolution mapping of copy-number alterations with massively parallel sequencing. Nat Methods. 2009;6(1):99–103. doi: 10.1038/nmeth.1276. [DOI] [PMC free article] [PubMed] [Google Scholar]
- 31.Alkan C, Kidd JM, Marques-Bonet T, et al. Personalized copy number and segmental duplication maps using next-generation sequencing. Nat Genet. 2009;41(10):1061–7. doi: 10.1038/ng.437. [DOI] [PMC free article] [PubMed] [Google Scholar]
- 32.Koboldt DC. Short Read Aligners. Mass Genomics. 2009 http://www.massgenomics.org/short-read-aligners.
- 33.Hormozdiari F, Alkan C, Eichler EE, et al. Combinatorial algorithms for structural variation detection in high-throughput sequenced genomes. Genome Res. 2009;19(7):1270–8. doi: 10.1101/gr.088633.108. [DOI] [PMC free article] [PubMed] [Google Scholar]
- 34.Sindi S, Helman E, Bashir A, et al. A geometric approach for classification and comparison of structural variants. Bioinformatics. 2009;25(12):i222–30. doi: 10.1093/bioinformatics/btp208. [DOI] [PMC free article] [PubMed] [Google Scholar]
- 35.Ye K, Schulz MH, Long Q, et al. Pindel: a pattern growth approach to detect break points of large deletions and medium sized insertions from paired-end short reads. Bioinformatics. 2009;25(21):2865–71. doi: 10.1093/bioinformatics/btp394. [DOI] [PMC free article] [PubMed] [Google Scholar]
- 36.Chen K, Wallis JW, McLellan MD, et al. BreakDancer: an algorithm for high-resolution mapping of genomic structural variation. Nat Methods. 2009;6(9):677–81. doi: 10.1038/nmeth.1363. [DOI] [PMC free article] [PubMed] [Google Scholar]
- 37.Futreal PA, Coin L, Marshall M, et al. A census of human cancer genes. Nat Rev Cancer. 2004;4(3):177–83. doi: 10.1038/nrc1299. [DOI] [PMC free article] [PubMed] [Google Scholar]
- 38.Maher CA, Kumar-Sinha C, Cao X, et al. Transcriptome sequencing to detect gene fusions in cancer. Nature. 2009;458(7234):97–101. doi: 10.1038/nature07638. [DOI] [PMC free article] [PubMed] [Google Scholar]
- 39.Levin JZ, Berger MF, Adiconis X, et al. Targeted next-generation sequencing of a cancer transcriptome enhances detection of sequence variants and novel fusion transcripts. Genome Biol. 2009;10(10):R115. doi: 10.1186/gb-2009-10-10-r115. [DOI] [PMC free article] [PubMed] [Google Scholar]
- 40.Fiume M, Williams V, Brook A, et al. Savant: genome browser for high-throughput sequencing data. Bioinformatics. 26(16):1938–44. doi: 10.1093/bioinformatics/btq332. [DOI] [PMC free article] [PubMed] [Google Scholar]
- 41.Manske HM, Kwiatkowski DP. LookSeq: a browser-based viewer for deep sequencing data. Genome Res. 2009;19(11):2125–32. doi: 10.1101/gr.093443.109. [DOI] [PMC free article] [PubMed] [Google Scholar]
- 42.Krzywinski M, Schein J, Birol I, et al. Circos: an information aesthetic for comparative genomics. Genome Res. 2009;19(9):1639–45. doi: 10.1101/gr.092759.109. [DOI] [PMC free article] [PubMed] [Google Scholar]
- 43.Bashir A, Volik S, Collins C, et al. Evaluation of paired-end sequencing strategies for detection of genome rearrangements in cancer. PLoS Comput Biol. 2008;4(4):e1000051. doi: 10.1371/journal.pcbi.1000051. [DOI] [PMC free article] [PubMed] [Google Scholar]
- 44.Eichler EE, Nickerson DA, Altshuler D, et al. Completing the map of human genetic variation. Nature. 2007;447(7141):161–5. doi: 10.1038/447161a. [DOI] [PMC free article] [PubMed] [Google Scholar]