Abstract
The proposed method exploits the spectral properties of tissue hemoglobin for the purpose of 3D image reconstruction of quantum dot reporter probes inside scattering tissue. It advances fluorescence tomography in such way that only a single light source with tunable wavelength selection is required for fluorescence stimulation and image reconstruction. Numerical results suggest that current planar surface imaging technology could easily be retrofitted for performing fluorescence tomography without the use of elaborate source–detector multiplexing.
Fluorescence tomography (FT) reports diseases and biological function in living small animals by using light emitting probes [1,2]. Current FT uses multiple pointlike sources that illuminate the tissue surface at different locations rs. The light propagates while being scattered and partially absorbed into tissue, and the excitation field Φx(r, rs) stimulates fluorescent probes for light emission at location r. These probes have been administered to the animal prior to imaging and are optically defined by their quantum yield η, extinction coefficient ε, and concentration c. The optical tissue properties are defined by their absorption (μa) and reduced scattering ( ) coefficients. Following excitation inside tissue, fluorescence light is measured on the tissue surface by an optical detector at position rd. Moreover, a light propagation model, F, establishes a functional relationship between the fluorescence boundary current, J+(rd), in units of photons s−1 cm−2, and the emission strength, Φx(r, rs)ηεc(r), in units of photons s−1 cm−3:
| (1) |
F is given either by the diffusion equation or by some high-order approximation to the radiative transfer equation. Finally, the unknown 3D probe concentration, c(r), inside the tissue is reconstructed by using (i) the inverse model, F−1, (ii) sets of noise-corrupted boundary measurements J+(rd), and (iii) multiple excitation fields Φx(r, rs) originating from sources at different locations rs [2].
Current FT studies have shown promising results [2], but many challenges remain in imaging instrumentation, optical probe design, and image reconstruction. For example, fluorescence measurements need to be taken for pointlike sources at different positions rs for obtaining different excitation fields Φ(r, rs). This requires complex imaging instrumentation with source–detector multiplexing, which may include either a scanning laser beam probing the tissue surface in noncontact or fiber optics in tissue contact. Moreover, most reporter probes in FT are organic dyes, which have relatively narrow excitation spectra (<100 nm) and only small Stokes shifts (<20 nm), and many emit visible light below 650 nm.
The proposed method offers a different and less cumbersome approach to how the 3D spatial distribution of fluorescent quantum dot (QD) reporter probes could be determined. Hyperspectral excitation-resolved fluorescence tomography (HEFT) uses only a single light source and exploits both the spectral properties of tissue (oxy-)hemoglobin and the broad extinction spectrum of QDs for image reconstruction. The extinction spectrum of cadmium telluride (CdTe) QDs, e.g., extends over a few hundreds of nanometers [Fig. 1(b)] [4,5] and overlaps with that particular part of the (oxy-)hemoglobin absorption spectrum between 560 and 660 nm that shows large changes in its extinction coefficient, over 3 orders of magnitude [Fig. 1(a)]. Moreover, QDs are characterized not only by broad extinction spectra, but also by narrow emission spectra extending far into the near-IR (NIR) [4,5]. Hence, NIR emitting QDs could facilitate deep tissue imaging, since only little light absorption and tissue autofluorescence is present in that spectral region. The spectral distance between emission and excitation wavelengths of QDs is not limited to relatively small Stokes shifts of organic dyes, hence providing an easy means for spectral separation of fluorescence from excitation light. The remaining part of this Letter will demonstrate an example of how QD-mediated probe concentrations could be reconstructed with HEFT.
Fig. 1.
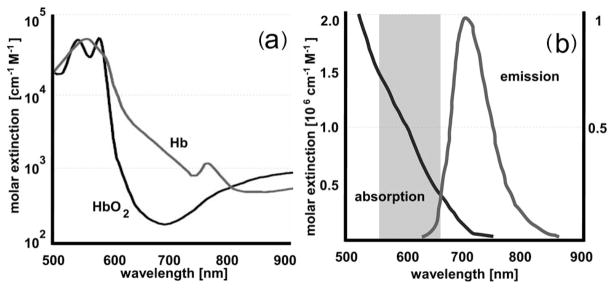
(a) Absorption spectrum of (oxy-)hemoglobin [3]. (b) Schematic of absorption and emission spectrum of CdTe quantum dots (QTracker 705, Invitrogen) [4]. The gray-shaded area in (b) is used by HEFT for fluorescence stimulation.
HEFT uses a wavelength-dependent excitation field Φx(r, λ) for image reconstruction instead of a source-dependent field Φx(r, rs). The excitation field Φx(r, λ), which stimulates QDs at position r for light emission inside tissue, is a function of (oxy-)hemoglobin absorption at wavelength λ. The emission strength, Φx(r, λ) ηεc(r), of optically stimulated QDs depends on the wavelength-dependent excitation field and, hence, will encode for the QD’s location r inside tissue. For example, Fig. 2 shows Φx(z, λ) as a function of λ along the z axis through the geometrical center of a tissue slab. At each spatial position along z, QDs will be stimulated for light emission by different excitation fields. Consequently, J+ of fluorescence light is a function of the wavelength-dependent excitation field as well:
| (2) |
Fig. 2.
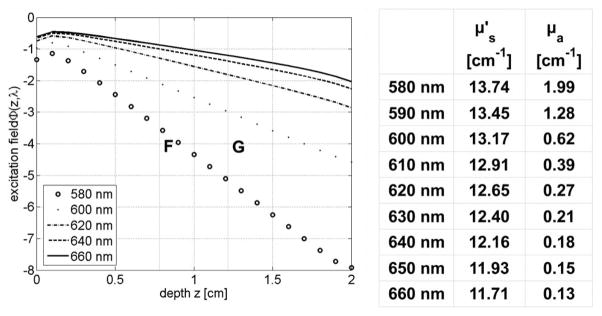
Excitation field Φx(r, λ) as a function of λ along the z-axis of a 2-cm-wide tissue slab with excitation source located at z=0. The spectral properties (μa, ) are similar to that of bowel tissue. QDs at locations F and G (see Fig. 3) experience different Φx(r, λl) for light emission.
F is given by the third-order simplified spherical harmonics (SP3) equations, which have been shown to be accurate in strongly absorbing tissue [6]. The proposed HEFT method collects fluorescence light for only a single source location but at multiple excitation wavelengths λ. This is in contrast to current FT methods, where boundary measurements of J+ are taken for multiple source locations rs and a single excitation wavelength. Hence, measurement data of the inverse source problem of HEFT are given by the set J+(rd, λ) of pairs (d, λ) of detector positions and wavelengths, instead of J+(rd, rs) with the source–detector pairs (s,d) of current methods.
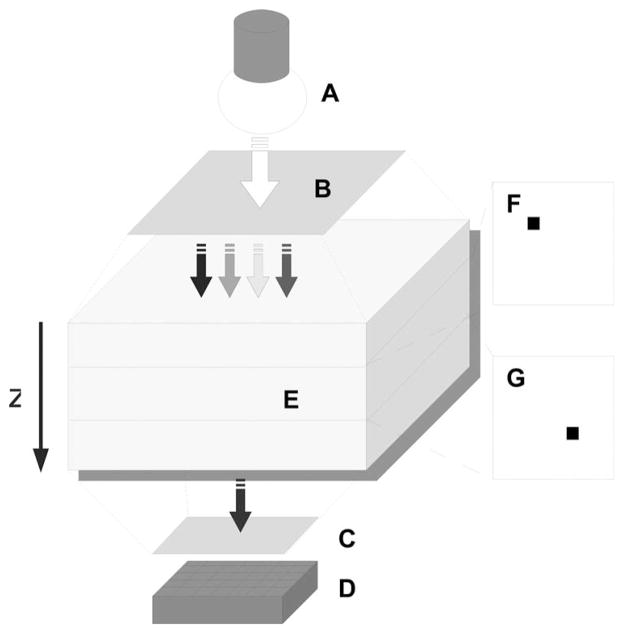
A demonstration of HEFT is given by the following numerical example mimicking an experiment with QD-based probes (Fig. 3). First, the tissue surface of a small animal will consecutively be illuminated with light at different wavelengths with bandwidth Δλ centered at λ. The source could be, e.g., a white light source with continuous spectrum (Fig. 3, A). Different λl for fluorescence stimulation will be selected between 580 and 660 nm with a tunable bandpass filter according to the largest change of (oxy-)hemoglobin extinction (Fig. 3, B). Second, a defined surface area of the small animal, e.g., the dorsal or ventral side of the animal’s torso, will be uniformly illuminated, and the fluorescence light, exiting the side opposite to the side of macroillumination, is collected with a CCD camera (Fig. 3, D). Ideally, only QDs will be used that emit in the NIR region above 680 nm. Third, at the detector side of the setup, fluorescence light will be separated from excitation light with a cutoff filter at 680 nm (Fig. 3, C). J+(rd, λ) will be measured by taking images of the fluorescence light on the tissue surface for different illumination wavelengths (Fig. 4). Following the fluorescence data acquisition, the image reconstruction is performed by solving an algebraic system of linear equations,
Fig. 3.
Schematic of HEFT with A, white-light source for fluorescence stimulation of QDs. B, wavelength selective filter for excitation; C, cutoff filter for fluorescence; D, optical detector; E, tissue model; with two fluorescent QD targets at depths (F) z=0.8 cm and (G) z=1.2 cm.
Fig. 4.
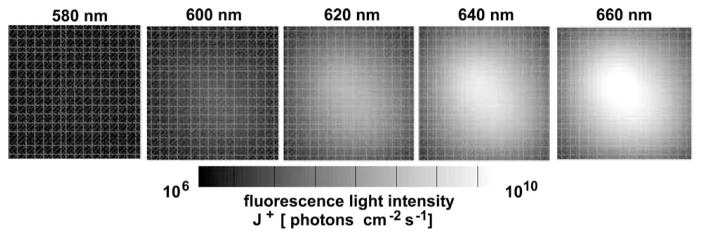
Calculated J+ of fluorescence light at the detector side of the tissue model (Fig. 3, D) for different excitation wavelengths λl.
| (3) |
with ĉ being a vector of the unknown QD concentration and Ĵ+ being a vector of the measured boundary current. The vector ĉ with components ĉm has the dimension of M voxels of the reconstruction domain that is defined on a structured Cartesian grid. Ĵ+ has N × L elements , with N being the number of detector points on the tissue surface and L being the number of excitation wavelengths. The elements of Ĵ+ are ordered as follows: . A single element A[n,l],m of the matrix A[N·L]×M is defined as the partial boundary current J+(rn) = F[Φx(rm, λl)ηε(λl)c0(rm)] at detector point rn, which is calculated by the SP3 equations for a unit concentration c0(rm) at voxel rm and excitation wavelength λl. The system (3) is iteratively solved for ĉ with an expectation-maximization method, and solutions are displayed as tomographic images.
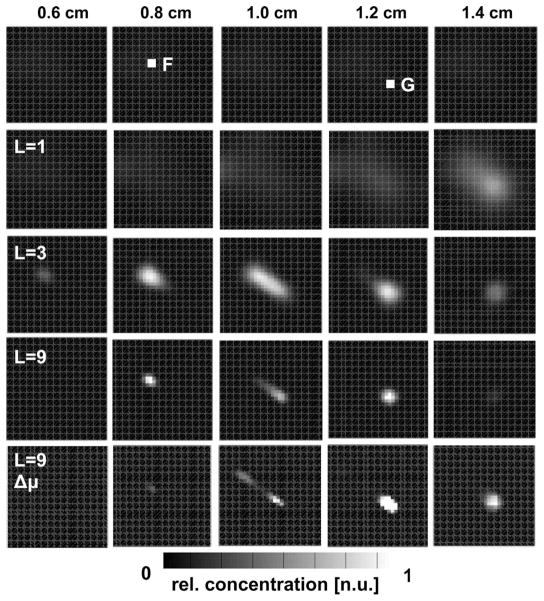
A numerical tissue model with size of 3 cm×3 cm ×2 cm was used for demonstrating the performance of HEFT. Two fluorescent targets (0.2 cm × 0.2 cm × 0.2 cm) were placed inside the model with different depths of z=0.8 cm and z=1.2 cm measured from the top plane (Fig. 3, F, G). Fluorophore properties were chosen to be similar to those of QTracker 705 (Invitrogen) QDs as shown in Fig. 1 [4]. The top side of the tissue model was uniformly illuminated with light of either L=1, L=3, or L=9 different wavelength intervals between 575 and 665 nm separated by Δλ =10 nm. J+ at 705 nm was calculated for different L at 64 detector points on the bottom side of the model. 5% Gaussian noise was added to J+, yielding synthetic measurement data. Figure 4 shows images of J+ at the bottom plane of the model for five different λ. The QD concentration was reconstructed on the Cartesian grid with M=20,181 grid points, given 64 × 1, 64 × 3, or 64 × 9 (N × L) measurement points. Figure 5 shows the reconstruction results of c for five planes (depths of 0.6, 0.8, 1.0, 1.2, and 1.4 cm) and different numbers (L=1,3,9) of wavelengths. Best results are obtained for the largest number (L=9) of available wavelengths. Both fluorescent targets F and G can be resolved. The bottom row in Fig. 5 shows the impact of not exactly known μa on the image reconstruction.
Fig. 5.
Image reconstructions of relative QD concentration for different depths z measured from the top plane of the tissue model. Reconstructions were performed for different sets of λl. L=1, 660 nm; L=3; 660–640 nm; L=9; 660–580 nm. Δμ: μa for image reconstruction was altered by 30% from the original μa.
In conclusion, the proposed HEFT method, applicable only to fluorophores with broad extinction spectra, is an alternative approach for reconstructing fluorescent probes in scattering tissue. It exploits the broad extinction spectrum of QDs and the large change of tissue absorption for image reconstruction. HEFT strictly simplifies the measurement process because its single light source does not rely on complex fiber optics, source arrays, diode lasers, or optical switches for source–detector multiplexing. HEFT is not only an inexpensive alternative to current FT, but also existing planar imaging technology could readily be retrofitted for FT by adding only wavelength-selective macroillumination. The proposed method still needs to be tested against experimental data, and concerns regarding the signal-to-noise ratio in strong-absorbing tissue will need to be studied. Furthermore, limited knowledge of correct optical parameters in nonuniform tissue and possible signal bleed through due to autofluorescence may lead to inaccurate source reconstructions and, thus, is subject to further investigation.
Acknowledgments
This work was supported in part by grants NCI-4R33CA118666 and NCI-U54CA126513-039001 by the National Institutes of Health (NIH).
References
- 1.Rao J, Dragulescu-Andrasi A, Yao H. Curr Opin Biotechnol. 2007;18:17. doi: 10.1016/j.copbio.2007.01.003. [DOI] [PubMed] [Google Scholar]
- 2.Ntziachristos V. Annu Rev Biomed Eng. 2006;8:1. doi: 10.1146/annurev.bioeng.8.061505.095831. [DOI] [PubMed] [Google Scholar]
- 3.Prahl SA. http://omlc.ogi.edu/spectra/hemoglobin/index.html.
- 4.Lin S, Xie X, Patel MR, Yang YH, Li Z, Cao F, Gheysens O, Zhang Y, Gambhir SS, Rao JH, Wu JC. BMC Biotechnol. 2007;7:67. doi: 10.1186/1472-6750-7-67. [DOI] [PMC free article] [PubMed] [Google Scholar]
- 5.Michalet X, Pinaud FF, Bentolila LA, Tsay JM, Doose S, Li JJ, Sundaresan G, Wu AM, Gambhir SS, Weiss S. Science. 2005;307:538. doi: 10.1126/science.1104274. [DOI] [PMC free article] [PubMed] [Google Scholar]
- 6.Klose AD, Larsen EW. J Comp Physics. 2006;220:441. [Google Scholar]


