

Abstract
Rationale and Objectives
Characterization of smoking-related lung disease typically consists of visual assessment of chest computed tomographic (CT) images for the presence and extent of emphysema and centrilobular nodularity (CN). Quantitative analysis of emphysema and CN may improve the accuracy, reproducibility, and efficiency of chest CT scoring. The purpose of this study was to develop a fully automated texture-based system for the detection and quantification of centrilobular emphysema (CLE) and CN in chest CT images.
Materials and Methods
A novel approach was used to prepare regions of interest (ROIs) within the lung parenchyma for representation by texture features associated with the gray-level run-length and gray-level gap-length methods. These texture features were used to train a multiple logistic regression classifier to discriminate between normal lung tissue, CN or “smoker’s lung,” and CLE. This classifier was trained and evaluated on 24 and 71 chest CT scans, respectively.
Results
During training, the classifier correctly classified 89% of ROIs depicting normal lung tissue, 74% of ROIs depicting CN, and 95% of ROIs manifesting CLE. When the performance of the classifier in quantifying extent of CN and CLE was evaluated on 71 chest CT scans, 65% of ROIs in smokers without CLE were classified as CN, compared to 31% in nonsmokers (P < .001) and 28% in smokers with CLE (P < .001).
Conclusions
The texture-based framework described herein facilitates successful discrimination among normal lung tissue, CN, and CLE and can be used for the automated quantification of smoking-related lung disease.
Keywords: Emphysema, centrilobular nodularity, computer-aided diagnosis, texture analysis
Chronic obstructive pulmonary disease (COPD), the third leading cause of death in the United States (1), is a chronic lung disease strongly associated with smoking. COPD comprises both large-airway and small-airway disease and emphysema, which is characterized by the progressive destruction of alveolar walls in lung tissue. Emphysema is visible on computed tomographic (CT) images as areas with low attenuation values similar to the density of air. Centrilobular nodularity (CN) or respiratory bronchiolitis (“smoker’s lung”), which is thought to be the earliest manifestation of smoking-related lung injury, manifests as multiple centrilobular nodules <3 mm in size centered in the pulmonary lobule (2–4). The presence and extent of emphysema and CN are typically assessed by radiologists for the characterization of smoking-related lung disease.
Currently, the reference standard for the evaluation of disease extent on CT imaging is visual examination. However, visual assessment of CT images for quantifying and staging COPD is limited by high interobserver variability (5). For instance, at the Genetic Epidemiology of COPD (COPDGene) Study CT Imaging Workshop that took place in February 2010, 51 pulmonologists and radiologists reviewed 395 CT scans, each of which was evaluated by nine to 11 reviewers. Average κ values for the detection of CN and the quantification of centrilobular emphysema (CLE) by readers were 0.12 and 0.33, respectively (6). These poor κ values suggest that the visual detection and quantification of CN and CLE are limited by readers’ subjectivity. A second limitation of visual assessment is the time and expense involved. Especially in large-scale projects such as the COPDGene Study (10,500 subjects from 21 different academic centers), visual evaluation of thousands of scans can be prohibitively time consuming and costly.
In contrast to visual assessment, the automated quantification of emphysema provides objectivity and reproducibility. Many computerized methods for the quantification of emphysema involve densitometry. They rely on a fixed threshold, typically in the range of −856 to −960 Hounsfield units (HU); voxels and low-attenuation areas (LAAs) with attenuation values below the threshold are identified as emphysema (7–13). Although these automated methods overcome the problem of interobserver variability, they are limited by partial volume effects and differences in scanner models. Because mean attenuation levels vary for different scanner models and image reconstruction methods, the quantification of emphysema using density measures is subject to noise, level of inspiration, reconstruction filter, and scanner model (14–17). Moreover, because multicenter studies such as the COPDGene Study rely on CT scans obtained using a diversity of scanners, it is unclear what threshold these studies should use to define emphysema or if scanner-dependent corrections should be applied.
The quantification of emphysema on the basis of texture, which considers spatial relationships between pixel intensity values rather than the density values alone, may be more independent of imaging protocol than density-based quantification. Furthermore, texture-based quantification of emphysema may correlate more strongly with visual scores than densitometry, because radiologists consider how LAAs are spatially arranged in the lung in their evaluations (18). Texture features have been used to differentiate between abnormal parenchymal textures (17,19–21) and to perform differential diagnosis of pulmonary disorders (22–25), and several studies have used texture analysis for objective characterization of emphysema (25–29). These studies evaluated texture features obtained using the adaptive multiple-feature method (25–27) or local binary patterns (28).
Although texture analysis has been used for the characterization and quantification of emphysema, automated quantification of CN and “smoker’s lung” has not been studied. Although CN is often not associated with pulmonary impairment, it is an important marker of cigarette smoke exposure and therefore may be important in assessing risk for lung cancer. Nevertheless, densitometric methods cannot differentiate between normal lung and CN, because smokers with CN (respiratory bronchiolitis) may have overall normal lung density measurements. Density-based algorithms can detect LAAs in the lungs of subjects with emphysema, but not the conglomerate extent or pattern of alveolar wall destruction. Nevertheless, smoking-related lung disease constitutes both emphysema and CN, two distinct smoking-related conditions that do not necessarily manifest in parallel. Thus, proper quantification of smoking-related lung disease necessitates the automated detection of CN in smokers who have little or no emphysema and accurate discrimination between CN and normal lung.
The purpose of this study was to use clinically relevant texture features to detect and quantify CN and CLE in CT images. The automated system that we have developed for computer-aided diagnosis of smoking-related lung disease integrates texture features associated with the gray-level run-length (GLRL) and gray-level gap-length (GLGL) methods. Regions of interest (ROIs) within the parenchyma are represented by texture features belonging to the GLRL and GLGL methods, which are used to train a classifier to differentiate among normal lung, CN or “smoker’s lung,” and CLE. This classifier, in turn, is used to classify full-chest CT scans on a per ROI basis and to quantify the extent of CN and CLE present on a CT scan. To evaluate the performance of the texture-based classification system, we compared our method with both density-based quantification and visual assessment of 71 CT scans from the COPDGene Study cohort.
MATERIALS AND METHODS
Data Description
Study population
Chest CT scans were obtained from the multicenter COPDGene Study, a cross-sectional study approved by the institutional review board of each of the participating 21 clinical study centers. To date, the COPDGene Study has acquired >10,000 cases and processed >4700 of them; all image management is compliant with the Health Insurance Portability and Accountability Act. All subjects in this study were non-Hispanic whites or African Americans aged 45 to 80 years, and smokers had smoking histories of ≥10 pack-years. Subjects had no concomitant respiratory disorders other than asthma or COPD and no known or suspected lung cancer. Table 1 provides a more detailed description of the subjects from the COPDGene Study cohort included in this study.
TABLE 1.
Description of Subjects From the COPDGene Study Cohort Used in This Study
| Variable | Nonsmokers, No Emphysema
|
Smokers, No Emphysema
|
Smokers, Centrilobular Emphysema
|
|||
|---|---|---|---|---|---|---|
| Training (n = 12) | Evaluation (n = 25) | Training (n = 12) | Evaluation (n = 24) | Training (n = 12) | Evaluation (n = 22) | |
| Subject data | ||||||
| Men/women | 3/9 | 7/18 | 6/6 | 15/9 | 7/5 | 9/13 |
| Age at enrollment (y) | 61.2 ± 7.2 | 61.5 ± 8.0 | 60.2 ± 11.2 | 59.6 ± 7.8 | 64.2 ± 10.0 | 67.5 ± 7.6 |
| BMI (kg/m2) | 25.5 ± 3.1 | 28.6 ± 5.8 | 30.0 ± 5.3 | 32.9 ± 5.9 | 29.7 ± 7.4 | 26.0 ± 5.2 |
| Smoking history | ||||||
| Start age (y) | NA | NA | 16.0 ± 2.0 | 17.0 ± 14.7 | 17.6 ± 7.5 | 17.7 ± 3.8 |
| Current smokers (yes/no) | NA | NA | 5/7 | 6/18 | 6/6 | 4/18 |
| Stop age (y) | NA | NA | 42.0 | 49.0 | 55.3 | 58.9 |
| Cigarettes/day | NA | NA | 21.1 ± 11.9 | 27.7 ± 14.7 | 30.3 ± 15.1 | 26.1 ± 10.7 |
| ATS pack-years | NA | NA | 31.7 ± 15.6 | 46.2 ± 29.8 | 58.3 ± 26.4 | 54.1 ± 25.1 |
| CT scanner | ||||||
| Siemens/GE | 11 (2)/1 | 21 (4)/4 | 9 (2)/3 (2) | 18 (3)/6 (2) | 9 (2)/3 (2) | 19 (3)/3 (2) |
| Number of study centers | 5 | 6 | 5 | 9 | 6 | 7 |
| VIDA image processing | ||||||
| Total lung capacity (mL) | 5445 ± 852 | 5125 ± 1046 | 6103 ± 1371 | 5600 ± 1217 | 6453 ± 1738 | 5866 ± 1148 |
| % LAA* | 1.1 ± 1.1 | 1.3 ± 0.9 | 4.4 ± 3.2 | 3.5 ± 4.0 | 10.1 ± 5.1 | 17.6 ± 8.4 |
| % air trapping† | 4.6 ± 3.1 | 10.0 ± 6.3 | 16.4 ± 13.6 | 11.5 ± 7.1 | 26.1 ± 11.4 | 41.4 ± 16.8 |
ATS, American Thoracic Society; BMI, body mass index; COPDGene, Genetic Epidemiology of COPD; CT, computed tomographic; LAA, low-attenuation area; NA, not applicable.
Data are expressed as mean ± standard deviation or as numbers.
Computed as percentage voxels ≤−950 Hounsfield units on inspiratory CT scans.
Calculated as percentage voxels ≤−856 Hounsfield units on expiratory CT scans.
Image acquisition
All subjects underwent volumetric chest CT imaging at full inspiration. CT scans were reconstructed with slice thicknesses of 0.625, 0.75, or 0.9 mm depending on the CT scanner manufacturer; corresponding slice intervals were 0.625, 0.5, and 0.45 mm, respectively, to achieve near isotropic voxels among manufacturers. Six scanner models (either Siemens Healthcare, Erlangen, Germany, or GE Healthcare, Milwaukee, WI) were used in the study: one 16-slice model and five 64-slice multidetector CT models. Scans were acquired at 200 mAs and 120 kVp. Depending on the manufacturer, standard, B31f, or B reconstruction kernels were used to achieve medium smooth images. All scans underwent quality assurance by a trained research analyst to ensure compliance with study protocol, adequacy of inspiration, inclusion of all parts of the chest, and absence of motion artifact. More details regarding CT protocols are provided in the supplementary materials of the study design paper for the COPDGene Study (30,31).
Image processing
Automated segmentation of the right and left lungs from the chest wall and mediastinum was performed on all CT scans using Pulmonary Workstation Plus (VIDA Diagnostics, Inc, Coralville, IA). For comparison to the texture-based technique, the density mask technique was used to quantify percentage LAA, calculated as percentage lung voxels ≤−950 HU.
Radiologist assessment
The majority of cases used in this study were analyzed visually by radiologists and pulmonologists at the COPDGene Study CT Imaging Workshop, which took place at the American College of Radiology Education Center in Reston, Virginia, in February 2010. Chest CT scans analyzed at this workshop included scans obtained from 50 normal nonsmoking controls, 50 smokers without evidence of COPD by Global Initiative for Chronic Obstructive Lung Disease (GOLD) criteria, and 50 smokers with COPD from each of GOLD stages 1, 2, 3, and 4. (The GOLD criteria identify five stages of COPD severity. Stage 0 is characterized by the presence of symptoms of breathlessness without airflow obstruction, and stages 1 through 4 are characterized by progressively more severe airflow obstruction [32].).
For each of these cases, nine to 11 workshop participants independently recorded the extent of emphysema above the carina, between the carina and inferior pulmonary veins, and below the inferior pulmonary veins according to a six-point scale: absent, <5%, 5% to 25%, 25% to 50%, 50% to 75%, and >75%. Cases associated with <75% agreement on emphysema extent among those who read the scans were excluded from this study. Because of insufficient supply of CLE cases with ≥75% agreement at the CT Imaging Workshop, workshop cases were supplemented by additional scans obtained from the COPDGene Study. These scans were assessed as CLE by the initial reading radiologist, with confirmatory read by an expert radiologist (J.D.S.) to ensure the presence of CLE.
Overview of Methodology
The proposed system for the quantification of CLE and CN, which is based on classifying textures in local ROIs within the CT images, comprises multiple steps. First, the ROI undergoes a preprocessing step that highlights patterns of interest and deemphasizes unimportant texture elements in the ROI. Then the GLRL and GLGL methods operate on the ROI, quantifying properties of LAAs and generating a series of 22 statistics that describe the distribution of LAAs within the ROI. Finally, these statistics are used in a multiple logistic regression classifier to classify the ROI as (1) normal lung, (2) manifesting CN or “smoker’s lung,” or (3) CLE. A summary of our methodology is illustrated in Figure 1.
Figure 1.

Summary of proposed method for quantification of centrilobular emphysema and centrilobular nodularity. ROI, region of interest.
ROI Preprocessing
For densitometric purposes, emphysema can be defined as areas with intensity lower than a given threshold. This threshold is typically in the range between −856 and −960 HU (28). Because the textures that are important for emphysema quantification are characterized by intensity variations in a limited range of intensities, we hypothesized that highlighting the textures present in the “emphysema” range of intensity values while deemphasizing other ranges of gray levels may enhance texture analysis. Emphasizing the “emphysema” range entails two steps: (1) windowing and (2) binning the intensities to just a few pixel values.
To evaluate what thresholds to use in defining this “emphysema” range, we consider four different intensity windows: −1024 to −950 HU, −1024 to −856 HU, −950 to −856 HU, and the range between the minimum and maximum values present in the lung mask. Our motivation for selecting these particular ranges of intensity values is as follows. We consider the range between −1024 and −950 HU as a potential “emphysema” window because −950 HU has been shown to be the most valid threshold for defining emphysema (33). Furthermore, for evaluation purposes, we compare the results of the automated texture-based approach with densitometric results using −950 HU as a threshold to define emphysema. Nevertheless, although a threshold of −950 HU may be sufficient to detect many cases of emphysema, it has been shown that a threshold of −856 HU is needed to detect milder forms of emphysema (34). Therefore, the range between −1024 and −856 HU is also considered a potential “emphysema” window. The range between −950 and −856 HU is where differences between CN and emphysema may be found. Consequently, we hypothesized that this range would facilitate discrimination between emphysema and CN.
In addition to these three intensity ranges, we also consider the range between the minimum and maximum values present in the segmented lung. This is because attenuation levels may vary significantly for different scanner models, so using a fixed threshold to define emphysema may not be ideal. This intensity range, although not specifically an “emphysema” range, is considered because it may be more robust to variability due to scanner model than predetermined thresholds.
Given an intensity window, the next step in emphasizing emphysematous textures is binning the intensities that fall within this window to only eight pixel values, or bins. Let Il be the lowest intensity value in the window and Ih the highest intensity value in the window. Intensity values in the image A are binned according to the following rule to generate the binned image B:
| (1) |
This rule maps all intensity values below Il to 1, intensity values above Ih to 8, and intensity values in the range (Il, Ih) to values between 1 and 8. Binning the pixel attenuation values in each ROI to only eight gray levels significantly reduces computation time while enabling meaningful information to be extracted via the GLRL and GLGL methods. Figure 2 illustrates how binning the intensity values using the four different intensity windows leads to the emphasis of different textural artifacts in the ROIs.
Figure 2.
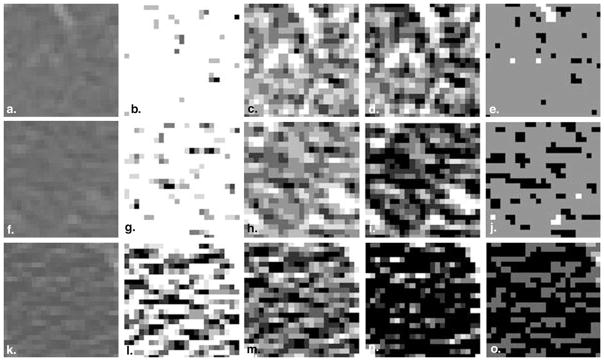
Representative regions of interest from (a) a scan of a normal subject with no emphysema, (f) a scan of a smoker with no emphysema, and (k) a scan of a subject with centrilobular emphysema binned between −1024 and −950 Hounsfield units (HU) (column 2), between −1024 and −856 HU (column 3), between −950 and −856 HU (column 4), and between the minimum and maximum gray levels in the parenchyma (column 5).
Texture Analysis
We extract two types of texture features from the ROIs: GLRL and GLGL features. Some of the GLRL features are common to the adaptive multiple-feature method, which has been used in differentiating pulmonary disorders (20,24–27) and in emphysema quantification (28,29). The combination of gap-length and run-length features, which inherently complement each other, provides textural description of the distribution of LAAs in the lung.
GLRL method
The GLRL method (35) considers the size, orientation, and attenuation value of texture elements in an image. The GLRL method comprises two primary steps: (1) cataloging in histograms all runs in an image, as well as their associated sizes, orientations, and attenuation values, and (2) computing statistics from these histograms. The GLRL method is used here to summarize various texture properties, such as size, attenuation level, and distribution, of LAAs, by 11 texture features (see Table 2).
TABLE 2.
Gray-level Run-length and Gap-length Features Used for Texture Analysis
| Run-length Features | Formula | Gap-length Features | Formula | ||
|---|---|---|---|---|---|
| Average run length |
|
Average gap length |
|
||
| Average gray level |
|
Average gray level |
|
||
| Short run emphasis |
|
Short gap emphasis |
|
||
| Long run emphasis |
|
Long gap emphasis |
|
||
| Bright color emphasis |
|
Bright color emphasis |
|
||
| Dark color emphasis |
|
Dark color emphasis |
|
||
| Gray-level nonuniformity |
|
Gray level nonuniformity |
|
||
| Run-length nonuniformity |
|
Gap-length nonuniformity |
|
||
| Gray-level distribution |
|
Gray-level distribution |
|
||
| Run-length distribution |
|
Gap-length distribution |
|
||
| Run percentage |
|
Gap percentage |
|
R and G are the run-length and gap-length matrices, respectively; Nr and Ng represent the numbers of run and gap lengths considered, respectively; Nl is the number of gray levels in the binned image; and n is the number of pixels in the image or region of interest.
GLGL method
Whereas the GLRL method concerns itself with runs in an image, the GLGL method (36) considers the size, orientation, and attenuation value of gaps in an image. Thus, the GLGL method neatly complements the GLRL method. Like the GLRL method, the GLGL method entails computing histograms of all gaps in an image, as well as their associated sizes, orientations, and attenuation values, and then calculating statistics from these histograms. Because emphysematous lung manifests as LAAs, which are essentially “gaps” in the lung parenchyma, the GLGL method summarizes textural properties of LAAs by 11 texture features (see Table 2).
Classification
The 22 run-length and gap-length features are used to classify ROIs into three classes: normal, CN, and CLE. We use a multiple logistic regression classifier (37) because its performance is on par with popular nonparametric classifiers such as support vector machines (results not shown). Additionally, logistic regression is commonly used in biologic applications to model multinomial outcomes because the resulting models are easily interpretable.
Statistical Analysis
Difference in percentage normal lung, CN, and CLE by study group was assessed using Kruskal-Wallis one-way analysis of variance. Differences in medians were compared because these data were not normally distributed, with unequal variances. To isolate differences between groups, Dunn’s test was performed with nonsmoking controls as the reference comparison group.
Experiments
Phase 1: Training
The primary objective of the experiments performed during the training phase was to identify the intensity window that provides the best discrimination between lung textures present in normal subjects with no emphysema (NNE), smokers with no emphysema (SNE), and subjects with CLE. In total, 12 NNE cases, 12 SNE cases, and 12 CLE cases were selected for training (see Table 1). Of these scans, all NNE and SNE scans and eight CLE scans were obtained from the CT Imaging Workshop (agreement ≥75%). An expert chest radiologist (J.D.S.) manually selected nonoverlapping circular ROIs of 35 pixels in diameter representing normal tissue in the NNE scans, CN in the SNE scans, and emphysema in the CLE scans. These ROIs, which were chosen by visual assessment of lung regions for the presence of normal lung, CN, or emphysema, came from anywhere in the lung parenchyma. In total, 2879 ROIs were selected from the 36 cases in the training set. Of these ROIs, 46% belonged to NNE, 30% belonged to SNE, and 24% belonged to CLE classes.
For each of the four intensity windows considered in this study, every ROI in the training data set underwent the windowing operation followed by binning to eight intensity values, and the 22 run-length and gap-length features were derived from the processed ROIs. Thus, four full data sets were created: one for each intensity window under investigation. Each of these data sets was then used to train a multiple logistic regression classifier.
Because our objective was not merely to build a robust classifier but also to determine which intensity window performs best, it was important that we obtain robust, unbiased estimates of the performance of each windowing strategy. Consequently, a sixfold, randomized cross-validation procedure was used for evaluation of the four windowing strategies. Hence, for the 36 scans constituting the training set, six sets of scans, each composed of two NNE scans, two SNE scans, and two CLE scans, were constituted. During a single run of cross-validation, five sets (corresponding to 30 CT scans) were used to train the classifier, while the remaining set of six scans was used for independent testing. This process was repeated until all ROIs from all 36 scans were classified once in a single run of cross-validation. This randomized cross-validation process was used for each of the four data sets corresponding to the four windowing strategies under investigation. Classifier results were generated for each ROI from all 36 scans, and average confusion matrices were recorded for each windowing strategy. The best performing intensity window was then identifiable as the windowing strategy associated with the highest classification accuracy for all three classes.
Phase 2: Evaluation
Once the optimal windowing strategy was identified, additional experiments were performed to evaluate the performance of the texture-based classification scheme in quantifying CLE and CN in a full CT scan. First, every ROI in the training data set underwent windowing using the intensity window selected during the training phase, followed by binning to eight intensity values and extraction of the 22 texture features. Then, this full data set was used to train a multiple logistic regression classifier to accurately classify ROIs as normal lung tissue, manifesting CN, or manifesting CLE. Finally, a total of 25 NNE cases, 24 SNE cases, and 22 CLE cases were selected for testing (see Table 1). All NNE and SNE scans were obtained from the CT Imaging Workshop (agreement ≥75%), and CLE scans included eight GOLD stage 1, six GOLD stage 2, and eight GOLD stage 3 cases from the COPDGene Study.
All 71 chest CT scans in the evaluation data set underwent a series of preprocessing steps before region-by-region classification was performed (see Fig 1). First, the lungs were segmented using Pulmonary Workstation Plus. Then a subset of the pixels within the parenchyma was automatically selected. The purpose of selecting only a subset of pixels for classification was simply to reduce computational load, because the chest CT scans analyzed here have as many as 50 million to 100 million pixels contained within the lung parenchyma. Hence, rather than providing classification results on a per pixel basis, classifier results were acquired for every 10 × 10 × 10 pixel cube fully contained in the lung parenchyma. Thus, for every 10 × 10 × 10 pixel cube, the central pixel was selected, and an ROI of 35 pixels in diameter was drawn around it. This reduced the total number of ROIs that were classified to <25,000 per CT scan.
Each of the ROIs selected for classification underwent windowing followed by binning to eight intensity values before the run-length and gap-length features were calculated from the processed ROI and used to classify the ROI. These ROIs were then classified by the multiple logistic regression classifier trained on the full training data set. ROIs manifesting emphysema were classified as CLE, ROIs containing CN were classified as SNE, and the remaining ROIs were classified as NNE. Class percentages, calculated as the number of classified ROIs classified to a particular class divided by the total number of ROIs in the scan, were recorded for each class.
RESULTS
Phase 1: Training
Quantitative results from classification for each of the four windowing strategies are shown in the confusions matrices in Table 3. Regardless of intensity window, the NNE and CLE classes are clearly distinguishable from each other, with <5% of ROIs being confused between these two classes. ROIs containing only normal lung tissue are correctly classified with >80% accuracy for all models.
TABLE 3.
Average Confusion Matrices Associated with Each of the Four Windowing Strategies Evaluated during the Training Phase
| Range | Classified as
|
|||
|---|---|---|---|---|
| NNE | SNE | CLE | ||
| −1024 to −950 HU | ||||
| True class | NNE | 86.2% | 13.3% | 0.5% |
| SNE | 30.0% | 65.0% | 5.0% | |
| CLE | 2.8% | 4.6% | 92.7% | |
| −1024 to −856 HU | ||||
| True class | NNE | 85.7% | 13.8% | 4.6% |
| SNE | 27.1% | 67.9% | 5.0% | |
| CLE | 1.8% | 9.2% | 89.0% | |
| −950 to −856 HU | ||||
| True class | NNE | 89.4% | 10.6% | 0.0% |
| SNE | 22.9% | 74.3% | 2.9% | |
| CLE | 0.0% | 5.5% | 94.5% | |
| Minimum to maximum | ||||
| True class | NNE | 84.3% | 14.3% | 1.4% |
| SNE | 34.3% | 57.1% | 8.6% | |
| CLE | 3.7% | 11.0% | 85.3% | |
CLE, centrilobular emphysema; HU, Hounsfield units; NNE, normal subjects with no emphysema; SNE, smokers with no emphysema.
Nevertheless, the intensity window between −950 and −856 HU provides the highest classification accuracy for all three classes, providing for correct classification of 89% of NNE ROIs, 74% of SNE ROIs, and 95% of CLE ROIs. When this intensity window is used, no misclassifications occur between CLE and NNE, and few misclassifications occur between SNE and CLE classes. Of the four windowing strategies investigated, this intensity window provides the best discrimination between NNE and SNE textures. Thus, we expect that the range between −950 and −856 HU is where differences among normal lung tissue, CN, and emphysema can be found. Consequently, this is the windowing strategy that is selected for use in phase 2, evaluation on full-chest CT scans.
Phase 2: Evaluation
The performance of the logistic regression classifier on representative chest CT scans from NNE, SNE, and CLE classes is illustrated in Figure 3. Figure 4 displays results of classification for each of the 71 chest CT scans in the evaluation data set. Quantitative classification results are shown in Table 4, which describes the distribution of ROIs in an average lung scan from each class. The multiple logistic regression classifier finds averages of only 3% and 5% of ROIs in NNE and SNE scans, respectively, to contain CLE. Percentage emphysema in CLE scans is significantly different from percentage emphysema in NNE and SNE scans (P < .001; see Fig 5a and Table 4). The amount of CN found in SNE scans is significantly more than in NNE scans (P < .001) and less than in CLE scans (P < .001), and the difference in percentage normal lung between NNE and SNE scans is also statistically significant.
Figure 3.
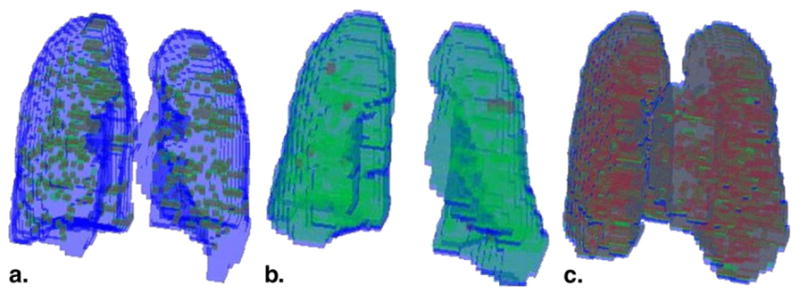
Results of classification are shown in three dimensions for (a) a scan of a normal subject with no emphysema, (b) a scan of a smoker with no emphysema, and (c) a scan of a subject with centrilobular emphysema (CLE). Regions of interest (ROIs) colored blue were classified as normal lung, green ROIs were found to contain centrilobular nodularity, and red ROIs were found to manifest CLE.
Figure 4.

Percentage of regions of interest classified as normal lung (blue), centrilobular nodularity or “smoker’s lung” (green), and centrilobular emphysema (CLE) (red) for (a) 25 normal subjects with no emphysema, (b) 24 smokers with no emphysema, and (c) 22 subjects with CLE. Gold, Global Initiative for Chronic Obstructive Lung Disease.
TABLE 4.
Average Number and Percentage of Lung Regions of Interest Classified as Normal Lung Tissue, Manifesting CN, and Manifesting CLE for Computed Tomographic Scans in the Evaluation Data Set Belonging to NNE, SNE, and CLE Classes
| Class | Normal
|
CN
|
CLE
|
|||
|---|---|---|---|---|---|---|
| n | % | n | % | n | % | |
| NNE | 9407 ± 5693 | 65.8 ± 32.8 | 3098 ± 2749 | 30.9 ± 32.9 | 459 ± 470 | 3.3 ± 3.0 |
| SNE | 3624 ± 3280 | 30.2 ± 27.5 | 7208 ± 3612 | 64.6 ± 28.0 | 762 ± 1097 | 5.2 ± 5.8 |
| CLE | 3209 ± 3389 | 20.0 ± 16.4 | 3958 ± 2179 | 27.5 ± 14.9 | 7358 ± 3802 | 51.9 ± 28.9 |
| P | <.001 | <.001 | <.001 | |||
CLE, centrilobular emphysema; CN, centrilobular nodularity; NNE, normal subjects with no emphysema; SNE, smokers with no emphysema. Data are expressed as mean ± standard deviations.
The probabilities of the null hypotheses that NNE, SNE, and CLE scans contain the same percentages of normal lung, CN, and CLE are listed in the bottom row.
Figure 5.

Percentage emphysema obtained using the texture-based method is correlated with (a) percentage low-attenuation area (LAA) computed by the density mask technique and (b) chronic obstructive pulmonary disease (COPD) Global Initiative for Chronic Obstructive Lung Disease (GOLD) stage. Black data points represent scans of normal subjects with no emphysema (NNE); cyan represents scans of smokers with no emphysema (SNE); and blue, green, and red represent GOLD stages 1, 2, and 3, respectively. The differences in percentage emphysema computed using the texture-based method were statistically significant (P < .001) by analysis of variance. SNE scans were not statistically significantly different from NNE scans, but GOLD stages 1, 2, and 3 were statistically significantly different from both NNE and SNE classes (P < .05).
Results of emphysema quantification were also evaluated by correlation with percentage LAA calculated by densitometry. Results are shown in Figure 5b; the associated correlation coefficient is ρ = 0.82 (P < .001). This study, which uses CT scans obtained on five different multidetector CT 64-slice scanner models and one 16-slice scanner, confirms that texture-based quantification of CN and CLE is relatively independent of scanner model, with the exception of 16-slice scanners. For example, the four NNE scans with the highest percentage of ROIs classifying as SNE were obtained on 16-slice scanners. Although the difference between 64-slice and 16-slice scanners is statistically significant (P < .001) among NNE scans, differences among the five 64-slice scanners manufactured by Siemens and GE were insignificant (P > .05).
DISCUSSION
The proposed texture-based system for quantification of CN and CLE provides good discrimination among normal lung tissue, CN or “smoker’s lung,” and CLE. Evaluation of the classifier during the training phase determined that the proposed system achieves perfect discrimination between NNE ROIs and ROIs displaying emphysema. Fewer than 3% of SNE ROIs were classified as CLE, and <6% of CLE ROIs were classified as SNE. This indicates that CN and CLE are distinct conditions that can be well distinguished from each other on the basis of texture. Eighty percent of misclassifications resulted from classifier confusion between NNE and SNE classes, particularly because SNE ROIs displaying more mild CN were confused as normal lung tissue. Nevertheless, the fact that 89% of NNE ROIs and 74% of SNE ROIs were classified correctly suggests that CN can be successfully detected by the texture-based approach.
When the proposed framework operated on full-chest CT scans to quantify extent of CN and CLE, few ROIs belonging to NNE and SNE scans were classified as emphysematous (generally <4% and <7% for NNE and SNE scans, respectively). In contrast, high levels of emphysema were found in CLE scans. The fact that misclassifications occur between NNE and CLE classes during the evaluation phase but not during the training phase can be understood in the context of the comparatively small training data set; each chest CT scan had up to eight times as many ROIs as the whole training data set. Nevertheless, it is clear from Figure 4 that in the majority of NNE subjects, most ROIs are classified as normal; in the majority of SNE subjects most ROIs are classified as “smoker’s lung”; and the majority of CLE subjects have substantial amounts of ROIs classifying as emphysematous.
It is important to note that the amount of CN found in the CT scans of smoking controls was significantly more than in the scans of nonsmokers (P < .001). Furthermore, smokers without CLE have significantly less normal lung than those who never smoked (P < .001). These results indicate that smoking-related lung injury can be distinguished from both normal lung and CLE on the basis of texture and, like CLE, can be quantified. Nevertheless, several NNE scans manifest high levels of CN. The detection of CN in normal subjects has been documented previously (6). In our study the high rate of CN in some NNE scans may be an artifact of interscanner variability and our relatively small training set or may be due to nonsmoking inhalation exposures in the normal population. Furthermore, the amount of CN found in the NNE scans was greater than the amount of CN found in CLE scans. A similar trend was identified by Lynch et al (6), perhaps because the burden of CN declines in subjects who develop emphysema. This apparent decline is in concordance with the premise that respiratory bronchiolitis is thought to be a precursor for emphysema.
Smoking-related lung disease is a complex process with many CT manifestations in the lungs that are not specific to smoking. For example, a differential diagnosis for CN includes cellular bronchiolitis (viral, mycoplasma, aspergillus), endobronchial spread of mycobacterial infection, hypersensitivity pneumonitis, sarcoidosis, and respiratory bronchiolitis. Interstitial lung disease can also be seen in smokers. The aim of this study was to identify smoking-related CT textural features; we did not explore other possible etiologies for these features, nor did we explore in this pilot study the discrimination of emphysema from obliterative bronchiolitis.
The GLRL method for texture analysis exploited here has been used for the analysis of lung textures in conjunction with other features (25–28). Nevertheless, these studies used no more than five GLRL texture features, instead including additional texture features, such as local binary patterns (28), shape features (26), and co-occurrence features (25–29) to aid in classification tasks. Rather than relying on a conglomerate of texture analysis methods, this paper provides a richer suite of run-length features than originally proposed (35) that can be used for texture analysis of chest CT scans. Furthermore, this paper introduces an enriched set of features associated with the GLGL method (36), a natural complement to the GLRL method, and demonstrates its application in chest CT scan analysis. The fact that we use only texture features computed from run-length and gap-length histograms, which can be related to CN and CLE patterns in a straightforward manner, may make this texture-based approach highly attractive to radiologists and clinicians.
Additionally, this texture-based approach involves windowing all ROIs using the intensity window between −950 and −856 HU, which was identified during the training phase as the best performing intensity window. This windowing step, a novel feature of the proposed system, proves effective in enhancing the ability of run-length and gap-length features to discriminate among CLE, CN, and normal lung tissue. It is apparent that the range of intensities between −950 and −856 HU is where differences among normal lung tissue, CN, and emphysema can be detected most effectively.
It is generally assumed that texture patterns are independent of scanner type. Indeed, this study confirms that texture-based quantification of CN and CLE is relatively independent of 64-slice scanner model. The poor classification associated with 16-slice scanners may be attributed to the fact that very few ROIs in the training data set were from scans obtained on 16-slice scanners. Whereas the difference between 16-slice and 64-slice scanners is statistically significant among NNE scans, a similar trend cannot be picked up with regard to SNE and CLE classes, because only one of 24 SNE subjects and one of 22 CLE subjects were scanned using 16-slice scanners. Further work is necessary to determine how robust the proposed texture-based method is to differences in scanner model and reconstruction method.
We evaluated the results of the texture-based system for CLE quantification by correlation with COPD GOLD stage and densitometry. As expected, percentage emphysema increases with COPD GOLD stage. Although percentage emphysema computed by the texture-based system tends to be higher than percentage LAA, correlation is strong (ρ = 0.82). In comparing the results of the texture-based system with densitometry, it is important to consider that the proposed system operates at the ROI level, while LAA quantification by densitometry operates at the pixel level. Thus, if 50% of a subject’s lung was classified by the texture-based system as emphysema, this means that 50% of ROIs in the lung contain some evidence of emphysema. Because ROIs were 35 pixels in diameter and overlapped with one another, this does not mean that 50% of pixels in the lung are emphysematous. Hence, CLE measurements obtained by densitometry tend to be lower than those obtained by the texture-based approach.
There were several limitations to this study. First, although we trained the classifier on only three classes of texture—normal lung tissue, CN, and CLE—during the evaluation phase, we presented many other features to the classifier, including vessels and large airways. Second, the large size of the ROIs limited the specificity of region-by-region classification of full-chest CT scans. Nevertheless, the incorporation of this texture-based system in a hierarchical framework whereby large ROIs classified as CN or CLE are subsequently subdivided into smaller ROIs, which are then submitted for classification once more, would address this issue. Third, in this study, we assessed only one of every 1000 pixels contained in the lung parenchyma. Further research into how many ROIs per scan must be assessed, as well as the effect of varying this number, must be performed. Fourth, only 12 CT scans from each class were used in the training phase, and 22 to 25 scans from each class were analyzed in the evaluation phase. A more extensive study would expand the training and evaluation data sets to include more cases from the COPDGene Study. Finally, further validation of the texture analysis system will also include correlation with important clinical features, including history of cigarette smoking, symptoms of chronic bronchitis, and physiologic evaluation.
CONCLUSIONS
We have presented a fully automated system for texture-based detection and quantification of CN and CLE that successfully discriminates among normal lung tissue, CN, and CLE in CT images. The value of the automated texture-based system lies in providing an independent review of CT images before they are processed by a radiologist and incorporating the quantitative values obtained therewith into the radiologist’s report. Thus, the proposed framework has the potential to facilitate robust quantification of disease extent and thereby enable accurate tracking of disease progression and regression and response to therapy.
Acknowledgments
This work was made possible by the National Heart, Lung, and Blood Institute’s Genetic Epidemiology of COPD (COPDGene) Study (grants U01HL089897 and U01HL089856) and a Siemens grant to National Jewish Health in support of the COPDGene Study.
References
- 1.Kochanek KD, Xu J, Murphy SL, et al. Deaths: preliminary data for 2009. Natl Vit Stat Rep. 2001;59:1–51. [PubMed] [Google Scholar]
- 2.Hansell DM, Bankier AA, MacMahon H, et al. Fleischner society: glossary of terms for thoracic imaging. Radiology. 2008;246:697–722. doi: 10.1148/radiol.2462070712. [DOI] [PubMed] [Google Scholar]
- 3.Remy-Jardin M, Edme JL, Boulenguez C, et al. Longitudinal follow-up study of smoker’s lung with thin-section CT in correlation with pulmonary function tests. Radiology. 2002;222:261–270. doi: 10.1148/radiol.2221001154. [DOI] [PubMed] [Google Scholar]
- 4.Heyneman LE, Ward S, Lynch DA, et al. Respiratory bronchiolitis, respiratory bronchiolitis–associated interstitial lung disease, and desquamative interstitial pneumonia: different entities or part of the spectrum of the same disease process. AJR Am J Roentgenol. 1999;173:1617–1622. doi: 10.2214/ajr.173.6.10584810. [DOI] [PubMed] [Google Scholar]
- 5.Hersh CP, Washko GR, Jacobson FL, et al. Interobserver variability in the determination of upper lobe-predominant emphysema. Chest. 2007;131:424–431. doi: 10.1378/chest.06-1040. [DOI] [PubMed] [Google Scholar]
- 6.Lynch DA, Murphy JR, Crapo JD, et al. A combined pulmonary-radiology workshop for visual evaluation of COPD: study design, chest CT findings and concordance with quantitative evaluation. J Chron Obstruct Pulmon Dis. 2012;9:151–159. doi: 10.3109/15412555.2012.654923. [DOI] [PMC free article] [PubMed] [Google Scholar]
- 7.Blechschmidt RA, Werthschutzky R, Lorcher U. Automated CT image evaluation of the lung: a morphology-based concept. IEEE Trans Med Imaging. 2001;20:434–442. doi: 10.1109/42.925296. [DOI] [PubMed] [Google Scholar]
- 8.Guo J, Reinhardt JM, Kitaoka H, et al. Integrated system for CT-based assessment of parenchymal lung disease. Proc IEEE Int Sympos Biomed Imaging. 2002:871–874. [Google Scholar]
- 9.Keller BM, Reeves AP, Apanasovich TV, et al. Quantitative assessment of emphysema from whole lung CT scans: comparison with visual grading. Proc SPIE. 2009;7260:726008. [Google Scholar]
- 10.Mishima M, Hirai T, Itoh H, et al. Complexity of terminal airspace geometry assessed by lung computed tomography in normal subjects and patients with chronic obstructive pulmonary disease. Proc Natl Acad Sci U S A. 1999;96:8829–8834. doi: 10.1073/pnas.96.16.8829. [DOI] [PMC free article] [PubMed] [Google Scholar]
- 11.Nakano Y, Muro S, Sakai H, et al. Computed tomographic measurements of airway dimensions and emphysema in smokers. Am J Respirat Crit Care Med. 2000;162:1102–1108. doi: 10.1164/ajrccm.162.3.9907120. [DOI] [PubMed] [Google Scholar]
- 12.Nakano Y, Sakai H, Muro S, et al. Comparison of low attenuation areas on computed tomographic scans between inner and outer segments of the lung in patients with chronic obstructive pulmonary disease: incidence and contribution to lung function. Thorax. 1999;54:384–389. doi: 10.1136/thx.54.5.384. [DOI] [PMC free article] [PubMed] [Google Scholar]
- 13.Stavngaard T, Shaker SB, Bach KS, et al. Quantitative assessment of regional emphysema distribution in patients with chronic obstructive pulmonary disease (COPD) Acta Radiol. 2006;9:914–921. doi: 10.1080/02841850600917170. [DOI] [PubMed] [Google Scholar]
- 14.Boedeker KL, McNitt-Gray MF, Rogers SR, et al. Emphysema: effect of reconstruction algorithm on CT imaging measures. Radiology. 2004;232:295–301. doi: 10.1148/radiol.2321030383. [DOI] [PubMed] [Google Scholar]
- 15.Kemerink GJ, Kruize HH, Lamers RJS, et al. CT lung densitometry: dependence of CT number histograms on sample volume and consequences for scan protocol comparability. J Comput Assist Tomogr. 1997;21:948–954. doi: 10.1097/00004728-199711000-00018. [DOI] [PubMed] [Google Scholar]
- 16.Kemerink GJ, Lamers RJS, Pellis BJ, et al. On segmentation of lung parenchyma in quantitative computed tomography of the lung. Med Phys. 1997;25:2432–2439. doi: 10.1118/1.598454. [DOI] [PubMed] [Google Scholar]
- 17.Sluimer I, Prokop M, Hartmann I, et al. Automated classification of hyper-lucency, fibrosis, ground glass, solid, and focal lesions in high-resolution CT of the lung. Med Phys. 2006;33:2610–2620. doi: 10.1118/1.2207131. [DOI] [PubMed] [Google Scholar]
- 18.Gietema HA, Muller NL, Fauerbach PVN, et al. Quantifying the extent of emphysema: factors associated with radiologists’ estimations and quantitative indices of emphysema severity using the ECLIPSE cohort. Acad Radiol. 2011;18:661–671. doi: 10.1016/j.acra.2011.01.011. [DOI] [PubMed] [Google Scholar]
- 19.Sluimer I, van Waes PF, Viergever MA, et al. Computer-aided diagnosis in high resolution CT of the lungs. Med Phys. 2003;30:3081–3090. doi: 10.1118/1.1624771. [DOI] [PubMed] [Google Scholar]
- 20.Uppaluri R, Hoffman EA, Sonka M, et al. Computer recognition of regional lung disease patterns. Am J Respirat Crit Care Med. 1999;160:648–654. doi: 10.1164/ajrccm.160.2.9804094. [DOI] [PubMed] [Google Scholar]
- 21.Zavaletta VA, Bartholmai BJ, Robb RA. High resolution multidetector CT-aided tissue analysis and quantification of lung fibrosis. Acad Radiol. 2007;14:772–787. doi: 10.1016/j.acra.2007.03.009. [DOI] [PMC free article] [PubMed] [Google Scholar]
- 22.Chabat F, Yang G, Hansell DM. Obstructive lung diseases: texture classification for differentiation at CT. Radiology. 2003;228:871–877. doi: 10.1148/radiol.2283020505. [DOI] [PubMed] [Google Scholar]
- 23.Kim N, Seo JB, Lee Y, et al. Development of an automatic classification system for differentiation of obstructive lung disease using HRCT. J Digit Imaging. 2009;22:136–148. doi: 10.1007/s10278-008-9147-7. [DOI] [PMC free article] [PubMed] [Google Scholar]
- 24.Uppaluri R, McLennan G, Sonka M, et al. Interstitial lung disease: a quantitative study using the adaptive multiple feature method. Am J Respirat Crit Care Med. 1999;159:519–525. doi: 10.1164/ajrccm.159.2.9707145. [DOI] [PubMed] [Google Scholar]
- 25.Xu Y, Sonka M, McLennan G, et al. MDCT-based 3-D texture classification of emphysema and early smoking related lung pathologies. IEEE Trans Med Imaging. 2006;25:464–475. doi: 10.1109/TMI.2006.870889. [DOI] [PubMed] [Google Scholar]
- 26.Park YS, Seo JB, Kim N, et al. Texture-based quantification of pulmonary emphysema on high-resolution computed tomography: comparison with density-based quantification and correlation with pulmonary function tests. Invest Radiol. 2008;43:395–402. doi: 10.1097/RLI.0b013e31816901c7. [DOI] [PubMed] [Google Scholar]
- 27.Prasad M, Sowmya A, Wilson P. Multi-level classification of emphysema in HRCT lung images. Pattern Anal Appl. 2009;12:9–20. [Google Scholar]
- 28.Sorensen L, Shaker SB, de Bruijne M. Quantitative analysis of pulmonary emphysema using local binary patterns. IEEE Trans Med Imaging. 2010;29:559–569. doi: 10.1109/TMI.2009.2038575. [DOI] [PubMed] [Google Scholar]
- 29.Uppaluri R, Mitsa T, Sonka M, et al. Quantification of pulmonary emphysema from lung computed tomography images. Am J Respirat Crit Care Med. 1997;156:248–254. doi: 10.1164/ajrccm.156.1.9606093. [DOI] [PubMed] [Google Scholar]
- 30.Regan EA, Hokanson JE, Murphy JR, et al. Genetic epidemiology of COPD (COPDGene) study design. J Chron Obstruct Pulmon Dis. 2010;7:32–43. doi: 10.3109/15412550903499522. [DOI] [PMC free article] [PubMed] [Google Scholar]
- 31.Han MK, Kazerooni EA, Lynch DA, et al. Chronic obstructive pulmonary disease exacerbations in the COPDGene study: associated radiologic phenotypes. Radiology. 2011;261:274–282. doi: 10.1148/radiol.11110173. [DOI] [PMC free article] [PubMed] [Google Scholar]
- 32.Calverley PMA. The GOLD classification has advanced understanding of COPD. Am J Respirat Crit Care Med. 2004;170:211–212. doi: 10.1164/rccm.2405008. [DOI] [PubMed] [Google Scholar]
- 33.Genevois PA, Vuyst PD, de Maertelaer V, et al. Comparison of computed density and microscopic morphometry in pulmonary emphysema. Am J Respirat Crit Care Med. 1996;154:187–192. doi: 10.1164/ajrccm.154.1.8680679. [DOI] [PubMed] [Google Scholar]
- 34.Coxson HO, Rogers RM, Whittall KP, et al. A quantification of the lung surface area in emphysema using computed tomography. Am J Respirat Crit Care Med. 1999;159:851–856. doi: 10.1164/ajrccm.159.3.9805067. [DOI] [PubMed] [Google Scholar]
- 35.Loh H, Leu J, Luo RC. The analysis of natural textures using run length features. IEEE Trans Indust Electron. 1988;35:323–328. [Google Scholar]
- 36.Xinli W, Albregtsen F, Foyn B. Texture features from gray level gap length matrix. IAPR Workshop Mach Vision Appl. 1994:375–378. [Google Scholar]
- 37.Hastie T, Tibshirani R, Friedman J. The elements of statistical learning: data mining, inference, and prediction. New York: Springer; 2001. [Google Scholar]