

Abstract
An increasing body of evidence highlights an intriguing interaction between microRNAs and transcriptional factors involved in determining cell fate, including the well known “genome guardian” p53. Here we show that miR‐205, oncosuppressive microRNA lost in breast cancer, is directly transactivated by oncosuppressor p53.
Moreover, evaluating miR‐205 expression in a panel of cell lines belonging to the highly aggressive triple negative breast cancer (TNBC) subtype, which still lacks an effective targeted therapy and characterized by an extremely undifferentiated and mesenchymal phenotype, we demonstrated that this microRNA is critically down‐expressed compared to a normal‐like cell line. Re‐expression of miR‐205 where absent strongly reduces cell proliferation, cell cycle progression and clonogenic potential in vitro, and inhibits tumor growth in vivo, and this tumor suppressor activity is at least partially exerted through targeting of E2F1, master regulator of cell cycle progression, and LAMC1, component of extracellular matrix involved in cell adhesion, proliferation and migration.
Keywords: miR-205, p53, E2F1, LAMC1
Highlights
miR‐205 is downregulated in triple negative breast cancer.
miR‐205 directly targets LAMC1 and E2F1.
miR‐205 inhibits cellular proliferation in vitro and in vivo.
miR‐205 induces cellular senescence.
p53 regulates miR‐205 expression.
1. Introduction
The involvement of microRNAs in the biology of human cancer is supported by an increasing body of experimental evidence, that has gradually switched from profiling studies to biological demonstrations of the causal role of these small molecules in the tumorigenic process, modulating oncogenic or tumor suppressor pathways, and the possible implications as biomarkers or therapeutic tools (Iorio and Croce, 2009). The first report describing a microRNA signature unique for breast cancer and associating microRNA expression to specific bio‐pathological features was published by our group in 2005 (Iorio et al., 2005).
Previous studies showed that miR‐205 expression is significantly underexpressed in human breast cancer (Iorio et al., 2009) (Wu et al., 2009), and able to interfere with HER receptor family‐mediated survival pathway by directly targeting HER3 receptor (Iorio et al., 2009). In addition, other studies indicated that miR‐205 is a negative regulator of the Epithelial‐Mesenchymal Transition (EMT), targeting ZEB1 and ZEB2 transcription factors, and that its expression is lost in mesenchymal breast cancer cell lines (Gregory et al., 2008). Moreover, miR‐205 also targets VEGF‐A (Wu et al., 2009) and inhibits Src‐mediated oncogenic pathways in renal cancer (Majid et al., 2011).
In this study we aimed to identify novel potential oncosuppressive pathways depending on miR‐205 in triple negative breast cancer (TNBC), an extremely aggressive tumor subgroup, negative for HER2, ER and PgR, characterized by an undifferentiated phenotype, and still lacking a specific therapy.
Concerning miR‐205 expression in different subgroups of breast tumors, Sempere and colleagues (Sempere et al., 2007) described miR‐205 expression to be restricted to the myoepithelial/basal cell compartment of normal mammary ducts and lobules and reduced or completely eliminated in matching tumor specimens, and a very recent study (Radojicic et al., 2011) reported that miR‐205 expression is significantly underexpressed in primary TNBCs compared to the normal counterpart.
Using as a model TNBC cell lines (MDA‐MB‐231 and BT‐549), we first confirmed that miR‐205 exerts an oncosuppressive activity, reducing cellular proliferation both in vitro and in vivo. Our results demonstrate that miR‐205 directly targets E2F1, a transcriptional factor playing a crucial role in the regulation of cell cycle progression (Polager and Ginsberg, 2009), and LAMC1, a component of the extracellular matrix, implicated in a wide variety of biological processes including cell adhesion, differentiation, migration and metastasis (Martin and Timpl, 1987). Finally we analyzed the transcriptional unit of miR‐205 in order to clarify the molecular mechanisms affecting its expression: interestingly, here we demonstrate that tumor suppressor p53, whose mutations and loss represent one of the most common genetic changes in human neoplasias including breast cancer, is able to positively modulate miR‐205 expression levels in different cellular models, and that this effect is exerted through direct binding of the transcription factor on regulatory sequences upstream the microRNA coding gene.
2. Materials and methods
2.1. Cell culture, transfections and treatments
All the cell lines used in this work were purchased from the American Type Culture Collection (ATCC). HEK‐293, MCF7, SAOS‐2 cells were grown in Dulbecco's modified Eagle medium (DMEM), MDA‐MB‐231 and BT‐549 cells in Roswell Park Memorial Institute 1640 (RPMI) medium, both containing 10% heat‐inactivated fetal bovine serum (FBS), 2 mM l‐glutamine and 100 U/mL penicillin–streptomycin. SUM‐149 were cultured in DMEM‐F12 containing 10% heat‐inactivated fetal bovine serum (FBS), 2 mM l‐glutamine, 100 U/mL penicillin–streptomycin and 5ug/ml insulin. All transfections were carried out with Lipofectamine 2000 (Invitrogen, Carlsbad, CA) according to the manufacturer's instructions.
MCF7 cells, previously transfected with siRNA‐CTR or siRNA‐p53 (Santa Cruz Inc., Santa Cruz, CA) were treated for 24 or 48 h with 10 μM Nutlin‐3a (Cayman Chemical Company, Ann Arbor, MI) or vehicle (DMSO), or with 10 μg/ml 5‐fluorouracil (5‐FU, Sigma–Aldrich, St. Louis, MO) or vehicle (DMSO).
For promoter methylation experiments, MDA‐MB‐231 and BT‐549 cells were treated with 10 μM 5‐Aza‐2′‐deoxycytidine (Sigma–Aldrich).
2.2. Plasmid construction
The expression plasmids for miR‐205 (Vec‐miR‐205) and the corresponding empty vector (miR‐Vec) were kindly provided by Dr. Reuven Agami (The Netherlands Cancer Institute, Amsterdam, the Netherlands). The plasmid encoding LAMC1‐shRNA (sh‐LAMC1), E2F1‐shRNA (sh‐E2F1) and the corresponding empty vector (sh‐CTR) were purchased from Origene (Rockville, MD). For luciferase reporter experiments, a region of 1017 bp of the E2F1 3′ untranslated region (UTR) or 244 bp of the LAMC1‐3′‐UTR including the binding site for miR‐205 was amplified from HEK‐293 cells. The PCR product was then digested with XbaI and cloned into the reporter plasmid pGL3 control (Promega, Madison, WI) downstream of the luciferase gene. Mutations into the miR‐205 binding site of the E2F1 or LAMC1‐3′UTR were introduced using Quik‐Change Site‐Directed Mutagenesis kit (Agilent Technologies, Santa Clara, CA).
Primers for plasmid construction and mutagenesis were:
E2F1 Fw: 5′‐TCTAGACTTGGAGGGACCAGGGTTTC‐3′
E2F1 Rev: 5′‐TCTAGAAAAGCAGGAGGGAACAGAGC‐3′
LAMC1 Fw: 5′‐TCTAGAAATCGGGAACAAAGGGTTTT‐3′
LAMC1 Rev: 5′‐TCTAGATAACTAAAAGCACTGATGGATGG‐3′
E2F1‐Mut‐A‐Fw: 5′‐GTGTGTGCATGTACCGGGGACGCGGCGTGAACATACACCTCTGTC‐3′
E2F1‐Mut‐A‐Rev: 5′‐GACAGAGGTGTATGTTCACGCCGCGTCCCCGGTACATGCACACAC‐3′
E2F1‐Mut‐B‐Fw: 5′‐GTTCTTCTGCCCCATACGCGGCCGACTGAGGCCTGGGTGA‐3′
E2F1‐Mut‐A‐Rev: 5′‐TCACCCAGGCCTCAGTCGGCCGCGTATGGGGCAGAAGAAC‐3′
LAMC1‐Mut‐Fw: 5′‐CTCAGTACTCTTGTTTCTCGCGGCCGAAAGTTTGGCTACTAACA‐3′
LAMC1‐Mut‐Rev: 5′‐TGTTAGTAGCCAAACTTTCGGCCGCGAGAAACAAGAGTACTGAG‐3′
To map the miR‐205 promoter, region HPR (described in the results section) was amplified by PCR and cloned at the NheI and XhoI sites of the pGL3 basic vector (Promega). A region of 2000 bp upstream miR‐205 locus (spanning the p53 binding site and named p53BR) was cloned at the NheI and XhoI sites of the pGL3‐promoter (pGL3p) vector (Promega).
HPR Fw‐NheI 5′‐GCTAGCCAGTCCCCGGCACCCCAGGCTGCTC‐3′
HPR Rev‐XhoI 5′‐CTCGAGGGGTGAGCAAGAGGGACTCAGCCCA‐3′
P53BR Fw‐NheI 5′‐GCTAGCCGTGCATGTGCTTGGCTCTAGACCC‐3′
P53BR Rev‐XhoI 5′‐CTCGAGCAGAGGGTGGGGATGCATGTCAACC‐3′
Full‐length p53 cDNA, excised by BamHI digestion of plasmid pC53‐SN3 (Baker et al., 1990), was subcloned into plasmid pIREShyg (Clontech, Mountain View, CA) and designated pIRES/p53.
2.3. Quantitative real‐time PCR for miRNA and mRNA quantification and semi‐quantitative RT‐PCR
Quantitative real‐time PCR (qRT‐PCR) was performed with the TaqMan PCR Kit (Applied Biosystems, Foster City, CA) according to manufacturer's instructions. Normalization was performed with RNA U44/U48 or U6 RNA. For quantification of p53 and E2F1 mRNAs, the appropriate TaqMan probes were purchased from Applied Biosystems.
Semi‐quantitative RT‐PCR was performed with the SuperScript One‐Step RT‐PCR (Invitrogen) according to manufacturer's instructions. Primers used for miR‐205 Host Gene were:
miR‐205 HG Fw 5′‐TGGGCTGAGTCCCTCT‐3′
miR‐205 HG Rev 5′‐GAGGGACGGGTGATGGGCAGATTGG‐3′
Primer used for GAPDH were:
GAPDH Fw 5′‐CTGCACCACCAACTGCTTA‐3′
GAPDH Rev 5′‐CATGACGGCAGGTCAGGTC‐3′
2.4. Stable transfections and cell colony forming assay
MDA‐MB‐231 and BT‐549 cells were plated in 100‐mm dishes and transfected with 8 μg of Vec‐miR‐205 or miR‐Vec as control. After 48 h, Blasticidin (InVivoGen, San Diego, CA) was added at the final concentration of 5 μg/mL. Three weeks after the onset of drug selection, colonies were counted using the QuantityOne software. The mean ± S.D. of three independent experiments performed in triplicate was reported.
2.5. Immunohistochemical analysis
Tissue Micro‐Arrays (TMAs) were purchased from BioMax (BR1503) (Biomax, Rockville, MD). In situ hybridization was performed as previously described (Nuovo et al., 2009), using a miR‐205 probe (Exiqon, Vedbaek, Denmark). Immunohistochemical analyses were performed according to standard procedures (Nuovo et al., 2009), using the anti‐LAMC1 (sc‐17751) and anti‐E2F1 (sc‐251) antibodies (Santa Cruz Inc., Santa Cruz, CA). Combined images were also analyzed by using the Nuance™ multispectral imaging system (Caliper Life Science, Hopkinton, MA). Correlation between miR‐205 and E2F1 or miR‐205 and LAMC1 expression was evaluated by chi‐square test using Yates' correction.
2.6. Proliferation assays
Proliferation assay was performed as previously described (Di Leva et al., 2010).
2.7. In vivo experiments
5 × 10⁶ cells (Vec‐miR‐205#2 or Vec‐miR‐205#20) mixed to Matrigel were subcutaneously injected in SCID mice (4 mice for each group), and tumor growth was monitored evaluating the tumor size according to the following function: d2 x D/2 (where d is the minor diameter, whereas D is the major diameter).
2.8. Cell cycle analyses
Cells were treated with thymidine 2 mM for 16 h, released in complete medium for 8 h and blocked with thymidine for 17 additional hours. After the second release, cells were collected every 2 h for 8 h and then analyzed as previously described (Di Leva et al., 2010). The data obtained were analyzed using ModFit software, 3.2 version (Verity Software House).
2.9. Apoptosis assay
Apoptosis was quantified by using Caspase‐Glo 3/7 assay (Promega) according to the manufacturer's instructions on a Bio‐Tek Synergy HT multi detection microplate reader. The assay was performed three times in triplicate and the mean + S.D. was reported.
2.10. BrDU assay
Twenty‐four hours following the seeding, cells were treated with 2 mM thymidine for 16 h, then washed twice with PBS and cultured for 8 h in complete medium. Cells were then treated again with 2 mM thymidine for 17 h, to synchronize them in G1 phase of the cell cycle. Following the thymidine double block, cells were then cultured in complete medium containing 1 mM BrdU and harvested at different time points. Harvested cells were fixed and stained using the BrdU Flow Kit (BD Pharmingen, San Diego, CA), according to the manufacturer's instructions. Stained cells were analyzed by flow cytometry, as described above. The assay was performed three times in triplicate and the mean ± S.D. was reported.
2.11. Senescence assay
Senescence Associated‐β‐galactosidase activity was assessed by using Senescence β‐galactosidase Staining Kit (Cell Signaling, Danvers, MA), following the manufacturer's instructions. At least 20 fields, observed by contrast phase microscopy, for each experimental point were analyzed. Reported values are the mean ± S.D. of three independent experiments.
2.12. Luciferase assays for target and promoter identification
250 ng of pGL3 reporter vector carrying the miR‐205 binding site, 25 ng of the phRL‐SV40 control vector (Promega), and 100 nM miRNA precursors or scrambled sequence miRNA control (Ambion Inc, Austin, TX) were cotransfected into HEK‐293 cells in 24‐well plates.
To map the miR‐205 promoter, 250 ng of pGL3 basic reporter vector (Promega) carrying the region HPR and 25 ng of the phRL‐SV40 control vector were cotransfected into HEK‐293 cells in 24‐well plates. Firefly luciferase activity was measured with a Dual Luciferase Assay Kit (Promega) 24 h after transfection and normalized with a Renilla luciferase reference plasmid. Reporter assays were carried out in quadruplicate and the mean ± S.D. was reported. Statistical significance was analyzed by the unpaired Student t‐test.
2.13. Western blot analyses
Protein extraction and western blots were performed as previously described (Di Leva et al., 2010).
The antibodies used were: anti‐LAMC1 (sc‐17751, Santa Cruz Inc), anti‐p53 (Santa Cruz Inc, sc‐126), anti‐E2F1 (sc‐251, Santa Cruz Inc), anti‐GAPDH (2118, Cell Signaling), B23 (sc‐53175, Santa Cruz Inc).
2.14. Chromatin immunoprecipitation assay
Chromatin immunoprecipitation (ChIP) assays were performed with the ChIP assay kit (Upstate Biotechnology, Lake Placid, NY) with minor modifications as previously described (Di Leva et al., 2010). The primary antibody used for immunoprecipitation was mouse monoclonal p53 (sc‐126, Santa Cruz Inc.). Primers used for PCR amplification were:
p53BS‐FW 5′‐ACAAGCCCCAGGAAGAAAGT‐3′
p53BS‐REV 5′‐TTGTTGGTCATGAGGATGGA‐3′
p21BS FW 5′‐TTGTTCAATGTATCCAAAAGAAACA‐3′
p21BS REV 5′‐TGAGATAAAGCTTCTTCCCTTAAAAA‐3
2.15. Nuclear/cytoplasmic differential protein extraction and electrophoretic mobility shift assay (EMSA)
Nuclear/Cytoplasmic differential protein extraction was performed by using the NE‐PER Nuclear and Cytoplasmic extraction kit (Pierce) according to the manufacturer's instructions.
EMSA assays were performed by using the LightShift Chemiluminescent EMSA kit (Thermo, Rockford, IL) according to the manufacturer's instructions.
The oligonucleotide sequences of the p53‐responsive element (p53RE) or its mutated form (p53RE MUT) were purchased as biotinilated or non biotinilated single strands from Operon (Huntsville, AL).
p53BS Wt‐Fw 5′‐ACTGAGCCATGGGCATGTCTGAACACAACA‐3′
p53BS Mut‐Fw 5′‐ACTGAGCCATCCCGGCCGGCGAACACAACA‐3′
p53BS WT‐Rev 5′‐TGTTGTGTTCAGACATGCCCATGGCTCAGT‐3′
p53BS Mut‐Rev 5′‐TGTTGTGTTCGCCGGCCGGGATGGCTCAGT‐3′
2.16. Statistical analysis
Student's t‐test was used to determine statistical significance. All error bars represent the standard deviation (S.D.) of the mean or the standard error (S.E.). Statistical significance for all the tests was assessed by calculating the p‐value.
3. Results
3.1. miR‐205 is downregulated in TNBC and inhibits in vitro and in vivo growth of MDA‐MB‐231 cells
We first evaluated miR‐205 expression in a panel of 10 Triple Negative and 1 Normal‐like breast cancer cell lines, finding a significant (p < 0.05) downregulation in TN cell lines (Supplementary Figure 1) compared to the Normal‐like one. As a model for functional studies, we chose MDA‐MB‐231 and BT‐549 cell lines.
We first performed a colony forming assay in MDA‐MB‐231 and BT‐549 cells transfected with a plasmid encoding miR‐205 (Vec‐miR‐205) or the corresponding empty vector (miR‐Vec). As shown in Figure 1A, the ability to form colonies was severely impaired in miR‐205 overexpressing cells (colony count in Figure 1B). miR‐205 overexpression in Vec‐miR‐205 cells compared to empty vector transfected cells was confirmed by qRT‐PCR (Supplementary Figure 2A–B).
Figure 1.
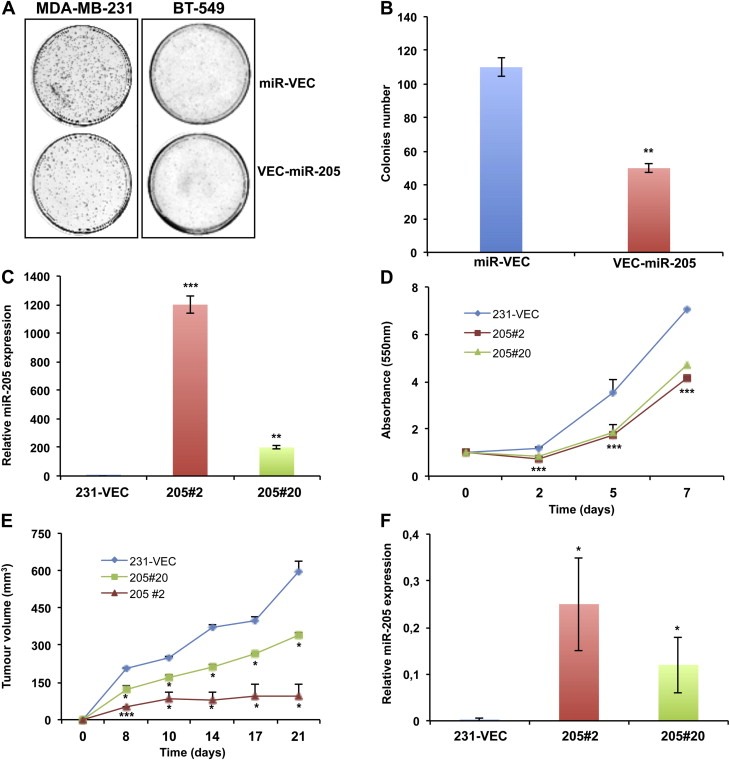
miR‐205 inhibits cell proliferation in vitro and in vivo in MDA‐MB‐231 cells. (A) Inhibition of colonies formation obtained transfecting MDA‐MB‐231 or BT‐549 cells with a vector encoding miR‐205 (Vec‐miR‐205) compared to the corresponding empty vector (miR‐Vec). (B) Quantitative analysis of the experiment shown in A, indicating colony formation inhibition (p < 0.01) from three independent experiments. Error bars represent the standard deviation (S.D.) calculated on 3 replicates. (C) Selection of two clones from the MDA‐MB‐231 VEC‐miR‐205 bulk population. miR‐205 overexpression in Vec‐miR‐205#2 and #20 clones was evaluated by qRT‐PCR. Error bars represent S.D. calculated on 3 replicates. (D) SRB assay highlights a reduced growth kinetic in miR‐205 overexpressing clones in comparison with control cells (p < 0.001). Bars indicate S.D. calculated on 6 different replicates. (E) In vivo growth kinetics of stable clones subcutaneously injected in SCID mice. Bars indicate standard error (SE) calculated on two different experiments performed with four mice for each group (*p < 0.05; **p < 0.01; ***p < 0.001). (F) qRT‐PCR analysis verifies miR‐205 expression in xenograft tumors. Bars indicate S.D. calculated on 3 different replicates.
Subsequently, two stable clones of MDA‐MB‐231 (Vec‐miR‐205#2 and Vec‐miR‐205#20) overexpressing miR‐205 (Figure 1C) in comparison to a single miR‐Vec clone (miR‐Vec#1) were selected out from the corresponding bulk populations. Growth kinetics analysis by SRB assay reveals that growth of both miR‐205‐expressing clones was slower than the control vector clone (Figure 1D).
To confirm that the in vitro inhibitory effects of miR‐205 on MDA‐MB‐231 cells could also reflect an impairment of their in vivo tumorigenicity, we developed xenograft models and results indicate that growth of tumors deriving from Vec‐miR‐205#2 and Vec‐miR‐205#20 clones was significantly inhibited in comparison with tumors originating from control miR‐Vec#1 clone: indeed, after 21 days, mice injected with the two miR‐205 overexpressing clones developed a tumor mass of 144 and 326 mm3 respectively (growth inhibition of 74% and 40% respectively) (Figure 1E), whereas in control mice the tumor reached a volume of 546 mm3. miR‐205 expression was conserved in xenograft tumors, as validated by qRT‐PCR (Figure 1F). We can thus affirm that miR‐205 inhibits in vivo growth of MDA‐MB‐231 cells.
3.2. miR‐205 affects cell cycle progression and cellular senescence by targeting E2F1
To shed more light on the mechanism of miR‐205‐mediated inhibition of MDA‐MB‐231 and BT‐549 cell growth, asynchronously growing miR‐Vec#1, Vec‐miR‐205#2 and #20 clones were analyzed by flow cytometry. Figure 2A–B shows that miR‐Vec#1 displayed a percentage of cells in G1 phase of the cell cycle significantly lower compared to Vec‐miR‐205#2 and #20 (55.45% vs 64.64% and 65.47%, respectively). Similar results were obtained in BT‐549 cells (Supplementary Figure 3A–B).
Figure 2.
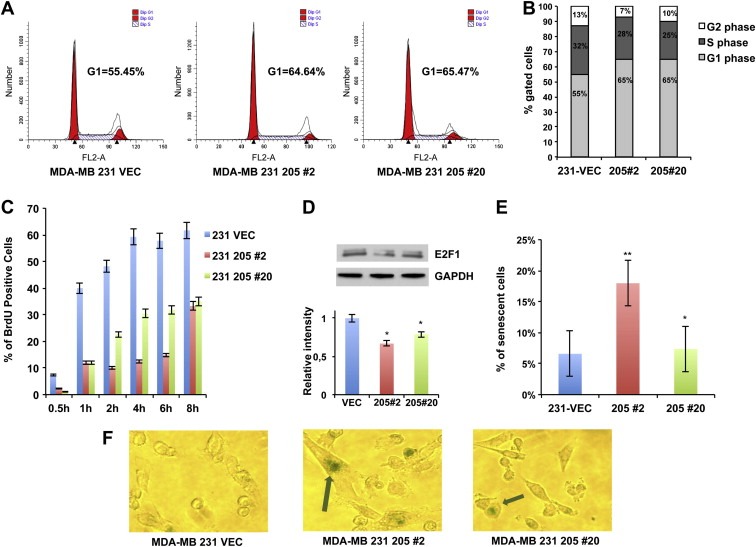
miR‐205 effects on cell cycle progression and cellular senescence. (A) Cell cycle analysis of asynchronously growing miR‐Vec#1, Vec‐miR‐205‐#2 and #20 clones. Cells were harvested after 72 h following the seeding, fixed, stained with propidium iodide and analyzed by flow cytometry. The data obtained were analyzed using ModFit software. Cells in G1 and in G2 phase of cell cycle are reported in red, cells in S phase are indicated with white and blue bars. Flow cytometry plots shown are representative of three independent experiments. (B) Graphic representation of relative percentage of cells in G1, S, or G2 phase relative to the experiment shown in A. Percentages of cells in each compartment are means of three independent experiments. (C) miR‐Vec#1, Vec‐miR‐205‐#2 and #20 clones were synchronized in the G1 phase of the cell cycle by thymidine double block, and then cultured in BrdU conditioned medium, harvested at different time points and stained using an anti‐BrdU antibody. The percentage of BrdU positive cells for each time point was analyzed by flow cytometry analysis. Values are the mean ± S.D. of three independent experiments. (D) Total extracts from miR‐Vec#1, Vec‐miR‐205#2 and #20 clones were analyzed by western blot for E2F1 detection (upper panel). Densitometric analysis of E2F1 bands is reported in the lower panel. (E–F) SA‐β‐gal‐staining was performed on miR‐Vec#1, Vec‐miR‐205‐#2 and #20 clones and light microscope cell images were acquired. The percentage of SA‐β‐gal positive cells is reported (E). Values are the mean ± S.D. of three independent experiments. A representative image of each SA‐β‐gal stained clone is reported. Arrows highlight senescent‐like cellular morphology and SA‐β‐gal‐staining in 205#2 and 205#20 clones (F) (For interpretation of the references to color in this figure legend, the reader is referred to the web version of this article.).
Moreover, results shown in Figure 2A and in Supplementary Figure 3A suggest that reduced growth of miR‐205 overexpressing clones is not due to apoptosis induction, since no sub‐G1 population was observed in comparison to miR‐Vec#1 clone. However, to further investigate this issue, we evaluated Caspase 3/7 activation following transient transfection of miR‐205 in MDA‐MB‐231 cells, and no significant apoptosis induction was observed at 72 h or 96 h (Supplementary Figure 4A–B), indicating that the reduced growth rate observed in miR‐205 overexpressing clones could not be due to an increased apoptosis.
To better analyze the G1/S transition in these clones, miR‐Vec#1 and Vec‐miR‐205#2 and #20 cells were synchronized in G1 by a thymidine double block, released in complete medium and collected after 2, 4, 6, 8 h, and cell cycle distribution determined by FACS analysis. As shown in Supplementary Figure 5A–B, the percentage of the G1 resting cells in the miR‐Vec#1 clone was lower compared to Vec‐miR‐205#2 and #20 at 4 h (29.95% vs 43.65% and 32.35%, respectively) and 6 h (25.2% vs 36.61% and 32.48%, respectively) from the release. In addition, to quantify the G1 checkpoint activation, we performed BrdU incorporation assays in these clones. Cells were synchronized in G1 phase by thymidine double block, then released in complete medium containing 1 mM BrdU. Cells were harvested at different time points and stained using an anti‐BrdU antibody. BrdU incorporation was then evaluated by flow cytometry analysis. As shown in Figure 2C, BrdU incorporation was significantly higher in miR‐Vec#1 compared to Vec‐miR‐205#2 and #20 (p < 0.001 at all indicated time points).
Considering previous data reporting that miR‐205 down‐regulates E2F1, a factor critically involved in cell cycle progression from G1 to S phase (Polager and Ginsberg, 2009), in prostate (Gandellini et al., 2009) and melanoma (Dar et al., 2011), we evaluated by western blot analysis protein extracts from asynchronously growing MDA‐MB‐231 and BT‐549 cells, showing reduced E2F1 protein levels in miR‐205 overexpressing clones (Figure 2D and Supplementary Figure 5C).
Interestingly, we also observed a significant morphologic change in miR‐205 overexpressing clones, which displayed an enlarged cellular size resembling a senescence‐like phenotype. Because of the well known association between reduced E2F1 levels and the induction of cellular senescence (Maehara et al., 2005), we investigated whether miR‐205 overexpression could result in senescence induction. As shown in Figure 2E–F, the percentage of senescence associated‐β‐galactosidase (SA‐β‐gal) was significantly higher in Vec‐miR‐205#2 clone compared to miR‐Vec#1. Moreover, Figure 2F also shows the enlarged phenotype observed in this clone.
Considering the reduced E2F1 levels detected in miR‐205 overexpressing clones, we investigated whether this transcription factor is directly targeted by miR‐205 in our models. We first observed that overexpression of miR‐205 for 72 or 96 h (verified by qRT‐PCR, Figure 3A, upper panel) strikingly decreased E2F1 mRNA (Figure 3A middle panel) and protein expression (Figure 3A, lower panel). Similar results were obtained in BT‐549 cells (Supplementary Figure 6A). Conversely, inhibition of miR‐205 expression by transfecting an anti‐miR‐205 in SUM‐149 cells (displaying relatively higher levels of miR‐205 compared to other TN cell lines) resulted in an increase of E2F1 expression, both at protein and mRNA level (Supplementary Figure 6B).
Figure 3.
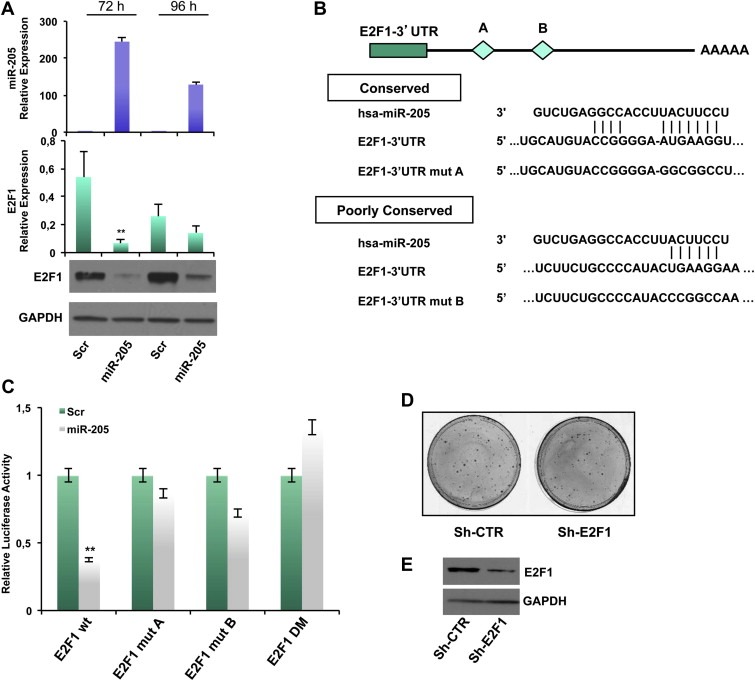
miR‐205 directly targets E2F1. (A) Transfection of MDA‐MB‐231 cells with 100 nmol/L pre–miR‐205 or a scrambled oligonucleotide and collection of RNA and proteins after 72 h and 96 h. miR‐205 expression was evaluated by real‐time PCR. E2F1 mRNA levels was evaluated by qRT‐PCR and protein levels were quantified by western blot. (B) Schematic representation of the interaction between miR‐205 and the binding site (conserved‐A and poorly conserved‐B) on the wild‐type E2F1‐3′UTR and the mutated control. (C) Luciferase activity for E2F1‐3′UTR‐wt, E2F1‐3′UTR‐mut‐A, E2F1‐3′UTR‐mut‐B and E2F1‐3′UTR double mutant (DM) plasmids was determined 24 h after transfection of HEK‐293 cells. The results are representative of four independent experiments. Bars indicate S.D. calculated on 3 different replicates (p < 0.01). (D) Phenocopy experiment showing the inhibition of colony formation obtained by transfecting MDA‐MB‐231 cells with a vector encoding a shRNA silencing E2F1 (sh‐E2F1) compared with the corresponding empty vector (sh‐CTR) and (E) Down‐modulation of E2F1 protein (evaluated by western blot) 96 h after transfection.
miR‐205 was predicted by TargetScan software to bind the E2F1 3′UTR at two different sites, A (highly conserved) and B (poorly conserved) (Figure 3B). 1017 bp of E2F1 3′UTR were inserted in a reporter vector that was cotransfected in HEK‐293 cells with miR‐205 precursor molecule or a scrambled oligonucleotide as control, and a luciferase assay was then performed. Overexpression of miR‐205 significantly inhibited E2F1 3′UTR luciferase activity relative to the control (∼60% reduction, p < 0.01), whereas E2F1 3′UTR containing mutations at site A or B or both escaped this inhibition (Figure 3C).
To evaluate whether the biological effects exerted by miR‐205 were mediated, at least in part, by regulation of E2F1, we performed phenocopy experiments by directly silencing E2F1 by shRNA approach. We evaluated in vitro effects on cell growth by performing a colony forming assay on MDA‐MB‐231 cells transfected with a plasmid encoding an shRNA specifically directed against E2F1 (sh‐E2F1) or the corresponding empty vector (sh‐CTR). As shown in Figure 3D, efficient knock down of E2F1 (evaluated by Western Blot, lower panel) decreased the ability to form colonies (30% inhibition) (upper panel). In addition, silencing of E2F1 results in a slower cell cycle progression from G1 to G2 phase: sh‐CTR bulk population displayed a percentage of cells in G1 phase significantly lower compared to sh‐E2F1 one (33.84% vs 42.72%) (Supplementary Figure 6C).
In order to investigate the potential inverse correlation between miR‐205 and E2F1, we first looked at E2F1 expression in a previously published gene profiling (Farazi et al., 2011), and we found it overexpressed in tumor samples versus normal breast (p = 0.014) (data not shown). Moreover E2F1, already reported as upregulated in basal tumors (Docquier et al., 2010), was confirmed to be overexpressed in TNBC vs normal tissue in the same dataset we analyzed (Farazi et al., 2011) (p = 0.0167) (data not shown).
To further assess this potential inverse correlation between miR‐205 and E2F1 expression in human breast cancer, we analyzed a tissue micro‐array (TMA), including 117 breast cancer cases, by immunohistochemistry (IHC) and in situ hybridization for both E2F1 and miR‐205, respectively. Each sample was scored for the expression of both miR‐205 and E2F1, independently. As shown in Supplementary Figure 7A and B, E2F1 was abundantly expressed in the analyzed breast cancer samples (67% of cases), whereas miR‐205 was observed in 43% of cases. Even though we did not observe a significant (p = 0.843, Yates' p‐value) inverse correlation between miR‐205 and E2F1 expression, interestingly Nuance analysis revealed that in most of the double positive (miR‐205 and E2F1) samples, the co‐expression was not observed in the same cells from each sample (Supplementary Figure 7C). Thus, a further statistical analysis, performed excluding double positive samples in which E2F1 and miR‐205 were not expressed by the same cells, indicated a significant inverse correlation (p = 0.006, Yates' p‐value) between their expression levels. Hence, these results further support that E2F1 is a target of miR‐205, also in breast cancer tissues.
3.3. miR‐205 directly targets LAMC1
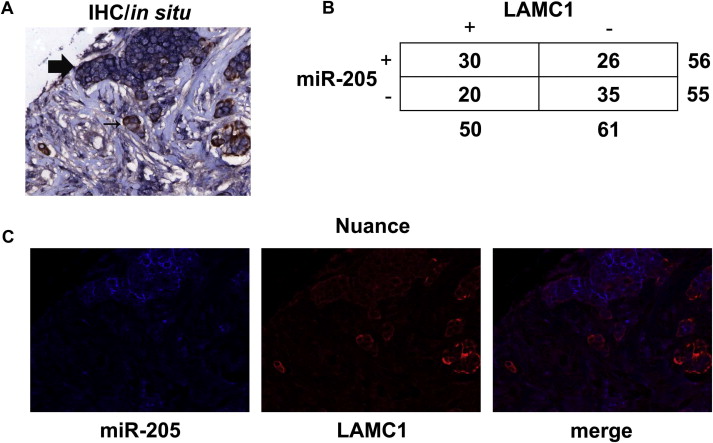
To better explain the biological effects mediated by miR‐205 in our experimental model, we investigated new additional targets. Among the mRNAs potentially targeted by miR‐205, identified using the miRGen database (Megraw et al., 2007), we selected a component of the extracellular matrix named LAMC1. This protein has been implicated in a wide variety of biological processes including cell adhesion, differentiation, proliferation, migration, signaling, neurite outgrowth and metastasis, and it is altered in human hepatocellular carcinoma (Lietard et al., 1997), breast cancer (Valladares et al., 2006) and glioblastoma, where it is targeted by miR‐124a (Fowler et al., 2011).
We first observed the down‐modulation of LAMC1 protein levels (but not in mRNA level, data not shown) in MDA‐MB‐231 breast cancer cells transfected with miR‐205 precursor molecule (Figure 4A, upper panel) in comparison with a scrambled oligonucleotide (Figure 4A, lower panel). Similar results were obtained in BT‐549 cells (Supplementary Figure 8A). Conversely, transfection with the anti‐miR‐205 in SUM‐149 cells increased LAMC1 protein expression (Supplementary Figure 8B). A luciferase reporter assay was then performed to demonstrate a direct regulation: the reporter vector containing 244 bp of LAMC1‐3′UTR, including the binding site for miR‐205 (Figure 4B, upper panel), was cotransfected in HEK‐293 cells with miR‐205 precursor molecule or a scrambled oligonucleotide as a control, and the luciferase activity was significantly decreased (∼30% reduction, p < 0.05) after miR‐205 overexpression (Figure 4B, lower panel). Moreover, the mutation of the miR‐205 binding site in LAMC1 3′UTR prevented the downregulation of luciferase expression.
Figure 4.
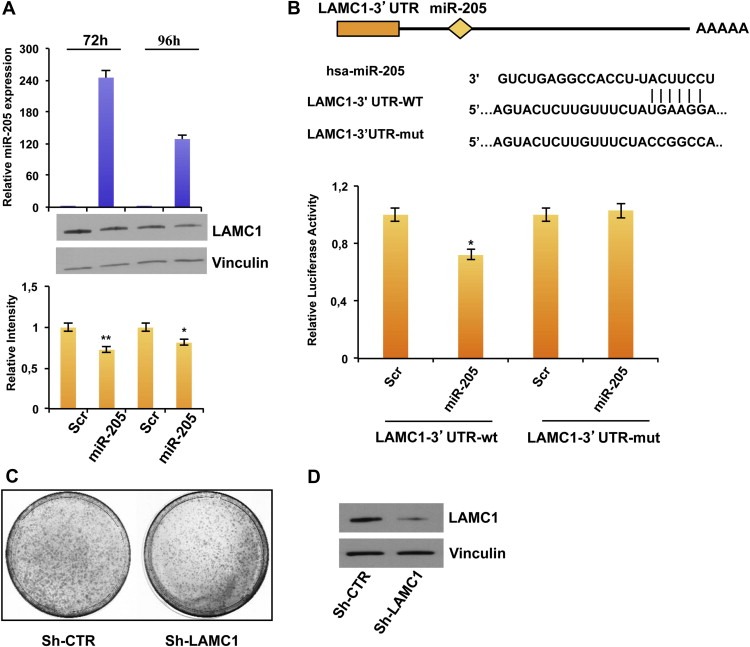
miR‐205 directly regulates LAMC1. (A) Transfection of MDA‐MB‐231 cells with 100 nmol/L pre–miR‐205 or a scrambled oligonucleotide and collection of RNA and proteins after 72 h and 96 h. miR‐205 expression was evaluated by real‐time PCR (upper panel). LAMC1, and Vinculin as loading control, were quantified by western blot (middle panel). Densitometric analysis of LAMC1 bands is reported in the lower panel. (B) Schematic representation of the interaction between miR‐205 and the binding site on the wild‐type LAMC1‐3′UTR and the mutated control. Luciferase activities (lower panel) for LAMC1‐3′UTR‐wt and LAMC1‐3′UTR‐mut plasmids were determined 24 h after transfection of HEK‐293 cells. The results are representative of 4 independent experiments. Bars indicate S.D. calculated on 3 different replicates (p < 0.05). (C) Phenocopy experiment showing the inhibition of colony formation obtained by transfecting MDA‐MB‐231 cells with a vector encoding a shRNA silencing LAMC1 (sh‐LAMC1) compared with the corresponding empty vector (sh‐CTR) and (D) Down‐modulation of LAMC1 protein (evaluated by western blot) 48 h after transfection.
To evaluate whether the biological effects exerted by miR‐205 were partially mediated also by regulation of LAMC1, we performed phenocopy experiments. To this aim, we performed a colony forming assay on MDA‐MB‐231 cells transfected with a plasmid encoding an shRNA specifically directed against LAMC1 (sh‐LAMC1) or the corresponding empty vector (sh‐CTR) (Figure 4D). As shown in Figure 4C, direct knock down of LAMC1 consistently decreased the ability to form colonies (35% reduction compared to the sh‐CTR transfected cells).
To verify the inverse correlation between miR‐205 and LAMC1 also in breast cancer samples, we performed IHC and in situ hybridization for LAMC1 and miR‐205, respectively, using a TMA including 111 breast cancer samples. Supplementary Figure 9A–B shows the high LAMC1 levels in the analyzed samples (45%). As well as for E2F1, we did not observe a significant correlation (p = 0.0681, Yates' p‐value) between LAMC1 and miR‐205 expressions. However, by correcting the statistical analysis excluding double positive cases in which miR‐205 and LAMC1 were not expressed by the same cells (using the Nuance system, Supplementary Fig. 9C), we observed a significant inverse correlation between miR‐205 and LAMC1 expression. These data further indicate that miR‐205 targets LAMC1 also in breast cancer tissues.
3.4. Transcriptional regulation of miR‐205
Human miR‐205 (hsa‐miR‐205) is located within the hypothetical gene LOC642587 at chromosome 1q32.2 region, where pre–miR‐205 overlaps the junction between the third intron and the fourth exon of LOC642587. It has not been demonstrated yet whether miR‐205 has its own promoter or is co‐regulated by LOC642587, and mechanisms regulating the expression of miR‐205 and the consequent biological reasons responsible for the downregulation of this microRNA in breast cancer have not been identified yet. The only evidence reported to date is the two fold increase in miR‐205 levels in MCF7 treated with demethylating agent 5‐aza‐2′‐deoxycytidine (Wu and Mo, 2009), consistent with the presence of a CpG island about 300 bp before the first exon of the host gene (Bhatnagar et al., 2010). However, a deeper investigation of additional possible mechanisms regulating miR‐205 expression has not been performed to date.
To address this issue, first of all, taking into account the identified transcription starting site of miR‐205 (Bhatnagar et al., 2010), a 7333 bp sequence upstream miR‐205 coding region has been analyzed using a bioinformatic program (Promoter 2) for the presence of putative promoter regions. We focused on the region immediately upstream the first exon of LOC642587 (scored as “highly likely predicted”, HPR). To determine whether this region (Figure 5A) could represent the miR‐205 transcriptional promoter, we constructed reporter plasmids by inserting fragments of 2 kb spanning this region into the promoterless vector pGL3 basic, upstream the luciferase gene.
Figure 5.
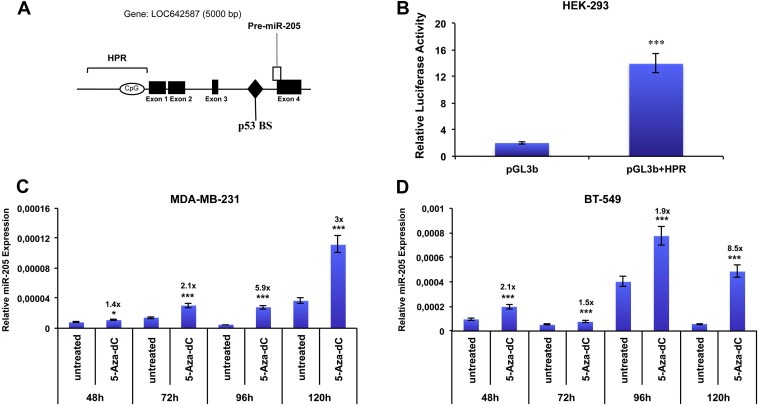
Identification of miR‐205 transcriptional region (A) Schematic representation of the genomic miR‐205 locus: miR‐205 is located at human chromosome 1q32.2 locus and its precursor lies between the third intron and the fourth exon of the hypothetical gene named LOC642587. Bar referred as HPR indicates the genomic region analyzed (highly predicted as potential promoters by promoter 2.1 software). (B) Promoter activity of region HPR was measured by luciferase assay after 24 h of transfection of HEK‐293 cells with pgl3 basic vector carrying region HPR. Values are the mean ± S.D. of three independent experiments (p < 0.001). (C–D) treatment of MDA‐MB‐231 (C) and BT‐549 (D) Cells with 10 μM 5‐Aza‐dC and collection of RNA at indicated time points (48–120 h). miR‐205 expression was evaluated by qRT‐PCR. Results are the mean of 3 independent experiments. Bars represent S.D. calculated on 3 replicates (*p < 0.05; **p < 0.01; ***p < 0.001).
HEK‐293 cells were transfected with the obtained vectors and luciferase activity quantified 24 h after transfection. Cells transfected with the vector containing the HRP region displayed a luciferase activity higher (fold change is about 7 folds, p < 0.001) than cells transfected with the empty vector, suggesting that this region exerts a promoter activity on miR‐205 expression (Figure 5B).
Based on the previous reported data suggesting the potential role of methylation on the regulation miR‐205 levels (Wu and Mo, 2009), we analyzed the effect of the demethylating agent 5‐Aza‐2′‐deoxycytidine (5‐Aza‐dC) on miR‐205 expression in two TN cell lines (MDA‐MB‐231 and BT‐549). Cells were treated with 10 μM 5‐Aza‐dC and harvested at different time points (48–120 h). As shown in Figure 5C–D, 5‐Aza‐dC treatment significantly increased miR‐205 expression, compared to untreated controls, at different time points in both cellular systems.
3.5. P53 enhances miR‐205 expression
With the aim to further investigate the mechanisms regulating miR‐205 expression, we used UCSC Genome Browser to analyze the presence of potential binding sites for transcription factors, and we found a p53 binding site (p53BS) approximatively 1 kb upstream the pre–miR‐205 genomic sequence. In order to investigate p53 effect on miR‐205 expression, we first transfected HEK‐293 with different amounts of a p53‐encoding vector or with the corresponding empty vector. Results confirmed efficient overexpression of p53 in a dose dependent manner (Figure 6A upper and lower panel respectively) and showed an upregulation of miR‐205 only in presence of the higher dose of p53 (Figure 6 middle panel), indicating that there is probably a p53‐threshold level that has to be overcome in order to activate miR‐205 expression. To further confirm this result, we transfected the same cell line (HEK‐293) with a p53‐specific siRNA (or a corresponding control siRNA), thus obtaining a strong inhibition of endogenous p53‐expression (Figure 6B upper and lower panel). As shown in Figure 6B (middle panel), silencing of p53 led to a drastic suppression of miR‐205 expression. To determine whether miR‐205 expression could be restored in a breast cancer cell line carrying high levels of a mutated form of p53 and that does not express miR‐205, we next transfected MDA‐MB‐231 cells with a p53‐encoding vector (or the corresponding empty vector). P53 levels were analyzed after 48 h of transfection and the expression of p21‐encoding CDKN1A, a p53 target gene, was also assessed to verify p53 functionality (Figure 6C, lower panel). As reported in Figure 6C (upper panel), reintroduction of wt p53 in this cell line is able to double miR‐205 expression (p < 0.01), indicating that the absence of a functional p53 protein in this cell line could at least partially explain the low levels of miR‐205.
Figure 6.

P53 activates miR‐205 expression. (A) Transfection of wt p53 in HEK‐293 cells induces miR‐205 upregulation in a dose dependent manner. P53 levels after transfection were evaluated by qRT‐PCR and by western Blot. miR‐205 levels were measured by qRT‐PCR. (B) p53 silencing in HEK‐293 cells (verified by both quantitative qRT‐PCR and western blot) significantly (p < 0.001) reduces endogenous miR‐205 level, as indicated by qRT‐PCR experiment. (C) Transfection of wt p53 in MDA‐MB‐231 cells (carrying a mutated form of p53) enhances miR‐205 levels as measured by qRT‐PCR (p < 0.001). (D–E) MCF7 cells were transfected with 100 nM siRNA‐CTR or siRNA‐p53 and treated 24 h after transfection with Nutlin‐3a (D) and 5‐FU (E) for 24 or 48 h. Induction of miR‐205 (measured by qRT‐PCR, p < 0.01) is abrogated when p53 is silenced. Western blot analysis was performed for p53 detection. (F) Semi‐quantitative RT‐PCR for the miR‐205 host gene expression after Nutlin‐3a or 5‐FU treatment in MCF7 cells. GAPDH expression was also quantified as control.
To confirm the responsiveness of miR‐205 to p53, a cell line carrying a wt p53, MCF7 was treated with Nutlin‐3a, a small molecule that antagonizes the p53 inhibitor MDM2, or vehicle (DMSO), followed by qRT‐PCR (Figure 6D upper panel) to monitor miRNA levels upon p53 accumulation (Figure 6D lower panel). Induction of miR‐205 transcription was detected after 24 and 48 h of Nutlin‐3a treatment in MCF7 cells. MCF7 cells were also treated with the chemotherapy agent 5‐FU (5‐fluorouracil), able to mediate p53 activation (Figure 6E lower panel) for 24 or 48 h. As reported in Figure 6E (upper panel), this DNA‐damaging agent is able to induce miR‐205 expression in a wt p53 breast cancer cell line (p < 0.01). In order to verify that the effects of Nutlin and 5‐FU are indeed p53‐dependent, drug treatment was also performed after transfection with a siRNA directed against p53. As shown in Figure 6D–E, the induction of miR‐205 by those agents was abolished when p53 is knocked‐down. Expression of miR‐205 following Nutlin‐3a treatment was in line with miR‐205 host gene modulation (evaluated by sqRT‐PCR, Figure 6F), suggesting a possible co‐transcription of miR‐205 and its host gene.
In addition, to determine if the transcriptional regulation exerted by p53 and by the 5‐AZA‐dC demethylating agent on miR‐205 could be additive, MCF7 cells were treated with Nutlin‐3a and 5‐AZA‐dC alone or combined, and miR‐205 expression was then evaluated. Supplementary Figure 10A shows that, in the presence of both drugs, miR‐205 expression displayed an increase that was higher in comparison with the single Nutlin‐3a or 5‐AZA‐dC treatment. Notably, 5‐AZA‐dC treatment was also able to enhance endogenous p53 levels (Supplementary Figure 10B), as previously reported (Zhu et al., 2004).
3.6. P53 binds to and positively regulates the miR‐205 upstream region
In order to clarify the p53‐dependent transcription‐enhancing activity of the predicted p53 binding sequence, we performed a luciferase reporter assay, using a pGL3‐promoter reporter construct containing 2000 bp sequence named p53 binding region (p53BR). Saos‐2 cells (p53‐deficient human osteosarcoma cells) were transfected with the reporter vector (named pGL3p + p53BR) in presence of two different doses of a p53‐encoding vector or the corresponding empty vector (Figure 7A, lower panel). The region analyzed yielded a robust p53‐dependent transcriptional activity (Figure 7A, upper panel).
Figure 7.
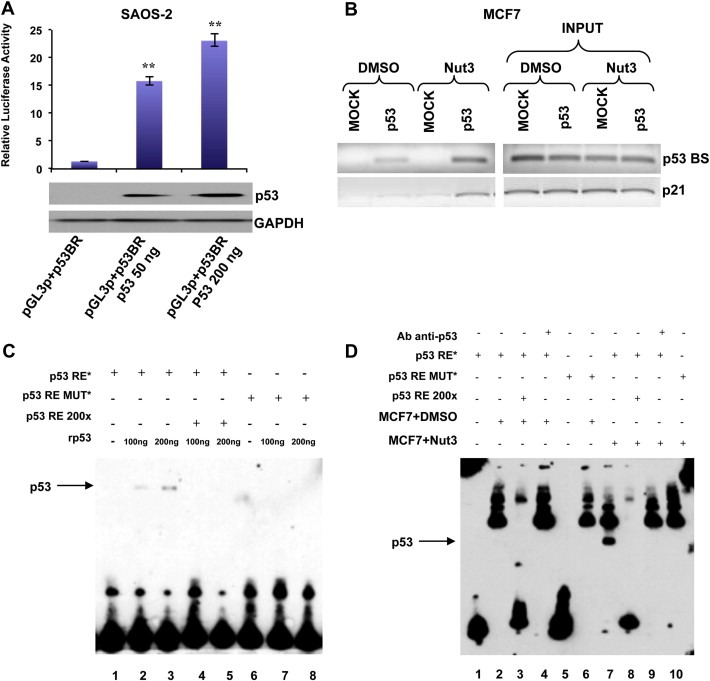
P53 directly binds a responsive element on miR‐205 regulatory sequences. (A) Luciferase assay of region containing p53 binding site (p53BR) in SAOS‐2 cells (p53 null) after transfection of two different doses of p53. P53 levels after transfection were evaluated by western blot. (B) Binding of p53 to miR‐205 regulatory sequences. Cross‐linked chromatin was prepared from MCF7 cells (p53 wt) treated or not with 10uM Nutlin‐3 for 24 h and subjected to ChIP assay. Binding of p53 to p21 promoter was used as control of p53 activation after Nutlin‐3 treatment. (C) EMSA showing the DNA binding activity of p53 on the miR‐205 regulatory sequences. One or two hundred ng or of recombinant wild‐type p53 (rp53) were added to the reaction (except lane 1 and lane 6) in presence of wild‐type oligonucleotide encompassing the p53‐responsive element (p53RE*) (lane 1,2,3,4,5) or mutated oligonucleotides (p53RE MUT*) (lane 6,7,8). A 200‐fold excess of wild‐type oligonucleotide, encompassing the p53‐responsive element (wt) (lane 4 and 5), was used as a control of the p53‐specific binding. (D) EMSA showing the increased binding of p53 on miR‐205 regulatory sequences after Nutlin‐3a treatment in MCF7 cells. Fifteen μg of nuclear lysate from non‐treated (MCF7+DMSO) and treated cells (MCF7+Nut3) were added to the reaction in presence of wild‐type oligonucleotide encompassing the p53‐responsive element (p53RE*) (lane 1,2,3,4,7,8,9) or mutated oligonucleotides (p53RE MUT*) (lane 5,6,10). A 200‐fold excess of wild‐type oligonucleotide encompassing the p53‐responsive element (wt) (lane 3 and 8), and anti‐p53 antibody (200 ng) were added to the reaction.
Indeed, to demonstrate the binding of p53 to the predicted consensus sequence, we performed a Chromatin Immunoprecipitation Assay (ChIP). MCF7 cells were treated for 36 h with Nutlin‐3a (Supplementary Figure 10C). As reported in Figure 7B, p53 binding to his predicted consensus sequence occurred in untreated MCF7 cells and became stronger after p53 activation upon Nutlin‐3a treatment. As a positive control, we used the p53 consensus site on the CDKN1A promoter.
In addition, we conducted an Electrophoretic Mobility Shift Assay (EMSA). Two different doses of p53 recombinant protein (rp53) were incubated with a double stranded biotin‐labeled primer of 30 nucleotides (p53‐responsive element, p53RE) encompassing the p53BS. The p53 recombinant protein was also incubated with the biotin‐labeled p53RE in the presence of a 200× molar excess of unlabeled p53RE. Finally, we incubated the p53 recombinant protein with a mutated biotin‐labeled p53RE. As shown in Figure 7C, the p53 recombinant protein was able to bind and shift the biotin‐labeled p53RE, and this binding was impaired by the molar excess of unlabeled p53RE. No binding and shift was observed when the mutant p53RE was incubated with the p53 recombinant protein.
To demonstrate that also the endogenous p53 protein was able to specifically interact with the biotin‐labeled p53RE, we incubated this double stranded oligonucleotide with a nuclear protein extract from MCF7 cells, treated with DMSO or with 10 uM Nutlin‐3a (Supplementary Figure 10D). As shown in Figure 7D, a band corresponding to the complex p53/p53RE was observed only following Nutlin‐3a treatment. Moreover, we found the complex only in the presence of the wild‐type biotin‐labeled p53RE, and not in the presence of the mutated p53RE and the formation of this complex was affected by the presence of a 200× molar excess of the unlabeled p53RE. We also pre‐incubated the nuclear protein extract with an anti‐p53 antibody, in order to obtain the formation of a p53/p53RE/anti‐p53 antibody complex (super‐shift) but, likely because of the presence of a high background, we were not able to detect a super‐shifted band.
Taken together, these data demonstrate that p53 is able to directly bind the miR‐205 upstream region, driving the upregulation of miR‐205 expression.
4. Discussion
The decision to shed more light on the role of miR‐205 in TNBC is supported by the evidence that this is a very aggressive subgroup of breast carcinomas still lacking an effective targeted therapy, where miR‐205 is one of the most significantly underexpressed microRNAs (Radojicic et al., 2011) and where its functional role and regulation have not been clearly elucidated yet.
To this aim, we first analyzed a wide panel of triple negative breast cancer cell lines, observing that this microRNA is expressed at significantly lower levels compared to a Normal‐like breast cell line. Interestingly, in a very recent paper (Prat and Perou, 2011), the cell lines we analyzed were classified as belonging to a very undifferentiated subgroup, named claudin‐low, associated to low or absent expression of adhesion molecules, luminal differentiation markers, high enrichment for epithelial‐to‐mesenchymal transition markers, immune response genes and cancer stem cell‐like features. Notably, the only cell line that displays a higher miR‐205 expression, SUM‐149, does not belong to the claudin‐low subgroup, further supporting the idea that miR‐205 loss could be considered a valid marker of an undifferentiated, mesenchymal and aggressive phenotype.
Choosing the TNBC cell lines MDA‐MB‐231 and BT‐549 as cellular models, in this study we show that reintroduction of miR‐205 not only leads to a dramatic reduction of both proliferation, cell cycle progression and clonogenic potential in vitro, but it also significantly inhibits the in vivo tumor growth in xenograft models.
Concerning the identification of new miR‐205 target genes, we demonstrated that this microRNA directly targets LAMC1, encoding the γ‐chain of the laminin‐1. This protein has multiple biological activities including promotion of cell adhesion, proliferation, migration, differentiation and enhancement of the metastatic phenotype of tumor cells. Phenocopy experiments demonstrated that LAMC1 silencing is, at least in part, responsible of the growth inhibition mediated by miR‐205.
In addition, we also demonstrated that miR‐205 directly targets the transcription factor E2F1, master regulator of the G1/S transition, at both mRNA and protein levels. Reduced expression of this protein in MDA‐MB‐231 stable clones overexpressing miR‐205 results in a slower cell cycle progression. Moreover, miR‐205 overexpression resulted in increased induction of cellular senescence, a process which is negatively regulated by E2F protein family (Maehara et al., 2005). Also in this case phenocopy experiments confirmed that E2F1 silencing could be responsible of the impaired cell cycle progression observed in miR‐205 overexpressing cells. These findings further suggest that miR‐205 is able to influence cell cycle progression and cell fate, through the targeting of E2F1.
Subsequently, since the mechanisms responsible for miR‐205 downregulation in breast cancer have not been elucidated yet, we defined the promoter region of this microRNA and searched for conserved transcription factor binding sites.
We first showed that miR‐205 expression could be modulated by the demethylating agent 5‐AZA‐dC, possibly through miR‐205 promoter demethylation or modulation of transcriptional factor involved in its regulation.
Interestingly, we also demonstrated that the tumor suppressor p53 is able to induce miR‐205 expression in different cellular models, and that this effect is mediated by its direct binding on a responsive element located upstream this microRNA.
Considering the high frequency of TP53 mutations in basal‐like breast cancer (44–82%) (Sorlie et al., 2001), the transcriptional induction of miR‐205 by p53 may have important implications. First, the reduced expression or the occurrence of inactivating mutations of TP53 or the presence of a wt but non active p53 might justify the reduced levels or the completely loss (as in the case of TNBC) of miR‐205 in breast cancer. Moreover, the direct targeting of E2F1 mediated by miR‐205, likely to be responsible of the cell cycle arrest observed in our experimental models, might be a new alternative regulatory mechanism used by p53 to influence the cell fate to an anti‐proliferative choice. Indeed, it is widely demonstrated that p53 activation blocks the release of E2F1 from its inhibitor pRB, through the transcriptional activation of p21 (waf‐1/cip‐1), which in turn negatively regulates several complexes of cyclin/cyclin dependent kinases (cdks) involved in the negative regulation of pRB and in the cell cycle progression from the G1 to the S‐phase. Our data suggest that miR‐205 might represent a novel pRB‐independent mediator of the regulation of E2F1, initiated by p53 in order to prevent cell cycle progression.
In conclusion, we demonstrated that miR‐205 is a novel transcriptional target of p53, and that it exerts a role as oncosuppressor in triple negative breast cancer, and in particular in a model representative of the most undifferentiated and mesenchymal subgroup, through the regulation, at least in part, of the two newly identified target genes, E2F1 and LAMC1, thus resulting in reduced cellular proliferation, both in vitro and in vivo.
Conflict of interest
The authors declare no conflict of interest.
Supporting information
The following are the Supplementary data related to this article:
Fig. S1 miR‐205 is downregulated in TNBC. miR‐205 expression levels in a panel of 10 TN breast cancer cell lines and one Normal‐like evaluated by qRT‐PCR and normalized on U6 levels.
Fig. S2 Validation of miR‐205 expression. (A–B) qRT‐PCR validating miR‐205 overexpression after MDA‐MB‐231 (A) and BT‐549 (B) transfection with a plasmid encoding miR‐205 (Vec‐miR‐205) in comparison with control vector transfected cells.
Fig. S3 miR‐205 effects on cell cycle progression in BT‐549 cells (A) Cell cycle analysis of asynchronously growing BT‐549 miR‐Vec (BT‐Vec) and Vec‐miR‐205 (BT‐205) bulk populations. Cells were harvested after 72 h following the seeding, fixed, stained with propidium iodide and analyzed by flow cytometry. The data obtained were analyzed using ModFit software. Cells in G1 and in G2 phase of cell cycle are reported in red, cells in S phase are indicated with white and blue bars. Flow cytometry plots shown are representative of three independent experiments. (B) Graphic representation of relative percentage of cells in G1, S, or G2 phase. Percentages of cells in each compartment are means of three independent experiments.
Fig. S4 miR‐205 effect on apoptosis. (A) Caspase 3/7 activation following transient transfection of MDA‐MB‐231 cells with 100 nmol/L pre–miR‐205 or a scrambled oligonucleotide for 72/96 h. (B) qRT‐PCR showing efficient overexpression of miR‐205 after transfection.
Fig. S5 miR‐205 effect on cell cycle progression. (A) Cell cycle analysis of MDA‐MB‐231 VEC, MDA‐MB‐231 205 #2 and MDA‐MB‐231 205 #20 clones. Cells were synchronized in G1 by a thymidine double block, released in complete medium and collected after 2, 4, 6, 8 h from this release. The data obtained were analyzed using ModFit software. Cells in G1 and in G2 phase of cell cycle are reported in red, cells in S phase are indicated with white and blue bars. Flow cytometry plots shown are representative of three independent experiments. (B) Graphic representation of the percentage of G1 cells at different time points from the thymidine double block release. Values were normalized on the percentage in G1 found at T = 0 h. Values are the mean ± S.D. of three independent experiments. (C) Total extracts from BT‐549 miR‐Vec and BT‐549 Vec‐miR‐205 bulk populations were analyzed by Western Blot for E2F1 detection (upper panel). Densitometric analysis of E2F1 bands in lower panel.
Fig. S6 (A) miR‐205 directly targets E2F1. Transfection of BT‐549 cells with 100 nmol/L pre–miR‐205 or a scrambled oligonucleotide and collection of RNA and proteins after 72 h and 96 h. miR‐205 expression was evaluated by real‐time PCR. E2F1 mRNA levels was evaluated by qRT‐PCR and protein levels were quantified by Western blot. (B) Transfection of SUM‐149 cells with 100 nmol/L or 200 nmol/L anti‐miR‐205 or anti‐scr oligonucleotide and collection of RNA and proteins after 72 h. miR‐205 expression and E2F1 mRNA levels were evaluated by qRT‐PCR and E2F1 protein levels by Western blot. (C) E2F1 effect on cell cycle progression in MDA‐MB‐231 cells. Cell cycle analysis of MDA‐MB‐231 transfected with a vector encoding a shRNA silencing E2F1 (sh‐E2F1) compared with the corresponding empty vector (sh‐CTR). The data obtained were analyzed using ModFit software. Cells in G1 and in G2 phase of cell cycle are reported in red, cells in S phase are indicated with white and blue bars. Flow cytometry plots shown are representative of three independent experiments.
Fig. S7 . Inverse correlation between E2F1 and miR‐205 expression in breast cancer samples: (A) Representative image of IHC (Brown) and in situ (Blue) staining for E2F1 and miR‐205 expression, respectively. The image shows the 20× magnification of one out the 117 samples included in the analyzed TMA. (B) The table summarizes the number of cases positive for miR‐205 and E2F1 staining by IHC and in situ analysis performed in A. (C) Nuance analysis of miR‐205 (Blue) and E2F1 (Red) and merge (Yellow) staining. The image shows the 20× magnification of the same sample analyzed in A.
Fig. S8 miR‐205 directly regulates LAMC1. (A) Transfection of BT‐549 cells with 100 nmol/L pre–miR‐205 or a scrambled oligonucleotide and collection of RNA and proteins after 72 h and 96 h. miR‐205 expression was evaluated by real‐time PCR. LAMC1, and Vinculin as loading control, were quantified by Western blot. (B) Transfection of SUM‐149 cells with 100 nmol/L or 200 nmol/L anti‐miR‐205 or anti‐scr oligonucleotide and collection of RNA and proteins after 72 h. miR‐205 expression was evaluated by qRT‐PCR and LAMC1 protein levels by Western blot.
Fig. S9 Inverse correlation between LAMC1 and miR‐205 expression in breast cancer samples: (A) Representative image of IHC (Brown) and in situ (Blue) staining for LAMC1 and miR‐205 expression, respectively. The image shows the 20× magnification of one out the 111 samples included in the analyzed TMA. (B) The table summarizes the number of cases positive for miR‐205 and LAMC1 staining by IHC and in situ analysis performed in A. (C) Nuance analysis of miR‐205 (Blue) and LAMC1 (Red) staining. The image shows the 20× magnification of the same sample analyzed in A.
Fig. S10 Nutlin‐3a and 5‐AZA‐dC treatment in MCF7 cells (A) MCF7 cells were treated with 10 μM Nutlin‐3a or 10 μM 5‐AZA‐dC alone or together for 24 h and miR‐205 expression was evaluated by qRT‐PCR. (B) p53 accumulation after drug treatment was quantified by Western blot (C) MCF7 cells (carrying wt p53) were treated with 10 μM Nutlin‐3a and 36 h after treatment subjected to Western Blot analysis for p53 detection. (D) MCF7 cells were treated with 10 μM Nutlin‐3a for 36 h and then nuclear and cytoplasmic protein were differentially extracted. Obtained lysates were subjected to Western Blot analysis for p53 detection.
Acknowledgements
We are thankful to Hansjuerg Alder and the Nucleic Acid Shared Resource of the Ohio State University for Real‐Time experiments. This work was partially supported by Associazione Italiana per la Ricerca sul Cancro (AIRC). Dr. CM Croce is supported by Grants from the National Cancer Institute. Dr. MV Iorio is supported by Start Up AIRC Grant. Dr. D Palmieri is supported by FIRC (Federazione Italiana Ricerca sul Cancro) international fellowship.
Supplementary data 1.
1.1.
Supplementary data related to this article can be found online at doi:10.1016/j.molonc.2012.03.003.
Piovan Claudia, Palmieri Dario, Di Leva Gianpiero, Braccioli Luca, Casalini Patrizia, Nuovo Gerard, Tortoreto Monica, Sasso Marianna, Plantamura Ilaria, Triulzi Tiziana, Taccioli Cristian, Tagliabue Elda, Iorio Marilena V., Croce Carlo M., (2012), Oncosuppressive role of p53‐induced miR‐205 in triple negative breast cancer, Molecular Oncology, 6, doi: 10.1016/j.molonc.2012.03.003.
References
- Baker, S.J. , Markowitz, S. , Fearon, E.R. , Willson, J.K. , Vogelstein, B. , 1990. Suppression of human colorectal carcinoma cell growth by wild-type p53. Science. 249, 912–915. [DOI] [PubMed] [Google Scholar]
- Bhatnagar, N. , Li, X. , Padi, S.K. , Zhang, Q. , Tang, M.S. , Guo, B. , 2010. Downregulation of miR-205 and miR-31 confers resistance to chemotherapy-induced apoptosis in prostate cancer cells. Cell Death Dis.. 1, e105 [DOI] [PMC free article] [PubMed] [Google Scholar]
- Dar, A.A. , Majid, S. , de Semir, D. , Nosrati, M. , Bezrookove, V. , Kashani-Sabet, M. , 2011. miRNA-205 suppresses melanoma cell proliferation and induces senescence via regulation of E2F1 protein. J. Biol. Chem.. 286, 16606–16614. [DOI] [PMC free article] [PubMed] [Google Scholar]
- Di Leva, G. , Gasparini, P. , Piovan, C. , Ngankeu, A. , Garofalo, M. , Taccioli, C. , Iorio, M.V. , Li, M. , Volinia, S. , Alder, H. , Nakamura, T. , Nuovo, G. , Liu, Y. , Nephew, K.P. , Croce, C.M. , 2010. MicroRNA cluster 221-222 and estrogen receptor alpha interactions in breast cancer. J. Natl. Cancer Inst.. 102, 706–721. [DOI] [PMC free article] [PubMed] [Google Scholar]
- Docquier, A. , Harmand, P.O. , Fritsch, S. , Chanrion, M. , Darbon, J.M. , Cavailles, V. , 2010. The transcriptional coregulator RIP140 represses E2F1 activity and discriminates breast cancer subtypes. Clin. Cancer Res.. 16, 2959–2970. [DOI] [PMC free article] [PubMed] [Google Scholar]
- Farazi, T.A. , Horlings, H.M. , Ten Hoeve, J.J. , Mihailovic, A. , Halfwerk, H. , Morozov, P. , Brown, M. , Hafner, M. , Reyal, F. , van Kouwenhove, M. , Kreike, B. , Sie, D. , Hovestadt, V. , Wessels, L.F. , van de Vijver, M.J. , Tuschl, T. , 2011. MicroRNA sequence and expression analysis in breast tumors by deep sequencing. Cancer Res.. 71, 4443–4453. [DOI] [PMC free article] [PubMed] [Google Scholar]
- Fowler, A. , Thomson, D. , Giles, K. , Maleki, S. , Mreich, E. , Wheeler, H. , Leedman, P. , Biggs, M. , Cook, R. , Little, N. , Robinson, B. , McDonald, K. , 2011. miR-124a is frequently down-regulated in glioblastoma and is involved in migration and invasion. Eur. J. Cancer. 47, 953–963. [DOI] [PubMed] [Google Scholar]
- Gandellini, P. , Folini, M. , Longoni, N. , Pennati, M. , Binda, M. , Colecchia, M. , Salvioni, R. , Supino, R. , Moretti, R. , Limonta, P. , Valdagni, R. , Daidone, M.G. , Zaffaroni, N. , 2009. miR-205 Exerts tumor-suppressive functions in human prostate through down-regulation of protein kinase Cepsilon. Cancer Res.. 69, 2287–2295. [DOI] [PubMed] [Google Scholar]
- Gregory, P.A. , Bert, A.G. , Paterson, E.L. , Barry, S.C. , Tsykin, A. , Farshid, G. , Vadas, M.A. , Khew-Goodall, Y. , Goodall, G.J. , 2008. The miR-200 family and miR-205 regulate epithelial to mesenchymal transition by targeting ZEB1 and SIP1. Nat. Cell Biol.. 10, 593–601. [DOI] [PubMed] [Google Scholar]
- Iorio, M.V. , Casalini, P. , Piovan, C. , Di Leva, G. , Merlo, A. , Triulzi, T. , Menard, S. , Croce, C.M. , Tagliabue, E. , 2009. microRNA-205 regulates HER3 in human breast cancer. Cancer Res.. 69, 2195–2200. [DOI] [PubMed] [Google Scholar]
- Iorio, M.V. , Croce, C.M. , 2009. MicroRNAs in cancer: small molecules with a huge impact. J. Clin. Oncol.. 27, 5848–5856. [DOI] [PMC free article] [PubMed] [Google Scholar]
- Iorio, M.V. , Ferracin, M. , Liu, C.G. , Veronese, A. , Spizzo, R. , Sabbioni, S. , Magri, E. , Pedriali, M. , Fabbri, M. , Campiglio, M. , Menard, S. , Palazzo, J.P. , Rosenberg, A. , Musiani, P. , Volinia, S. , Nenci, I. , Calin, G.A. , Querzoli, P. , Negrini, M. , Croce, C.M. , 2005. MicroRNA gene expression deregulation in human breast cancer. Cancer Res.. 65, 7065–7070. [DOI] [PubMed] [Google Scholar]
- Lietard, J. , Musso, O. , Theret, N. , L'Helgoualc'h, A. , Campion, J.P. , Yamada, Y. , Clement, B. , 1997. Sp1-mediated transactivation of LamC1 promoter and coordinated expression of laminin-gamma1 and Sp1 in human hepatocellular carcinomas. Am. J. Pathol.. 151, 1663–1672. [PMC free article] [PubMed] [Google Scholar]
- Maehara, K. , Yamakoshi, K. , Ohtani, N. , Kubo, Y. , Takahashi, A. , Arase, S. , Jones, N. , Hara, E. , 2005. Reduction of total E2F/DP activity induces senescence-like cell cycle arrest in cancer cells lacking functional pRB and p53. J. Cell Biol.. 168, 553–560. [DOI] [PMC free article] [PubMed] [Google Scholar]
- Majid, S. , Saini, S. , Dar, A.A. , Hirata, H. , Shahryari, V. , Tanaka, Y. , Yamamura, S. , Ueno, K. , Zaman, M.S. , Singh, K. , Chang, I. , Deng, G. , Dahiya, R. , 2011. MicroRNA-205 inhibits Src-mediated oncogenic pathways in renal cancer. Cancer Res.. 71, 2611–2621. [DOI] [PMC free article] [PubMed] [Google Scholar]
- Martin, G.R. , Timpl, R. , 1987. Laminin and other basement membrane components. Annu. Rev. Cell Biol.. 3, 57–85. [DOI] [PubMed] [Google Scholar]
- Megraw, M. , Sethupathy, P. , Corda, B. , Hatzigeorgiou, A.G. , 2007. miRGen: a database for the study of animal microRNA genomic organization and function. Nucleic Acids Res.. 35, D149–D155. [DOI] [PMC free article] [PubMed] [Google Scholar]
- Nuovo, G. , Lee, E.J. , Lawler, S. , Godlewski, J. , Schmittgen, T. , 2009. In situ detection of mature microRNAs by labeled extension on ultramer templates. Biotechniques. 46, 115–126. [DOI] [PMC free article] [PubMed] [Google Scholar]
- Polager, S. , Ginsberg, D. , 2009. p53 and E2f: partners in life and death. Nat. Rev. Cancer. 9, 738–748. [DOI] [PubMed] [Google Scholar]
- Prat, A. , Perou, C.M. , 2011. Deconstructing the molecular portraits of breast cancer. Mol. Oncol.. 5, 5–23. [DOI] [PMC free article] [PubMed] [Google Scholar]
- Radojicic, J. , Zaravinos, A. , Vrekoussis, T. , Kafousi, M. , Spandidos, D.A. , Stathopoulos, E.N. , 2011. MicroRNA expression analysis in triple-negative (ER, PR and Her2/neu) breast cancer. Cell Cycle. 10, 507–517. [DOI] [PubMed] [Google Scholar]
- Sempere, L.F. , Christensen, M. , Silahtaroglu, A. , Bak, M. , Heath, C.V. , Schwartz, G. , Wells, W. , Kauppinen, S. , Cole, C.N. , 2007. Altered MicroRNA expression confined to specific epithelial cell subpopulations in breast cancer. Cancer Res.. 67, 11612–11620. [DOI] [PubMed] [Google Scholar]
- Sorlie, T. , Perou, C.M. , Tibshirani, R. , Aas, T. , Geisler, S. , Johnsen, H. , Hastie, T. , Eisen, M.B. , van de Rijn, M. , Jeffrey, S.S. , Thorsen, T. , Quist, H. , Matese, J.C. , Brown, P.O. , Botstein, D. , Eystein Lonning, P. , Borresen-Dale, A.L. , 2001. Gene expression patterns of breast carcinomas distinguish tumor subclasses with clinical implications. Proc. Natl. Acad. Sci. U S A. 98, 10869–10874. [DOI] [PMC free article] [PubMed] [Google Scholar]
- Valladares, A. , Hernandez, N.G. , Gomez, F.S. , Curiel-Quezada, E. , Madrigal-Bujaidar, E. , Vergara, M.D. , Martinez, M.S. , Arenas Aranda, D.J. , 2006. Genetic expression profiles and chromosomal alterations in sporadic breast cancer in Mexican women. Cancer Genet. Cytogenet.. 170, 147–151. [DOI] [PubMed] [Google Scholar]
- Wu, H. , Mo, Y.Y. , 2009. Targeting miR-205 in breast cancer. Expert Opin. Ther. Targets. 13, 1439–1448. [DOI] [PubMed] [Google Scholar]
- Wu, H. , Zhu, S. , Mo, Y.Y. , 2009. Suppression of cell growth and invasion by miR-205 in breast cancer. Cell Res.. 19, 439–448. [DOI] [PMC free article] [PubMed] [Google Scholar]
- Zhu, W.G. , Hileman, T. , Ke, Y. , Wang, P. , Lu, S. , Duan, W. , Dai, Z. , Tong, T. , Villalona-Calero, M.A. , Plass, C. , Otterson, G.A. , 2004. 5-aza-2'-deoxycytidine activates the p53/p21Waf1/Cip1 pathway to inhibit cell proliferation. J. Biol. Chem.. 279, 15161–15166. [DOI] [PubMed] [Google Scholar]
Associated Data
This section collects any data citations, data availability statements, or supplementary materials included in this article.
Supplementary Materials
The following are the Supplementary data related to this article:
Fig. S1 miR‐205 is downregulated in TNBC. miR‐205 expression levels in a panel of 10 TN breast cancer cell lines and one Normal‐like evaluated by qRT‐PCR and normalized on U6 levels.
Fig. S2 Validation of miR‐205 expression. (A–B) qRT‐PCR validating miR‐205 overexpression after MDA‐MB‐231 (A) and BT‐549 (B) transfection with a plasmid encoding miR‐205 (Vec‐miR‐205) in comparison with control vector transfected cells.
Fig. S3 miR‐205 effects on cell cycle progression in BT‐549 cells (A) Cell cycle analysis of asynchronously growing BT‐549 miR‐Vec (BT‐Vec) and Vec‐miR‐205 (BT‐205) bulk populations. Cells were harvested after 72 h following the seeding, fixed, stained with propidium iodide and analyzed by flow cytometry. The data obtained were analyzed using ModFit software. Cells in G1 and in G2 phase of cell cycle are reported in red, cells in S phase are indicated with white and blue bars. Flow cytometry plots shown are representative of three independent experiments. (B) Graphic representation of relative percentage of cells in G1, S, or G2 phase. Percentages of cells in each compartment are means of three independent experiments.
Fig. S4 miR‐205 effect on apoptosis. (A) Caspase 3/7 activation following transient transfection of MDA‐MB‐231 cells with 100 nmol/L pre–miR‐205 or a scrambled oligonucleotide for 72/96 h. (B) qRT‐PCR showing efficient overexpression of miR‐205 after transfection.
Fig. S5 miR‐205 effect on cell cycle progression. (A) Cell cycle analysis of MDA‐MB‐231 VEC, MDA‐MB‐231 205 #2 and MDA‐MB‐231 205 #20 clones. Cells were synchronized in G1 by a thymidine double block, released in complete medium and collected after 2, 4, 6, 8 h from this release. The data obtained were analyzed using ModFit software. Cells in G1 and in G2 phase of cell cycle are reported in red, cells in S phase are indicated with white and blue bars. Flow cytometry plots shown are representative of three independent experiments. (B) Graphic representation of the percentage of G1 cells at different time points from the thymidine double block release. Values were normalized on the percentage in G1 found at T = 0 h. Values are the mean ± S.D. of three independent experiments. (C) Total extracts from BT‐549 miR‐Vec and BT‐549 Vec‐miR‐205 bulk populations were analyzed by Western Blot for E2F1 detection (upper panel). Densitometric analysis of E2F1 bands in lower panel.
Fig. S6 (A) miR‐205 directly targets E2F1. Transfection of BT‐549 cells with 100 nmol/L pre–miR‐205 or a scrambled oligonucleotide and collection of RNA and proteins after 72 h and 96 h. miR‐205 expression was evaluated by real‐time PCR. E2F1 mRNA levels was evaluated by qRT‐PCR and protein levels were quantified by Western blot. (B) Transfection of SUM‐149 cells with 100 nmol/L or 200 nmol/L anti‐miR‐205 or anti‐scr oligonucleotide and collection of RNA and proteins after 72 h. miR‐205 expression and E2F1 mRNA levels were evaluated by qRT‐PCR and E2F1 protein levels by Western blot. (C) E2F1 effect on cell cycle progression in MDA‐MB‐231 cells. Cell cycle analysis of MDA‐MB‐231 transfected with a vector encoding a shRNA silencing E2F1 (sh‐E2F1) compared with the corresponding empty vector (sh‐CTR). The data obtained were analyzed using ModFit software. Cells in G1 and in G2 phase of cell cycle are reported in red, cells in S phase are indicated with white and blue bars. Flow cytometry plots shown are representative of three independent experiments.
Fig. S7 . Inverse correlation between E2F1 and miR‐205 expression in breast cancer samples: (A) Representative image of IHC (Brown) and in situ (Blue) staining for E2F1 and miR‐205 expression, respectively. The image shows the 20× magnification of one out the 117 samples included in the analyzed TMA. (B) The table summarizes the number of cases positive for miR‐205 and E2F1 staining by IHC and in situ analysis performed in A. (C) Nuance analysis of miR‐205 (Blue) and E2F1 (Red) and merge (Yellow) staining. The image shows the 20× magnification of the same sample analyzed in A.
Fig. S8 miR‐205 directly regulates LAMC1. (A) Transfection of BT‐549 cells with 100 nmol/L pre–miR‐205 or a scrambled oligonucleotide and collection of RNA and proteins after 72 h and 96 h. miR‐205 expression was evaluated by real‐time PCR. LAMC1, and Vinculin as loading control, were quantified by Western blot. (B) Transfection of SUM‐149 cells with 100 nmol/L or 200 nmol/L anti‐miR‐205 or anti‐scr oligonucleotide and collection of RNA and proteins after 72 h. miR‐205 expression was evaluated by qRT‐PCR and LAMC1 protein levels by Western blot.
Fig. S9 Inverse correlation between LAMC1 and miR‐205 expression in breast cancer samples: (A) Representative image of IHC (Brown) and in situ (Blue) staining for LAMC1 and miR‐205 expression, respectively. The image shows the 20× magnification of one out the 111 samples included in the analyzed TMA. (B) The table summarizes the number of cases positive for miR‐205 and LAMC1 staining by IHC and in situ analysis performed in A. (C) Nuance analysis of miR‐205 (Blue) and LAMC1 (Red) staining. The image shows the 20× magnification of the same sample analyzed in A.
Fig. S10 Nutlin‐3a and 5‐AZA‐dC treatment in MCF7 cells (A) MCF7 cells were treated with 10 μM Nutlin‐3a or 10 μM 5‐AZA‐dC alone or together for 24 h and miR‐205 expression was evaluated by qRT‐PCR. (B) p53 accumulation after drug treatment was quantified by Western blot (C) MCF7 cells (carrying wt p53) were treated with 10 μM Nutlin‐3a and 36 h after treatment subjected to Western Blot analysis for p53 detection. (D) MCF7 cells were treated with 10 μM Nutlin‐3a for 36 h and then nuclear and cytoplasmic protein were differentially extracted. Obtained lysates were subjected to Western Blot analysis for p53 detection.