

Abstract
In active networks, excitatory and inhibitory synaptic inputs generate membrane voltage fluctuations that drive spike activity in a probabilistic manner. Despite this, some cells in vivo show a strong propensity to precisely lock to the local field potential and maintain a specific spike-phase relationship relative to other cells. In recordings from rat medial entorhinal cortical stellate cells, we measured spike phase-locking in response to sinusoidal “test” inputs in the presence of different forms of background membrane voltage fluctuations, generated via dynamic clamp. We find that stellate cells show strong and robust spike phase-locking to theta (4–12 Hz) inputs. This response occurs under a wide variety of background membrane voltage fluctuation conditions that include a substantial increase in overall membrane conductance. Furthermore, the IH current present in stellate cells is critical to the enhanced spike phase-locking response at theta. Finally, we show that correlations between inhibitory and excitatory conductance fluctuations, which can arise through feedback and feedforward inhibition, can substantially enhance the spike phase-locking response. The enhancement in locking is a result of a selective reduction in the size of low-frequency membrane voltage fluctuations due to cancellation of inhibitory and excitatory current fluctuations with correlations. Hence, our results demonstrate that stellate cells have a strong preference for spike phase-locking to theta band inputs and that the absolute magnitude of locking to theta can be modulated by the properties of background membrane voltage fluctuations.
Introduction
Numerous intracellular in vivo cortical and hippocampal recordings have established the prevalence of stochastic membrane voltage fluctuations that drive spike activity in a probabilistic manner (Paré et al., 1998; Destexhe and Paré, 1999; Harvey et al., 2009; Epsztein et al., 2010). Neuronal spike timing in vivo, however, is often characterized by a precise relationship to the local field potential that arises from coordinated population activity. This behavior is often referred to as phase coupling or spike phase-locking and it is believed to be a mark of the precise temporal relationship between different cells as wells as an indicator of temporal coding (Fox et al., 1986; Stewart et al., 1992; O'Keefe and Recce, 1993; Csicsvari et al., 1999; Fries et al., 2001; Klausberger et al., 2003; Buzsáki and Draguhn, 2004; Klausberger and Somogyi, 2008; Rutishauser et al., 2010). Accordingly, understanding the factors involved in establishing spike phase-locking in neurons requires taking into consideration the interplay between the stochastic synaptic background activity arising from network activity as well as the intrinsic membrane properties of neurons.
Like many cells in the hippocampal region, layer II stellate cells of medial entorhinal cortex (MEC) lock strongly to the local theta (4–12 Hz) field potential while receiving stochastic fluctuating inputs in vivo (Alonso and García-Austt, 1987; Stewart et al., 1992; Frank et al., 2001; Quilichini et al., 2010; Brandon et al., 2011). Stellate cell phase-locking, and thus temporal coding, are hypothesized to be driven by intrinsic properties (Alonso and Llinás, 1989; Haas and White, 2002). Several groups (O'Keefe and Burgess, 2005; Burgess et al., 2007; Giocomo et al., 2007; Brandon et al., 2011; Koenig et al., 2011) have hypothesized further that intrinsically driven stellate cell phase-locking contributes to the grid-like receptive fields of MEC cells (Hafting et al., 2005). For these reasons, the mechanisms of stellate cells phase-locking are of considerable general interest.
In our previous work we established that stellate cells, when driven by fluctuating, conductance-based inputs, fail to generate autonomous theta oscillations (Fernandez and White, 2008), seemingly in conflict with the above-cited results. However, a potential frequency preference at theta frequencies that leads to greater spike phase-locking to theta band inputs has not been studied. Thus, while stellate cells may not generate autonomous oscillations they may still support an amplification of theta inputs via an intrinsic preference for these inputs.
To understand the relationship between synaptic activity, membrane voltage fluctuations, and spike timing, we recorded from stellate cells in acute rat brain slices. We used dynamic clamp to simulate different types of background activity taking into account the possible conductance and correlation properties of excitatory and inhibitory synaptic activity present in vivo, and probed spike phase-locking in response to sinusoidal test inputs. We find that intrinsic cellular mechanisms endow stellate cells with a strong and robust preference for locking to theta inputs under a variety of conditions that include both low and high conductance states. Nevertheless, the magnitude of spike phase-locking can be modulated by the statistical properties of background synaptic activity.
Materials and Methods
Tissue preparation.
All experimental protocols were approved by the University of Utah Institutional Animal Care and Use Committee. Horizontal sections of hippocampus and entorhinal cortex were prepared from 22- to 35-d-old Long–Evans rats of either sex. All chemicals were obtained from Sigma-Aldrich unless otherwise noted. After anesthetization with isoflurane and decapitation, brains were removed and immersed in 0°C solution consisting of the following (in mm): 215 sucrose, 25 NaHCO3, 20 d-glucose, 2.5 KCl, 0.5 CaCl2, 125 NaH2PO4, and 3 MgCl2, buffered to pH 7.4 with 95/5% O2/CO2. Horizontal slices were cut to a thickness of 400 μm (Leica VT 1200; Leica Microsystems). After the cutting procedure, slices were incubated in artificial CSF (ACSF) at 30°C for 20 min before being cooled to room temperature (20°C). The ACSF consisted of the following (in mm): 125 NaCl, 25 NaHCO3, 25 d-glucose, 2 KCl, 2 CaCl2, 1.25 NaH2PO4, and 1 MgCl2, and buffered to pH 7.4 with 95/5% O2/CO2. After the incubation period, slices were moved to the stage of an infrared differential interference contrast-equipped microscope (Axioscop 2+; Zeiss). On occasion, ACSF containing 10 μm CNQX, 50 μm picrotoxin, and 30 μm AP-5 was used to block ionotropic synaptic activity and test the effect of background activity on membrane resistance. We did not observe any significant effect on membrane resistance with application of these drugs. All recordings were conducted between 32 and 34°C.
Electrophysiology.
Electrodes were drawn on a horizontal puller (P97; Sutter Instruments) and filled with an intracellular solution consisting of the following (in mm): 120 K-gluconate, 20 KCl, 10 HEPES, 7 diTrisPhCr, 4 Na2ATP, 2 MgCl2, 0.3 Tris-GTP, and 0.2 EGTA, and buffered to pH 7.3 with KOH. Final electrode resistances were between 3 and 4 MΩ, with access resistance values between 4 and 12 MΩ. Electrophysiological recordings were performed with a current-clamp amplifier (Axoclamp 2B; Molecular Devices), and data were acquired using custom software developed in MATLAB (v. 2011; MathWorks) using the data acquisition toolbox.
For dynamic clamp experiments, the current-clamp amplifier was driven by an analog signal from an ×86 personal computer running Real-Time Application Interface Linux and an updated version of the Real-Time Linux Dynamic Clamp called Real-Time eXperimental Interface (Bettencourt et al., 2008). For all experiments, a noisy synaptic stimulus was generated using two independent conductances representing synaptic inhibition (gi) and excitation (ge) as follows:
The reversal potentials for inhibition (Ei) and excitation (Ee) were set to −75 and 0 mV, respectively. As in previous studies (Destexhe et al., 2001; Fellous et al., 2003), the terms gi(t) and ge(t) were implemented using Ornstein–Uhlenbeck (OU) processes and modeled using the following equations:
 |
In the above equations, ḡi and ḡe represent the mean conductance for inhibition and excitation. Di and De represent the diffusion coefficients and χi and χe are Gaussian white noise terms with unit standard deviation (SD). The terms τi and τe correspond to the time constant for inhibition and excitation, which were set to 8 and 2 ms, respectively. In addition, Di and De were set so that SD ratio between gi and ge fluctuations (ρ) of 4, 2, or 1 were generated. A SD of ∼1.5 mV was used for membrane voltage output.
The correlation between inhibition and excitation was manipulated by introducing correlation in the random Gaussian processes controlling inhibition and excitation. Correlations were set using the following equation:
In the above, χi and χe are Gaussian random variables associated with inhibition and excitation, while χr is independent of χe. The term c is the correlation coefficient relating the correlation magnitude between χi and χe.
For experiments with fluctuations and added conductance, ḡi and ḡe were kept at a 4:1 ratio and set to 12 and 3 nS, respectively, so that mean current amplitudes would be approximately balanced. In experiments where ḡi and ḡe were set to 12 and 3 nS (high conductance), gi and ge were not rectified. This was not an issue as the mean values for gi and ge were sufficiently far from zero that fluctuations did not cross zero and become negative. For conditions where fluctuations were added without a mean conductance component (ḡi and ḡe = 0, low conductance), conductances were rectified so that a negative conductance was always avoided. Under these conditions, a small mean positive conductance (∼1 nS) was introduced at some time points by the rectified gi and ge fluctuations.
In cases where conductance was added without membrane voltage fluctuations, a simple linear leak conductance was introduced via dynamic clamp using the equation:
For these experiments, Eleak was set to −75 mV. For all experiments, the sample rate of the dynamic clamp was set to 10 kHz. A measured junction potential of ∼10 mV was subtracted from all recordings and taken into account during dynamic clamp experiments. Data were collected between 5 and 20 kHz and filtered at 3 kHz.
Analysis and statistics.
All analyses were performed in MATLAB using custom software and/or built in functions. Spike times were determined using a threshold crossing for membrane voltage. Spike phase-locking index (vector strength) is defined as summed normalized vector length of circular data and provides a measure of phase-locking of a series of spiking events relative to an ongoing oscillation. Spike phase-locking index was calculated using the following equation:
 |
where T = period of modulation frequency, tj = spike times. Each eiωti is then a unit length vector representing the phase of the spike. Phase-locking index was defined as the length (modulus) of the vector p (see Fig. 1B). For each measure of phase-locking index at a given modulation frequency, the total number of spikes (n) was always >1700 (700 s recordings at an average firing rate of ∼2.5 spikes/s). Modulation frequencies of 1, 2, 5, 8, 12, 15, and 30 Hz were used and applied via a small (20 pA peak-to-peak) sinusoidal current injection in the presence of membrane voltage fluctuations.
Figure 1.

Changes in membrane conductance and correlations in inhibitory (gi) and excitatory (ge) synaptic conductance activity modulate spike phase-locking in MEC stellate cells. A, Example spike response and subthreshold voltage histograms (top) as well as average spike phase histograms (bottom) for stellate cells given sinusoidal current input. For spike phase histograms, example shows a stellate cell driven by sinusoidal current inputs (frequency = 1, 5, 8, 30 Hz) in the presence background synaptic fluctuations generated with low (A1) and high (A2) membrane conductance or correlated (A3) artificial synaptic activity. B, Circular plot of binned spike phases (relative to a 5 Hz sinusoidal input) with low conductance background synaptic fluctuations. The arrow indicates the average phase of all spikes, while the length of the arrow indicates the strength of locking. C, Plot of the average spike phase-locking indices in response to sinusoidal current inputs of different frequencies (1, 5, 8, 12, 15, 30 Hz) measured in the presence of the three different types of synaptic conductance-mediated membrane voltage fluctuations outlined in A (low, high, and correlated). Asterisks indicate significant difference between correlated versus low or high conductance conditions (p < 0.001). D, Q-value (ratio of spike phase-locking indices at 5 and 1 Hz) measured in the presence of background synaptic fluctuations generated with low (gray) and high (black) membrane conductance or correlated (red) artificial synaptic activity. E, Phase-locking indices measured in response to 5 Hz sinusoidal input under low (gray) and high (black) membrane conductance or correlated (red) artificial synaptic activity.
Power spectra were calculated using MATLAB's psd or pwelch functions. For experiments using filtered current input noise, we constructed a white noise process in the frequency domain and applied the following first order filters to generate low-pass or bandpass current noise:
 |
The low-pass (τ = 0.01 s) filter was used to construct current input noise with a spectra similar to current input delivered during uncorrelated synaptic input. The combination of low- and high-pass (τ = 0.03 s) filters was used to generate a bandpass current input with a spectra similar to that observed using certain correlated inputs (see Fig. 7A). MATLAB's ifft function was used to implement an inverse Fourier transform and generate the time series from signals constructed in the frequency domain.
Figure 7.

Reducing power of low-frequency membrane voltage fluctuations increases spike phase-locking to low-frequency sinusoidal inputs. A, Power spectra of artificially constructed current inputs using a low-pass (black) or bandpass (gray) filter (see Materials and Methods). B, Plot of the average spike phase-locking indices resulting from sinusoidal current inputs of different frequencies measured in the presence of background voltage fluctuations generated using low-pass (black) or bandpass (gray) filters. C, Example of average spike phase histograms for a stellate cell driven by sinusoidal current input (frequency = 1, 5, 8, 30 Hz) measured in the presence of voltage fluctuations generated using artificial current input with low-pass (C1) or bandpass (C2) characteristics.
The current protocol for input impedance measurements consisted of a Gaussian current input that was filtered at 100 Hz (same as the low-pass filtered signal above). Impedance (Z(f)) measures were calculated by taking the ratio of the fast Fourier transform of the membrane voltage response (V) and current input (I) stimulus:
 |
For multiple comparisons, statistical significance was determined using either a one- or two-way ANOVA. For repeated measures of means, statistical difference was determined using Tukey's honestly significant criteria. A t test (one- or two-sample) was used when comparing one or two means. Means are presented along with the SEM.
Mathematical results.
In this section we derive the mathematical relationship describing how correlated synaptic inputs shape the power spectra of synaptic inputs. This relationship allowed us to quickly and rigorously determine the major factors that shape synaptic power spectra (see Fig. 4), making predictions that suggested specific methods of data analysis (see Figs. 5, 6), as well as follow-up experiments (Fig. 7) that strongly tested the theoretical predictions. Consider a passive neural membrane receiving the same inputs used in our experiments:
 |
where χx are white noises for x = e,i and , for 0 < c < 1, consistent with Equation 3.
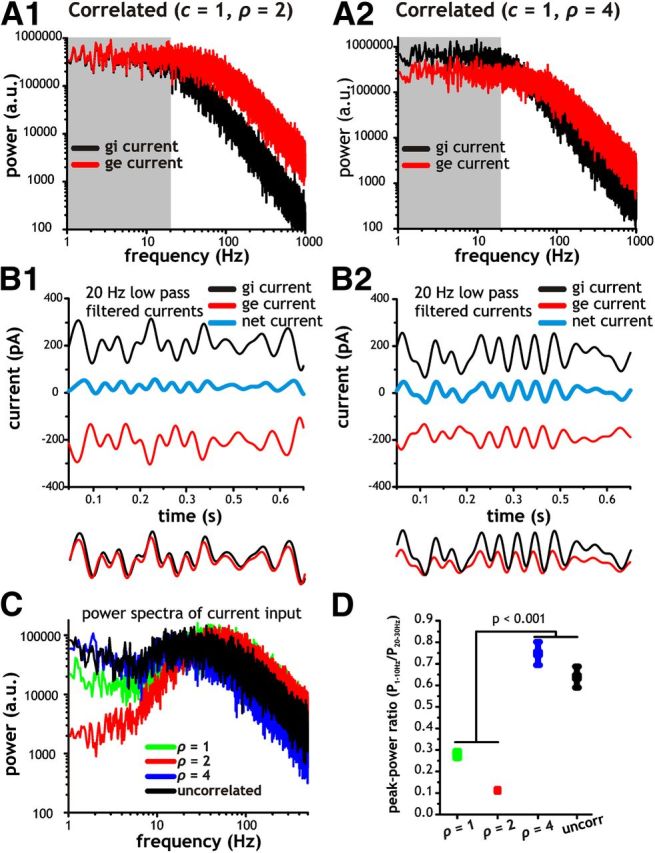
Figure 4.

Reduction of low-frequency input fluctuations depends on correlation strength (c), SD ratio (ρ) and synaptic decay time constants of gi and ge conductance fluctuations. A, Analytically derived power spectra for total synaptic current using c = 1 with ρ = 2 (A1) and ρ = 4 (A2). Parameter locations in color map (C) from which power spectra were calculated are indicated with a green (ρ = 2) and orange (ρ = 4) dot. B, Power spectra for inhibitory (black) and excitatory (red) synaptic currents associated with A using c = 1 along with ρ = 2 (B1) and ρ = 4 (B2). C, Color map indicating degree of non-monotonicity (increased non-monotonicity indicated with dark red) as a function of c and ρ using time constants for inhibition (τi) and excitation (τe) of 8 and 2 ms, respectively. The non-monotonicity index was calculated by taking the ratio of power at the peak frequency and power at 0 Hz. In the case of monotonic spectra, the index was set to 0. Non-monotonicity indices >5 were capped at a value of 5. D, Color map indicating degree of non-monotonicity as a function of τi and τe using c = 0.8 and ρ = 2. Non-monotonicity was calculated using an index identical to C. E, Power spectra of total synaptic current input (E1) as well as the individual inhibitory (E2, black) and excitatory (E2, red) currents resulting from using τi and τe of 6 and 4 ms, respectively. The power spectrum profile for total synaptic current input (E1) is monotonic (E1, gray shaded region). F, Power spectra of total synaptic current input (F1) as well as the individual inhibitory (F2, black) and excitatory (F2, red) currents resulting from using τi and τe of 12 and 2 ms, respectively. Parameter locations in color map (D) from which power spectra were calculated are indicated with a red (τi and τe of 6 and 4 ms) and blue (τi and τe of 12 and 2 ms) dot. Notice that the power spectrum profile for total synaptic current input (F1) is non-monotonic and has a selective reduction in power at low frequencies (F1, gray shaded region) compared with the case shown in E1.
Figure 5.
Correlations in synaptic conductance inputs induce cancellation of inhibitory and excitatory currents at low frequencies. A, Example power spectra of inhibitory (black) and excitatory (red) currents associated with artificial synaptic stimuli using ρ = 2 (A1) and 4 (A2). B, Low-pass filtered (20 Hz cutoff) traces of inhibitory (black) and excitatory (red) currents with ρ = 2 (B1) and 4 (B2). The blue traces indicate the net instantaneous difference between inhibitory and excitatory currents within the 20 Hz cutoff range. Below the plots, the filtered traces for the corresponding inhibitory and excitatory have been superimposed (excitatory current is mirrored) for the purposes of comparison. C, Example power spectra of total synaptic current delivered via dynamic clamp. D, Plot of average ratio of total power between 1 and 10 Hz versus 20 and 30 Hz (P1–10 Hz/P20–30 Hz) under each of the four different background synaptic conditions. Notice that as in our analytical results (Fig. 4), conditions with ρ = 1 and 2 generate total synaptic input current fluctuations with a substantial reduction in low-frequency power.
Figure 6.

Correlations in synaptic conductance inputs selectively reduce the power of membrane voltage fluctuations at low frequencies. A, Example power spectra of membrane voltage fluctuations mediated by artificial synaptic activity incorporating correlated (c = 1) or uncorrelated gi and ge fluctuations implemented with ρ = 1, 2, and 4. B, Plot of average integrated power between 1 and 10 Hz under each of the four different synaptic stimuli used in A. Notice that membrane voltage fluctuations generated with ρ = 1 or 2 contained significantly less power at low frequencies compared with stimuli generated with uncorrelated gi and ge or ρ = 4.
Also, in this section we refer to the following parameter combination: C = 1 μF/cm2, EL = −60 mV, gL = 0.1 mS/cm2, Ee = 0 mV, ḡe = 0.05 mS/cm2, Ei = −75 mV, ḡi = 0.2 mS/cm2, and 0 ≤ c ≤ 1.
In the experiments is assumed constant, where σx for x = c,i are the SDs of the excitatory and inhibitory input conductance noises, respectively. To replicate such condition on ρ, we recall that the stationary SD of each OU process is well known (for x = e,i), so we assume the following:
 |
where Dc = 0.0001.
We can consider the input current
 |
and look for the power spectrum of I(t) (referred to as total synaptic input current; see Results), which we label PSI. In particular, we are interested in assessing the role of the parameters c, ρ, τe, and τi in the monotonicity of PSI. We first derive an approximated form for I(t), and then use the Weiner–Khinchine theorem (Pécseli, 2000), which guarantees that we can compute PSI as the Fourier transform of the autocorrelation function of I(t).
To find I(t), we need to derive an approximated solution to System 8. The multiplicative role of noise in the first equation makes the derivation of a closed analytic solution impossible, hence we will use a voltage estimate in Equation 10. We first perform an Effective Time Constant Approximation (Richardson and Gerstner, 2005) as follows:
 |
where g0 = gL + ḡe + ḡi and E0 = (gLEL + ḡeEe + ḡiEi)/g0. We label g̃x(t) = gx(t) − ḡx for x = e,i. In fact, Richardson and Gerstner (2005) have shown that the main Gaussian properties of the voltage distribution are captured in this approximation, which is the leading order solution to the full conductance-based model in the presence of synaptic shot noise. To further simplify our derivation, we consider the following:
treating each conductance as a white noise process. This approximation can be chosen in additive noise problems, though it treats the autocorrelation of each noise process (excitatory and inhibitory) as a delta function. Then the first equation in System 11 becomes the following:
 |
which suggest to consider
 |
as σ̃e and σ̃i are the SDs of the white noises used in Equation 13. Note that the parameter ρ acquires a specific role in this redefined problem. In fact, if we consider the ratio (in absolute value) of the new SDs as follows:
 |
we can see how in physiological ranges of the reversal potentials the ratio (E0 − Ei)/(E0 − Ee) controls the range of values of ρ, so that the conductance noises will have comparable variations.
Equation 13 can now be solved with standard It̄o calculus:
 |
where χx(t)dt = dBtx for x = e,i. The equations in System 8 defining the OU processes give the following:
 |
 |
(The assumptions gx > 0 for x = e,i, necessary to the above derivation, are satisfied throughout the experimental conditions). We can therefore merge Equations 16–18 in Equation 10 to obtain our approximated I(t) stochastic process.
To compute PSI(f), we need the autocorrelation of I(t), which we calculate as follows:
 |
Note that the expectation is taken with respect to trials, i.e., over noise, and that because of causality (our experiments have an initial time, t = 0), all our calculations have been performed in positive time.
We find that the stationary autocorrelation of the synaptic current in System 11 is given by the linear combination of three decaying exponentials, one per timescale in the system:
where
 |
 |
and
 |
Now PSI is the squared modulus of the Fourier transform of Equation 20. The transform is given by the following:
 |
and the relative sizes and signs of the linear factors Fg0, Fτe, and Fτi will establish if the power spectrum of I(t) is monotonic or not.
The squared modulus of this complex function at every f value is the sum of the square of its real and imaginary part:
 |
which provides the analytical expression for PSI we were looking for.
We can now explore the parameter space (c,ρ,τe,τi) ∈ [0,1]×[0,+∞)3⊂ℝ4, with respect to the monotonicity in the power spectrum of I(t). To do that, we define a function ℳ:ℝ4 → ℝ+ that is zero whenever PSI is monotonic, and is the ratio between the peak value of PSI and its initial value when it is non-monotonic. For any given (c,ρ,τe,τi), let m = maxfϵ[0,+∞](PSI(f)) and f* the frequency at which such maximum is found. Then
 |
Examples of the resulting ℳ values in subspaces are reported in Figure 4.
We can also compute the power spectrum for the excitatory and inhibitory synaptic current, separately:
Using the same procedure as for I(t), we get the following:
 |
where
 |
 |
Analogously, in the inhibitory current we get the following:
 |
where
 |
 |
Equations (29) and (32) define the curves reported in Figure 4, A, B, E, and F.
Results
MEC stellate cells preferentially lock to theta inputs under a variety of background conditions
Our goal in this study was to understand the intrinsic and synaptic factors establishing spike phase-locking in stellate cells. Although previous work has implicated stellate cells in theta network activity (Alonso and García-Austt, 1987; Stewart et al., 1992; Frank et al., 2001; Quilichini et al., 2010; Brandon et al., 2011; Burgalossi et al., 2011; Koenig et al., 2011), the ability for stellate cell spike output to preferentially amplify or lock to theta inputs has not been studied. In addition, we were interested in how spike phase-locking is potentially modulated under fluctuation-driven spiking consistent with the in vivo state. To achieve these aims, we embedded stellate cells in an artificial synaptic environment constructed in dynamic clamp using OU processes. Through the use of OU processes, we could approximate in vivo membrane voltage conditions using a variety of parameters to control synaptic inputs, and also drive spikes in a probabilistic manner (Destexhe et al., 2001; Fernandez et al., 2011). Because we introduce the artificial inputs at the cell body, mimicking inputs as measured somatically in vivo, our results necessarily focus on how spiking is affected by particular patterns of somatic voltage, current, and conductance, ignoring how dendritic inputs give rise to those patterns.
To start, we tested three distinct forms of background synaptic activity consistent with a range of different background synaptic input fluctuations measured in vivo. First, we constructed a background synaptic stimulus that provided stochastic fluctuations in membrane voltage without introducing a substantial change in stellate cell membrane conductance (∼1 nS, low conductance). Second, we used a stimulus that significantly increased overall membrane conductance (15 nS, high conductance) while preserving the SD in membrane voltage fluctuations of the low conductance condition. The total conductance was the sum of mean inhibitory and excitatory processes with values of 12 and 3 nS, respectively. Testing the role of both low and high conductance synaptic activity is important as in vivo data has indicated that voltage fluctuations may or may not be associated with a change in average input resistance (Waters and Helmchen, 2006; Cardin et al., 2008). Finally, we used a stimulus similar to the second, but with temporal correlations between inhibitory and excitatory synaptic conductance fluctuations. Recent data indicate that cortical circuits are often characterized by the presence of feedforward and feedback inhibition (Pouille and Scanziani, 2001; Heiss et al., 2008; Atallah and Scanziani, 2009; Franks et al., 2011; Isaacson and Scanziani, 2011; Suzuki and Bekkers, 2012). As a result of this connectivity, activation of cortical circuits leads to highly correlated and proportional levels of excitation and inhibition (Anderson et al., 2001; Shu et al., 2003; Wehr and Zador, 2003; Heiss et al., 2008; Okun and Lampl, 2008; Atallah and Scanziani, 2009; Adesnik and Scanziani, 2010; Franks et al., 2011). The magnitude of correlation underlying the random processes (Eq. 3; see Materials and Methods) was set initially to a value of 1, which due to differences in the time constants between gi and ge fluctuations produced a peak correlation between the two fluctuating conductances of ∼0.8 (Okun and Lampl, 2008; Adesnik and Scanziani, 2010). For all three conditions, we maintained the SD of membrane voltage fluctuations constant and used small amounts of current injection to keep cells at an average firing rate of 2.5 Hz (Fig. 1A). The choice of mean spike rate (∼2.5 Hz) and voltage fluctuations (∼1.5–2 mV SD) was based on in vivo observations from MEC stellate cells indicating low and variable spike rates generated by random membrane voltage fluctuations (Frank et al., 2001; Quilichini et al., 2010; Burgalossi et al., 2011). For all recordings, the membrane voltage distribution (excluding spikes) was unimodal with a range spanning −75 to −65 mV (Fig. 1A1–A3, top) and average SD values of 2.0 ± 0.1 mV, 1.9 ± 0.1 mV, and 1.8 ± 0.04 mV for low conductance, high conductance, and correlated conditions, respectively (n = 8–22).
To evaluate the ability of stellate cells to lock at different input frequencies in the presence of stochastic voltage fluctuations, we used a small amplitude (10 or 20 pA peak-to-peak for low and high conductance, respectively) sinusoidal current input that was independent of the background synaptic activity introduced via dynamic clamp. This signal was added to the total synaptic conductance input and was varied in frequency to assess the spike phase-locking response between 1 and 30 Hz. Spike phase-locking was quantified using an index that represents the average phase preference of the spike time relative to the sinusoidal input. An index of 0 indicates no preference for the phase of the sinusoidal input and would result in a flat spike phase histogram. Conversely, an index of 1 would indicate that all spikes fired at the exact same phase of the input. This approach is very similar to previous theoretical and experimental work characterizing neuronal spike responses to time-varying inputs (Brunel et al., 2001; Fourcaud-Trocmé et al., 2003; Köndgen et al., 2008; Rutishauser et al., 2010; Wei and Wolf, 2011; Broicher et al., 2012; Kispersky et al., 2012).
As indicated in Figure 1, the spike phase-locking response in stellate cells was sensitive to the frequency of the sinusoidal test input as well as the form of background synaptic input fluctuations (Fig. 1C; p < 0.001, two-way ANOVA, n = 8–22). Notably, for all synaptic background conditions tested, spike phase-locking in stellate cells was significantly stronger in response to sinusoidal inputs in the theta range (5 and 8 Hz vs other frequencies, p < 0.001, one-way ANOVA, Tukey's test). Consequently, stellate cells show a strong spike resonance behavior at theta frequencies, while in the presence of stochastic membrane voltage fluctuations and probabilistic spike discharge.
To evaluate the relative strength of the spike resonance behavior we used the ratio of spike phase-locking indices at 1 and 5 Hz. This is analogous to the “Q-value” used for subthreshold impedance and is a measure of the relative strength of phase-locking to 5 Hz input; therefore we called this a Q-value as well. For all three conditions, the magnitude of spike resonance at theta was strong (Q-values > 1.4) but also significantly modulated by our choice of background activity. First, background synaptic fluctuations associated with an increase in membrane conductance significantly reduced the Q-value relative to a similar background with little added conductance (Fig. 1D; 1.75 ± 0.08 vs 1.49 ± 0.05, p = 0.01, Tukey's test, n = 8–22). Introducing correlations between gi and ge modestly increased the Q-value. This result, however, did not reach significance using Tukey's test (Fig. 1D; p = 0.09). In addition to a reduction in the Q-value, increasing membrane conductance led to a significant increase in spike phase-locking to high-frequency (8–30 Hz) sinusoidal inputs (Fig. 1C; p < 0.02, one-way ANOVA, Tukey's test, n = 8), while decreasing locking to 2 Hz input (Fig. 1C; p = 0.01 one-way ANOVA, Tukey's test, n = 8). Nevertheless, the spike phase-locking relationship retained a resonance profile with a peak at theta under low and high membrane conductance conditions (Fig. 1C). The largest effects on spike phase-locking, however, occurred with background synaptic activity incorporating temporal correlations between gi and ge. With correlations, there was a large enhancement of spike phase-locking to most input frequencies, including the theta range (Fig. 1C,E; p < 0.001, one-way ANOVA, n = 22). Hence, stellate cells show a strong preference for locking to theta band inputs and the overall strength of locking is significantly modulated by factors controlling the conductance and correlation properties of the background synaptic input.
Preference for theta inputs in stellate cells is established by IH
Due to the prevalence of strong spike phase-locking to theta inputs, we hypothesized that the selectivity for theta inputs in stellate cell spike activity was related to an intrinsic property and not the specific choice of artificial background synaptic stimulus. It is well established that MEC stellate cells display a prominent subthreshold resonance in the theta band that is mediated by IH and generated via suppression to low (1–3 Hz) frequency inputs (Haas et al., 2007; Nolan et al., 2007; Heys et al., 2010). It is not known, however, if the established mechanisms supporting subthreshold resonance are related to those associated with spike-firing resonance observed in Figure 1. Past work on stellate cells from our group has also shown that increased membrane conductance significantly reduces subthreshold resonance by reducing the ability for IH to influence subthreshold voltage (Fernandez and White, 2008). We hypothesized that a reduction of subthreshold resonance either through a direct reduction of IH or a change in membrane conductance should have analogous effects on spike-firing resonance.
To establish whether IH plays a role in theta frequency selectivity of the spiking behavior through its effects on subthreshold membrane resonance, we used ZD7288 (10 μm) to block IH. The efficacy of ZD7288 was determined by measuring subthreshold membrane impedance before and after application of the drug (Fig. 2A1) in the subthreshold region of membrane voltage (mean voltage: −74.9 ± 0.5 mV, max: −69.9 ± 0.8 mV, min: −78.8 ± 0.5 mV, n = 11). We quantified the subthreshold resonance at theta using a ratio of the impedance values at 5 and 1 Hz (Q-value). This value was reduced from 1.62 ± 0.1 under control to 0.8 ± 0.04 under bath application of ZD7288 (Fig. 2A2; p < 0.001, one-way ANOVA, n = 11–24). Application of the drug completely eliminated the subthreshold resonance response at theta frequencies by increasing the membrane impedance at low frequencies (Fig. 2A1). Increased membrane conductance added via dynamic clamp also reduced the Q-value. Unlike the ZD7288 condition, however, the cell retained a peak at theta albeit significantly smaller than under the low conductance condition (Fig. 2A2; 1.18 ± 0.08 vs 1.62 ± 0.1, p = 0.006, one-way ANOVA, Tukey's test, n = 7–24).
Figure 2.

Frequency selectivity of stellate cells in the theta range is mediated by a hyperpolarization-activated cation current (IH) and is modestly affected by increased membrane conductance. A1, Plot of average membrane impedance measured under control (gray), with 10 μm ZD7288 (blue) or with increased membrane conductance (black). A2, Plot of average subthreshold Q-values (ratio of impedance or spike phase-locking indices at 5 and 1 Hz) under each of the conditions outlined in A1. B1, Plot of the average spike phase-locking indices measured in response to sinusoidal current inputs of different frequencies (1, 5, 8, 12, 15, 30 Hz) under low (gray) and high (black) conductance or in the presence of 10 μm bath applied ZD7288 with (red) or without (blue) correlations in synaptic inputs. Asterisks indicate significant difference between spike phase-locking indices measured with ZD7288 (correlated or uncorrelated) versus control conditions (p < 0.001). B2, Plot of average spike Q-values under each of the conditions outlined in B1.
To measure spike phase-locking under ZD7288, we used the same frequency range and amplitude of sinusoidal current stimuli as in Figure 1. For these measures, we used a background consisting of either correlated or uncorrelated synaptic activity that included a mean conductance component. We observed that ZD7288 reduced the preference for spike phase-locking to theta inputs using either correlated or uncorrelated synaptic inputs. The loss of the spike resonance at theta was due to a significant increase in spike phase-locking strength to low-frequency (1–5 Hz) sinusoidal inputs under ZD7288 compared with low or high conductance conditions (Fig. 2B1; p < 0.01, one-way ANOVA, Tukey's test, n = 5–12). Consequently, with ZD7288, spike phase-locking to sinusoidal inputs between 1 and 8 Hz were not significantly different from each other (Fig. 2B1; p = 0.32, one-way ANOVA, n = 5–12, uncorrelated inputs, p = 0.11, one-way ANOVA, n = 6–9, correlated inputs). Similar to the changes observed in subthreshold impedance, application of ZD7288 increased the spike phase-locking response to low-frequency input under both correlated (red line) and uncorrelated (blue line) synaptic stimuli compared with the control conditions (black line), which reduced the frequency preference at theta before the drop at higher frequencies (Fig. 2B1; p < 0.001, two-way ANOVA, Tukey's test, n = 5–9). A comparison of the Q-values across low and high conductance as well as with ZD7288 using correlated or uncorrelated inputs indicated that changes in the subthreshold Q-value were qualitatively similar to those observed in the spike resonance response (Fig. 2, compare B2, A2). With ZD7288, Q-values associated with spike resonance were significantly reduced compared with measures taken under low or high conductance (Fig. 2B2; p < 0.01, one-way ANOVA, Tukey's test, n = 5–9). Furthermore, as with control conditions, correlations in synaptic inputs in the presence of ZD7288 significantly increased spike phase-locking across all frequencies tested compared with ZD7288 and no correlations (Fig. 2B1: p < 0.001, one-way ANOVA, Tukey's test, n = 5–12). Hence, correlations enhance spike phase-locking but do not by themselves bestow spike resonance.
Overall, spiking resonance was consistently higher and more resistant to our manipulations using ZD7288 and increased membrane conductance than the subthreshold resonance. Nevertheless, these results indicate that IH and the mean membrane conductance play a significant role in shaping the spike-firing resonance via their influence on subthreshold resonance behavior. As a result, subthreshold resonance in stellate cells, which selectively amplifies sinusoidal inputs at theta by reducing membrane voltage response to low frequencies (<4 Hz), provides a larger voltage response that evokes more reliable spike phase-locking to theta inputs.
Correlations in gi and ge can selectively reduce the power of low-frequency input fluctuations
Although changes in membrane conductance and a reduction of IH had a significant impact on spike phase-locking behavior, the largest changes in locking strength were observed when gi and ge were correlated. Despite introducing a high conductance state, a background stimulus using correlations in synaptic inputs nearly doubled the spike phase-locking indices in response to inputs between 1 and 15 Hz and modestly increased theta selectivity relative to the high conductance stimulus using uncorrelated synaptic inputs (Fig. 1C–E). To better understand this result, we followed by looking into how the parameters in the OU process affected spike phase-locking.
A key parameter in our OU stimulus was the correlation strength (c, from Eq. 3; see Materials and Methods). Intuitively, the correlation value controls how much gi and ge covary across time (Fig. 3A). To better understand how correlations influenced spike phase-locking, we evaluated the impact of different c values (Fig. 3A,B). We hypothesized that reductions in correlation strength would gradually reduce the enhancement in spike phase-locking. For these experiments, we limited our measure of spike phase-locking to sinusoidal test input frequencies of 2 Hz. We used correlation values between the random variables (χi and χe; see Materials and Methods) generating gi and ge activity of 1, 0.8, 0.4, and 0 (Fig. 3B). Notice that these values generated effective peak correlations between gi and ge of 0.80, 0.63, 0.32, and 0 due to differences in the time constants between gi and ge (Fig. 3B, inset). For all these experiments, the SD of membrane voltage was maintained at ∼1.5 mV. As shown in Figure 3B, decreasing the correlation strength between gi and ge led to progressively lower spike phase-locking indices (Fig. 3B; p < 0.001, one-way ANOVA, n = 8). A significant increase in spike phase-locking was maintained with c = 1 and c = 0.8 compared with the completely uncorrelated condition (Fig. 3B; p < 0.05, one-way ANOVA, Tukey's test, n = 8). Thus, the strength of correlation between inhibition and excitation is important in modulating the spike phase-locking strength.
Figure 3.

Correlations strength (c) and the relative SD (ρ) between inhibitory (gi) and excitatory (ge) synaptic conductance fluctuations modulate spike phase-locking in stellate cells. A, Example traces of inhibitory (black) and excitatory (red) synaptic conductances associated with artificial synaptic stimuli using c = 1 (top) and c = 0 (bottom) with a fixed ρ value of 1. B, Plot of the average spike phase-locking indices measured in response to sinusoidal current inputs at 2 Hz using different correlation strengths (0, 0.4, 0.8 and 1). Inset shows cross-correlation function between gi and ge under each of the correlation strength values used. C, Example traces of inhibitory (black) and excitatory (red) synaptic conductances associated with artificial synaptic stimuli using ρ = 2 (top) and 4 (bottom) with c = 1. D, Plot of the average spike phase-locking indices in response to sinusoidal current inputs of different frequencies (1, 5, 8, 12, 15, 30 Hz) measured in the presence of four different types of synaptic conductance-mediated membrane voltage fluctuations (c = 1; ρ = 1, 2, 4 and c = 0). Asterisks indicate significant difference between correlated with ρ = 1 or 2 versus uncorrelated and ρ = 4 (p < 0.001).
An additional parameter in our synaptic stimulus was the relative SDs of gi and ge fluctuations, denoted by ρ (ρ = σi/σe). Recordings performed in vivo have shown that this ratio can vary as a function of network state (Rudolph et al., 2007; Wu et al., 2008). Hence, depending on the value of ρ, the moment-by-moment synaptic current fluctuations in neurons can deviate from a perfect balance and hence change how correlations affect the moment-by-moment balancing of synaptic inhibition and excitation. We tested the effects of using three different values of ρ (ρ = 1, 2, and 4), while maintaining the correlation between gi and ge fixed at 1 (Fig. 3C,D). To our surprise, the choice of ρ had a strong effect on spike phase-locking behavior even though the SD of the membrane voltage fluctuations was identical to our previous conditions. Notably, smaller inhibitory current fluctuations relative to excitation when ρ was set to 1 or 2 were associated with enhanced spike phase-locking across different sinusoidal input frequencies (1–15 Hz) compared to when ρ was set to 4 or when gi and ge were uncorrelated (Fig. 3D; p < 0.001, one-way ANOVA, Tukey's test, n = 20).
In summary, the ability for correlations in synaptic activity to influence the spike phase-locking response was a result of both the correlation strength and the relative magnitudes of gi and ge fluctuations. Although our experimental results pointed to the importance of both these two parameters, we did not have a mechanistic understanding of how these factors affected spike phase-locking and shaped membrane voltage and synaptic inputs current fluctuations. We proceeded to analyze a simple model of membrane voltage with synaptic conductance inputs inducing fluctuations similar to our experiments.
Correlations and the SD of gi and ge shape the power spectrum of synaptic current fluctuations
As a first step to addressing how synaptic conductance input parameters (c, ρ, and synaptic kinetics) determine neuronal output, we studied a simplified model of membrane voltage in the form of an RC circuit. We wanted to precisely relate synaptic conductance fluctuations with changes in the statistics of membrane voltage fluctuations. A change in voltage could then be used to understand how correlations in synaptic conductances influence spike output. To start, we focused on the relationship between conductance inputs and membrane current and how c and ρ change total net current delivered via synaptic conductance inputs. Through an understanding of how conductance inputs and correlations influence net synaptic current we could better understand how they change membrane voltage fluctuations and ultimately spike discharge.
We modeled synaptic conductance inputs as two OU processes identical to those used in our experiments and set the time constant of the RC circuit to a value within the range measured for stellate cells (membrane time constant = 10 ms: C = 1 μF/cm2 and gleak = 0.1 mS/cm2) and used mean gi (ḡi) and ge (ḡe) values of 0.2 and 0.05 mS/cm2, respectively. The SD of ge was set to 0.01 mS/cm2, while the SD of gi was a multiple of 1, 2, or 4 of this value (i.e., ρ = 1, 2, or 4).
Previous theoretical work has shown that correlations between gi and ge can reduce the size of net synaptic current fluctuations (sum of inhibitory and excitatory currents) (Renart et al., 2010). To quantify the size or power in synaptic current input fluctuations across different frequencies, we calculated the power spectrum of the total current delivered to the RC circuit through the OU processes. Any potential reduction in the size of current fluctuations would be indicated as a reduction in power within a particular frequency range. We used an analytical approximation of our model and calculated the spectrum for total synaptic current using different parameters for the OU processes (see Materials and Methods).
For our analytical results, we initially focused on synaptic inputs with parameters set to ρ = 2 or 4 while keeping c = 1. We found that the shape of the power spectrum for total synaptic input current depends strongly on the value of ρ (Fig. 4A). When gi and ge are correlated and ρ is 2, the resulting power spectrum for total synaptic current is strongly non-monotonic with a large reduction in power at low frequencies (Fig. 4A1). On the other hand, when ρ is 4, the power spectrum has increased power at low frequencies and is monotonic in shape (Fig. 4A2). Hence, with correlations, synaptic conductance inputs with low-pass spectra (i.e., OU processes with physiological time constants) can produce net current output fluctuations with a bandpass spectrum (Fig. 4A1).
To understand how differences in the amount of power at low frequencies in the total synaptic current arise, we plotted the spectra for the individual inhibitory and excitatory currents (Fig. 4B). With ρ = 2, the amount of power at low frequencies (0–20 Hz) in inhibitory and excitatory currents is well matched (Fig. 4B1, red and black line in gray shaded area). At frequencies >20 Hz, however, the amount of power in excitatory current fluctuations is greater than that for inhibitory fluctuations. In contrast, a ρ value of 4 results in much greater power in inhibitory current fluctuations at low frequencies. Thus, as indicated by the power spectra, inhibitory and excitatory current fluctuations are closely matched in terms of magnitude at low frequencies with ρ = 2 but not with ρ = 4.
Fundamentally, the difference in power at low frequencies is related to the scaling of inhibitory and excitatory fluctuations with different ρ values. A lower ρ value is associated with smaller inhibitory fluctuations. Conversely, when ρ = 4, inhibitory fluctuations are larger and have much more power than excitatory fluctuations at low frequencies. Hence, the combination of a similar magnitude at low frequencies with ρ = 2 and high temporal correlation in gi and ge leads to mutual cancellation at low frequencies. As a consequence, inhibitory and excitatory current fluctuations cancel at low but not high frequencies. For this reason, the total synaptic current power spectrum has reduced power at low frequencies when ρ = 2 (Fig. 4A1).
To quantify the dependence of the synaptic current power spectrum on the parameters c and ρ, we generated a color map showing the degree of non-monotonicity (a measure of the selective loss of low-frequency power) as a function of c and ρ. Whenever we found a non-monotonic power spectrum, we used the ratio of peak power at a nonzero frequency (usually near 30 Hz) with the value of power at 0 Hz. Values >1 indicate a non-monotonic power spectrum and are indicated with darker shades of orange and red in Figure 4C. Increasing the correlation strength between gi and ge with ρ values near 2 results in increasingly non-monotonic synaptic current power spectra (Fig. 4C). Conversely, for low correlation strengths (<0.5) and large ρ values (>3), current power spectra are largely monotonic (Fig. 4C).
The distribution of power in inhibitory and excitatory current fluctuations is also influenced by the kinetics of synaptic decay. Faster synaptic processes have a larger fraction of power at higher frequencies, while slow processes have more power at low frequencies. Time constants for inhibition and excitation occur over a relatively narrow range of values in neurons, with inhibition being normally slower than excitation. Because of this we were interested in how different synaptic decay kinetics influence cancellation at low frequencies. Thus, in addition to ρ, the time constants of synaptic inhibition and excitation (τi and τe) should influence the degree of non-monotonicity in the synaptic current power spectrum in the presence of correlations.
To start, we froze the correlation strength and ρ value at 0.8 and 2, respectively, and varied τi and τe. As indicated, non-monotonic synaptic power spectra are more likely when τi is larger than τe (Fig. 4D). For cases when τi and τe are similar (e.g., 6 and 4 ms; Fig. 4E1), the power spectrum is monotonic because both inhibitory and excitatory conductances have a similar distribution of power across different frequencies (Fig. 4E2). As a result, when coupled with a ρ value of 2, inhibition has uniformly less power at all frequencies relative to excitation such that there is no selective cancellation of inhibitory and excitatory current fluctuations with respect to frequency. On the other hand, when τi is larger than τe (e.g., 12 and 2 ms; Fig. 4F), the distribution of power is different for inhibition and excitation (Fig. 4F2). Relative to inhibition, excitation has much more power at higher frequencies but similar power at low frequencies (Fig. 4F2). For this reason, inhibitory and excitatory synaptic current fluctuations selectively cancel at low frequencies and a non-monotonic profile for the power spectrum is generated (Fig. 4F1). Hence, for a wide range of physiologically relevant parameters the power spectrum of current input fluctuations has substantially reduced power at low frequencies when gi and ge are correlated.
Experimental verification of theoretical results
Our analytical results indicated that correlations in gi and ge shape the spectra of background current input fluctuations and could thus play a role in shaping membrane voltage and the spike phase-locking response. Before testing how the shape of the power spectrum affected the spike phase-locking response, however, we needed to verify that our data also generated reduced power in low-frequency fluctuations by measuring the power spectra of inhibitory and excitatory currents delivered via dynamic clamp in stellate cells.
To avoid contamination from spikes in the measure of power spectra, we held membrane voltage slightly below spike threshold and calculated power spectra based on 50 s long synaptic current input traces. For these experiments we did not include the sinusoidal input current delivered during measures of spike-phase locking. For contrast, we compared the power spectra and time series of inhibitory and excitatory currents in a condition predicted by our analysis to have high (ρ = 4) and low (ρ = 2) amounts of power in low-frequency synaptic current fluctuations (Fig. 4A). With ρ = 2, the power of inhibitory and excitatory currents at frequencies at or below 20 Hz was matched nearly perfectly (Fig. 5A1, gray shaded region). At frequencies >20 Hz, the amount of power in excitatory current was greater than that for inhibitory current due to excitation being faster than inhibition (2 ms vs 8 ms). In contrast, a ρ value of 4 resulted in greater power in the inhibitory current at low frequencies (<20 Hz) and greater power in the excitatory current at high frequencies (>20 Hz). Under this condition, inhibitory and excitatory currents were not matched in power across any considerable frequency range (Fig. 5A2). Hence, consistent with our mathematical results, the power spectra of inhibitory and excitatory inputs show differential amounts of power across frequency depending on the value of ρ.
We proceeded to filter the current traces using a 20 Hz low-pass filter to highlight the frequency range in which the power of inhibitory and excitatory currents differed depending on our choice of ρ. Within this frequency range, the magnitudes of inhibitory and excitatory currents associated with ρ = 2 were nearly the same size (Fig. 5B1) and hence better balanced than ρ = 4 in the same frequency range (Fig. 5B2). For this reason, and as predicated by our analytical results, the reduction in current input fluctuations at low frequencies with ρ = 2 (Fig. 5B1, blue trace) is a result of inhibitory and excitatory current fluctuations cancelling within this frequency range when gi and ge are correlated.
Next, we performed power spectrum analyses of the total artificial synaptic input current delivered via dynamic clamp. As predicated by our analytical results, correlations in gi and ge with ρ values of 1 and 2 produced highly non-monotonic power spectra with significantly less power between 1 and 10 Hz versus 20 and 30 Hz (P1–10 Hz/P20–30 Hz; Fig. 5C,D; p < 0.001, one-way ANOVA, Tukey's test, n = 9). The cancellation at low frequencies with ρ = 1 or 2 occurs because under these conditions inhibitory and excitatory synaptic currents (due to ρ, c, and synaptic kinetics) are specifically balanced and matched at low frequencies.
Reducing power of low-frequency (0–20 Hz) membrane voltage fluctuations increases spike phase-locking to theta inputs
Next, we sought to understand how the reduction in low-frequency current input fluctuations (0–20 Hz) led to an increase in spike phase-locking at theta frequencies. Past theoretical work has shown that the frequency content of background fluctuations can influence spike-phase locking. Specifically, a reduction of power in background fluctuations at high frequencies can enhance locking in that same range (Brunel et al., 2001; Wei and Wolf, 2011). In our case, we observed that the low-frequency range in which synaptic input fluctuations were reduced overlapped with the sinusoidal input frequencies in which correlations substantially improved spike phase-locking (1–15 Hz) to sinusoidal inputs. In order for a reduction in synaptic current input fluctuations at low frequencies to affect spike phase-locking behavior, however, it must also change the size of voltage fluctuations that drive probabilistic spike discharge. We reasoned that a reduction in random low-frequency membrane voltage fluctuations would reduce interference between background voltage fluctuations and the sinusoidal input signal.
To establish if membrane voltage fluctuations were indeed being selectively reduced at low frequencies with correlations and ρ values of 1 and 2, we held membrane voltage slightly below spike threshold and calculated power spectra based on 50 s long subthreshold voltage traces. As with synaptic current input, we found that the power spectrum of membrane voltage depended on both the presence of correlations and the value of ρ between gi and ge (Fig. 6). When gi and ge were correlated and ρ was equal to 1 or 2, the resulting power spectra of voltage were strongly non-monotonic with a large reduction in power at low frequencies (Fig. 6). On the other hand, when ρ was 4 or gi and ge were uncorrelated, the power spectra had increased power at low frequencies and were monotonic in shape (Fig. 6). Thus, correlated gi and ge activity with ρ of 1 or 2 reduced the power of membrane voltage fluctuations significantly between 1 and 10 Hz, relative to the other two conditions (p < 0.03, one-way ANOVA, Tukey's test, n = 9).
If all that is required to increase spike phase-locking at low frequencies is a reduction in voltage fluctuations resulting from reduced power in input current, and not other complexities associated with conductance-based inputs, it should be possible to increase spike phase-locking by constructing background fluctuations with a specific spectra incorporating reduced power at low frequencies. Hence, to test our hypothesis, we constructed an artificial current signal having a non-monotonic current input power spectrum similar to that generated when gi and ge were correlated with ρ = 1 or 2 (Fig. 7A, gray line). The current signal was constructed by applying a bandpass filter to a white noise current signal (see Materials and Methods). As before, we embedded a separate sinusoidal current input (20 pA peak-to-peak amplitude) with the background current noise to test spike phase-locking. To account for the increase in mean conductance associated with our previous OU processes, we added a separate linear leak conductance equal in magnitude to the total mean conductance added previously (15 nS). We then compared spike phase-locking to the sinusoidal input with those acquired using background noise with a monotonic current power spectrum (Fig. 7A, black line).
Using the same procedure as before, we found that spike phase-locking was significantly modulated by our choice of background noise (bandpass vs low-pass) and sinusoidal input frequency (Fig. 7B,C; p < 0.001, two-way ANOVA, n = 5). As predicted, background membrane voltage fluctuations generated through bandpass current input fluctuations were associated with significantly higher phase locking indices between 1 and 15 Hz (Fig. 7B; p < 0.002, one-way ANOVA, Tukey's test, n = 5). Thus, the increase in spike phase-locking to sinusoidal signals between 1 and 15 Hz is a result of a reduction in power of random current and voltage fluctuations that increase the signal-to-noise ratio in that frequency range. Thus, our results show that stellate cells show a strong preference for spike phase-locking to theta rhythms and that this locking can be modulated by statistical qualities of inputs that are known to vary in vivo.
Discussion
In summary, we find that MEC stellate cells have a strong and robust preference for spike phase-locking to theta inputs under both increased membrane conductance and probabilistic spike discharge. As with subthreshold resonance, the preference for theta inputs in spike output is established largely by IH. The magnitude of locking to theta inputs is also controlled by the statistical properties of background synaptic activity. By altering the spectral properties of voltage fluctuations, we show that synaptic correlations have a substantial impact on spike output response to time-varying stimuli. Balanced and correlated excitatory and inhibitory inputs with realistic decay kinetics cancel in the 0–20 Hz frequency range. For this reason, small probe inputs in this frequency band can entrain stellate cells extremely effectively.
Theta frequency preference in stellate cells
Under all conditions tested, we found that stellate cell spike activity was better modulated by theta range sinusoidal current inputs. This result is consistent with previous modeling work indicating that very strong subthreshold resonance behavior carries into the spike output under a high noise or a fluctuation-driven regime (Richardson et al., 2003).
Past work from our group established that increased membrane conductance associated with synaptic input completely eliminates autonomous spike train oscillations and reduces subthreshold resonance at theta frequencies in stellate cells (Fernandez and White, 2008). The discrepancy with our previous results in stellate cell arises for two principal reasons. First, the ability to generate autonomous oscillatory activity is qualitatively different from the ability to amplify or respond preferentially to certain input frequencies. Thus, while stellate cells do not generate oscillations in response to unmodulated stochastic inputs under high membrane conductance, they do respond preferentially to input modulated at theta under these same conditions. Second, we observed that spike resonance was less sensitive to changes in membrane conductance than the subthreshold resonance behavior. This may arise from the fact that increased membrane conductance did not completely eliminate subthreshold resonance. Further, increased synaptic conductance has a smaller effect near threshold because of substantial Na+ current activation, which acts to amplify resonance and intrinsic properties immediately below spike threshold (Alonso and Llinás, 1989; Burton et al., 2008). Finally, spike-dependent mechanisms may also contribute to the expression of spike resonance as shown in CA1 pyramidal cells (Broicher et al., 2012) and suggested in past work from stellate cells (Nolan et al., 2007; Fernandez and White, 2008).
Comparison with in vivo stellate cell spike activity
Stellate cell spike discharge in vivo occurs at relatively low and variable rates and is dominated by strong spike phase-locking to the local theta field potential (Alonso and García-Austt, 1987; Frank et al., 2001; Quilichini et al., 2010; Burgalossi et al., 2011). Importantly, mean spike rate data indicates a marked absence of repetitive spike discharge at theta or any form of pacemaking activity (Frank et al., 2001; Quilichini et al., 2010; Schmidt-Hieber and Häusser, 2013). Whether the spike temporal autocorrelations indicate significant oscillations at theta seems more variable. Some studies indicate an absence of rhythmicity in the autocorrelation (Frank et al., 2001; Quilichini et al., 2010), while others indicate rhythmic activity at theta (Brandon et al., 2011; Koenig et al., 2011). All these studies, however, indicate low average spike discharge rates (<3 Hz) that are significantly below theta. Hence, stellate cell spike activity locks strongly to theta inputs despite not firing at theta frequencies. This apparent discrepancy arises because the ability to lock spike discharge to a particular input frequency under stochastic membrane fluctuations is distinct from the continuous generation of spikes at a given spike rate and the ability to generate oscillations. In fact, recent intracellular in vivo recordings from stellate cells indicate an absence of intrinsically generated subthreshold membrane voltage oscillations but the ability to lock to the theta field potential (Schmidt-Hieber and Häusser, 2013).
Spike phase-locking requires only that the phase between the sinusoidal input and spike time be consistent across different cycles of the input. Although this result suggests that stellate cells are unlikely to provide pacemaking activity to downstream cells, it does suggest a potential role in amplifying or maintaining spike phase-locking to network theta rhythms originating from other cells. Furthermore, it indicates that a contribution to network theta by stellate cell can be achieved through very strong spike locking at theta resulting from IH and a reduction in low-frequency membrane voltage fluctuations by correlations in synaptic inputs.
The properties of IH are also known to vary systematically along the dorsal–ventral axis of the MEC (Giocomo et al., 2007; Garden et al., 2008). We would expect this gradient to affect the peak and/or the frequency preference of the spike phase-locking relationship. Although in HCN1 knock-out mice grid cells maintain spike phase-locking to the theta field potential (Giocomo et al., 2011), it is difficult to interpret these results in the context of a frequency selectivity index as locking to different frequencies in the local field potential have not been tested systematically in vivo. The gradient has also been shown to affect integration of synaptic inputs (Garden et al., 2008). Thus, it is possible that differences in spike timing along dorsal–ventral axis are reflected in different spike phase-locking responses due to differences in the membrane time constant, IH kinetics, and overall response to synaptic inputs.
Functional consequences of correlations in gi and ge
Network models incorporating feedback inhibition can reliably generate robust correlations between excitation and inhibition, which reduce the size of voltage fluctuations through mutual cancellation and decrease spike discharge rate (Vogels and Abbott, 2009; Renart et al., 2010; Sceniak and Sabo, 2010; Economo and White, 2012). However, in vivo recordings indicate the presence of large voltage fluctuations that seem undampened by the correlations in synaptic inhibition and excitation (Destexhe and Paré, 1999; Crochet and Petersen, 2006). Furthermore, different network states are associated with different forms of subthreshold membrane voltage fluctuations. For example, states of wakefulness are associated with a selective decrease in power of low-frequency membrane voltage fluctuations (Crochet and Petersen, 2006; Poulet and Petersen, 2008; Okun et al., 2010; Constantinople and Bruno, 2011; Crochet et al., 2011). Our results suggest that these changes in spectra can arise through correlations between gi and ge using a physiological range of synaptic time constants and changes in the relative SD values.
A proposed function for synaptic correlations is that they reduce the size of membrane voltage fluctuations and/or shorten the duration of excitatory events (Pouille and Scanziani, 2001; Wehr and Zador, 2003; Liu et al., 2010; Renart et al., 2010; Sceniak and Sabo, 2010), thereby increasing the temporal precision of spike output. Our results add to this and emphasize the role of correlations in modulating the spike phase-locking response. As with levels of mean conductance and the size of noisy fluctuations in our previous work (Fernandez and White, 2008, 2010; Fernandez et al., 2011), we now indicate that the correlation properties of synaptic inputs can have a large impact on cellular input–output behavior.
Computational work has also shown that a reduction of membrane voltage fluctuations resulting from correlations can be used to implement a decorrelation of spike activity in neighboring cells (Renart et al., 2010). Mutual cancellation of excitation and inhibition can be used to reduce membrane voltage and spike train correlations between neighboring cells arising from spatially diffuse negative feedback. Whereas our work indicates that correlations in inhibition and excitation can reduce the size of membrane voltage fluctuations, the magnitude and frequency range of the reduction is highly dependent on the SD and time constants of gi and ge fluctuations.
Although under our experimental conditions we used only a single pair of time constants for inhibition and excitation (8 and 2 ms), our theoretical results indicate that the specific reduction of power in low-frequency voltage fluctuations occurs under a variety of parameters where inhibition is slower than excitation. The specific reduction of low-frequency voltage fluctuations is likely to be important for neurons as responses to higher frequencies are limited by the membrane time constant, synaptic time constants and the spike generation mechanism (Brunel et al., 2001; Fourcaud-Trocmé et al., 2003; Wei and Wolf, 2011; Broicher et al., 2012).
Recent spectral analyses of membrane voltage in vivo have also revealed that membrane voltage dynamics change as a function of the behavior or state of the animal (Crochet and Petersen, 2006; Okun et al., 2010; Constantinople and Bruno, 2011). Intracellular recordings from cortical pyramidal cells have shown that active behavioral states are associated with a reduction of low-frequency voltage fluctuations (Crochet and Petersen, 2006; Poulet and Petersen, 2008; Constantinople and Bruno, 2011; Crochet et al., 2011). Consistent with this interpretation, there exists evidence that the relative SD values of gi and ge change as a function of the network state and sensory input (Rudolph et al., 2007; Wu et al., 2008). Hence, different network regimes associated with different synaptic weights and kinetics or neuronal gain could be used to control the relative size of gi and ge fluctuations and modulate the spectral properties of membrane voltage and spike output.
Footnotes
This work was supported with grants from the National Institutes of Health (R01MH085387 and R01MH085074). We thank Tilman Broicher and Michael N. Economo for extensive discussions and comments on this manuscript.
References
- Adesnik H, Scanziani M. Lateral competition for cortical space by layer-specific horizontal circuits. Nature. 2010;464:1155–1160. doi: 10.1038/nature08935. [DOI] [PMC free article] [PubMed] [Google Scholar]
- Alonso A, García-Austt E. Neuronal sources of theta rhythm in the entorhinal cortex of the rat. II. Phase relations between unit discharges and theta field potentials. Exp Brain Res. 1987;67:502–509. doi: 10.1007/BF00247283. [DOI] [PubMed] [Google Scholar]
- Alonso A, Llinás RR. Subthreshold Na+-dependent theta-like rhythmicity in stellate cells of entorhinal cortex layer II. Nature. 1989;342:175–177. doi: 10.1038/342175a0. [DOI] [PubMed] [Google Scholar]
- Anderson JS, Lampl I, Gillespie DC, Ferster D. Membrane potential and conductance changes underlying length tuning of cells in cat primary visual cortex. J Neurosci. 2001;21:2104–2112. doi: 10.1523/JNEUROSCI.21-06-02104.2001. [DOI] [PMC free article] [PubMed] [Google Scholar]
- Atallah BV, Scanziani M. Instantaneous modulation of gamma oscillation frequency by balancing excitation with inhibition. Neuron. 2009;62:566–577. doi: 10.1016/j.neuron.2009.04.027. [DOI] [PMC free article] [PubMed] [Google Scholar]
- Bettencourt JC, Lillis KP, Stupin LR, White JA. Effects of imperfect dynamic clamp: computational and experimental results. J Neurosci Methods. 2008;169:282–289. doi: 10.1016/j.jneumeth.2007.10.009. [DOI] [PMC free article] [PubMed] [Google Scholar]
- Brandon MP, Bogaard AR, Libby CP, Connerney MA, Gupta K, Hasselmo ME. Reduction of theta rhythm dissociates grid cell spatial periodicity from directional tuning. Science. 2011;332:595–599. doi: 10.1126/science.1201652. [DOI] [PMC free article] [PubMed] [Google Scholar]
- Broicher T, Malerba P, Dorval AD, Borisyuk A, Fernandez FR, White JA. Spike phase locking in CA1 pyramidal neurons depends on background conductance and firing rate. J Neurosci. 2012;32:14374–14388. doi: 10.1523/JNEUROSCI.0842-12.2012. [DOI] [PMC free article] [PubMed] [Google Scholar]
- Brunel N, Chance FS, Fourcaud N, Abbott LF. Effects of synaptic noise and filtering on the frequency response of spiking neurons. Phys Rev Lett. 2001;86:2186–2189. doi: 10.1103/PhysRevLett.86.2186. [DOI] [PubMed] [Google Scholar]
- Burgalossi A, Herfst L, von Heimendahl M, Förste H, Haskic K, Schmidt M, Brecht M. Microcircuits of functionally identified neurons in the rat medial entorhinal cortex. Neuron. 2011;70:773–786. doi: 10.1016/j.neuron.2011.04.003. [DOI] [PubMed] [Google Scholar]
- Burgess N, Barry C, O'Keefe J. An oscillatory interference model of grid cell firing. Hippocampus. 2007;17:801–812. doi: 10.1002/hipo.20327. [DOI] [PMC free article] [PubMed] [Google Scholar]
- Burton BG, Economo MN, Lee GJ, White JA. Development of theta rhythmicity in entorhinal stellate cells of the juvenile rat. J Neurophysiol. 2008;100:3144–3157. doi: 10.1152/jn.90424.2008. [DOI] [PMC free article] [PubMed] [Google Scholar]
- Buzsáki G, Draguhn A. Neuronal oscillations in cortical networks. Science. 2004;304:1926–1929. doi: 10.1126/science.1099745. [DOI] [PubMed] [Google Scholar]
- Cardin JA, Palmer LA, Contreras D. Cellular mechanisms underlying stimulus-dependent gain modulation in primary visual cortex neurons in vivo. Neuron. 2008;59:150–160. doi: 10.1016/j.neuron.2008.05.002. [DOI] [PMC free article] [PubMed] [Google Scholar]
- Constantinople CM, Bruno RM. Effects and mechanisms of wakefulness on local cortical networks. Neuron. 2011;69:1061–1068. doi: 10.1016/j.neuron.2011.02.040. [DOI] [PMC free article] [PubMed] [Google Scholar]
- Crochet S, Petersen CC. Correlating whisker behavior with membrane potential in barrel cortex of awake mice. Nat Neurosci. 2006;9:608–610. doi: 10.1038/nn1690. [DOI] [PubMed] [Google Scholar]
- Crochet S, Poulet JF, Kremer Y, Petersen CC. Synaptic mechanisms underlying sparse coding of active touch. Neuron. 2011;69:1160–1175. doi: 10.1016/j.neuron.2011.02.022. [DOI] [PubMed] [Google Scholar]
- Csicsvari J, Hirase H, Czurkó A, Mamiya A, Buzsáki G. Oscillatory coupling of hippocampal pyramidal cells and interneurons in the behaving rat. J Neurosci. 1999;19:274–287. doi: 10.1523/JNEUROSCI.19-01-00274.1999. [DOI] [PMC free article] [PubMed] [Google Scholar]
- Destexhe A, Paré D. Impact of network activity on the integrative properties of neocortical pyramidal neurons in vivo. J Neurophysiol. 1999;81:1531–1547. doi: 10.1152/jn.1999.81.4.1531. [DOI] [PubMed] [Google Scholar]
- Destexhe A, Rudolph M, Fellous JM, Sejnowski TJ. Fluctuating synaptic conductances recreate in vivo-like activity in neocortical neurons. Neuroscience. 2001;107:13–24. doi: 10.1016/s0306-4522(01)00344-x. [DOI] [PMC free article] [PubMed] [Google Scholar]
- Economo MN, White JA. Membrane properties and the balance between excitation and inhibition control gamma-frequency oscillations arising from feedback inhibition. PLoS Comput Biol. 2012;8:e1002354. doi: 10.1371/journal.pcbi.1002354. [DOI] [PMC free article] [PubMed] [Google Scholar]
- Epsztein J, Lee AK, Chorev E, Brecht M. Impact of spikelets on hippocampal CA1 pyramidal cell activity during spatial exploration. Science. 2010;327:474–477. doi: 10.1126/science.1182773. [DOI] [PubMed] [Google Scholar]
- Fellous JM, Rudolph M, Destexhe A, Sejnowski TJ. Synaptic background noise controls the input/output characteristics of single cells in an in vitro model of in vivo activity. Neuroscience. 2003;122:811–829. doi: 10.1016/j.neuroscience.2003.08.027. [DOI] [PMC free article] [PubMed] [Google Scholar]
- Fernandez FR, White JA. Artificial synaptic conductances reduce subthreshold oscillations and periodic firing in stellate cells of the entorhinal cortex. J Neurosci. 2008;28:3790–3803. doi: 10.1523/JNEUROSCI.5658-07.2008. [DOI] [PMC free article] [PubMed] [Google Scholar]
- Fernandez FR, White JA. Gain control in CA1 pyramidal cells using changes in somatic conductance. J Neurosci. 2010;30:230–241. doi: 10.1523/JNEUROSCI.3995-09.2010. [DOI] [PMC free article] [PubMed] [Google Scholar]
- Fernandez FR, Broicher T, Truong A, White JA. Membrane voltage fluctuations reduce spike frequency adaptation and preserve output gain in CA1 pyramidal neurons in a high-conductance state. J Neurosci. 2011;31:3880–3893. doi: 10.1523/JNEUROSCI.5076-10.2011. [DOI] [PMC free article] [PubMed] [Google Scholar]
- Fourcaud-Trocmé N, Hansel D, van Vreeswijk C, Brunel N. How spike generation mechanisms determine the neuronal response to fluctuating inputs. J Neurosci. 2003;23:11628–11640. doi: 10.1523/JNEUROSCI.23-37-11628.2003. [DOI] [PMC free article] [PubMed] [Google Scholar]
- Fox SE, Wolfson S, Ranck JB., Jr Hippocampal theta rhythm and the firing of neurons in walking and urethane anesthetized rats. Exp Brain Res. 1986;62:495–508. doi: 10.1007/BF00236028. [DOI] [PubMed] [Google Scholar]
- Frank LM, Brown EN, Wilson MA. A comparison of the firing properties of putative excitatory and inhibitory neurons from CA1 and the entorhinal cortex. J Neurophysiol. 2001;86:2029–2040. doi: 10.1152/jn.2001.86.4.2029. [DOI] [PubMed] [Google Scholar]
- Franks KM, Russo MJ, Sosulski DL, Mulligan AA, Siegelbaum SA, Axel R. Recurrent circuitry dynamically shapes the activation of piriform cortex. Neuron. 2011;72:49–56. doi: 10.1016/j.neuron.2011.08.020. [DOI] [PMC free article] [PubMed] [Google Scholar]
- Fries P, Reynolds JH, Rorie AE, Desimone R. Modulation of oscillatory neuronal synchronization by selective visual attention. Science. 2001;291:1560–1563. doi: 10.1126/science.1055465. [DOI] [PubMed] [Google Scholar]
- Garden DL, Dodson PD, O'Donnell C, White MD, Nolan MF. Tuning of synaptic integration in the medial entorhinal cortex to the organization of grid cell firing fields. Neuron. 2008;60:875–889. doi: 10.1016/j.neuron.2008.10.044. [DOI] [PubMed] [Google Scholar]
- Giocomo LM, Zilli EA, Fransén E, Hasselmo ME. Temporal frequency of subthreshold oscillations scales with entorhinal grid cell field spacing. Science. 2007;315:1719–1722. doi: 10.1126/science.1139207. [DOI] [PMC free article] [PubMed] [Google Scholar]
- Giocomo LM, Hussaini SA, Zheng F, Kandel ER, Moser M-B, Moser MB. Grid cells use HCN1 channels for spatial scaling. Cell. 2011;147:1159–1170. doi: 10.1016/j.cell.2011.08.051. [DOI] [PubMed] [Google Scholar]
- Haas JS, White JA. Frequency selectivity of layer II stellate cells in the medial entorhinal cortex. J Neurophysiol. 2002;88:2422–2429. doi: 10.1152/jn.00598.2002. [DOI] [PubMed] [Google Scholar]
- Haas JS, Dorval AD, 2nd, White JA. Contributions of Ih to feature selectivity in layer II stellate cells of the entorhinal cortex. J Comput Neurosci. 2007;22:161–171. doi: 10.1007/s10827-006-0005-7. [DOI] [PubMed] [Google Scholar]
- Hafting T, Fyhn M, Molden S, Moser MB, Moser EI. Microstructure of a spatial map in the entorhinal cortex. Nature. 2005;436:801–806. doi: 10.1038/nature03721. [DOI] [PubMed] [Google Scholar]
- Harvey CD, Collman F, Dombeck DA, Tank DW. Intracellular dynamics of hippocampal place cells during virtual navigation. Nature. 2009;461:941–946. doi: 10.1038/nature08499. [DOI] [PMC free article] [PubMed] [Google Scholar]
- Heiss JE, Katz Y, Ganmor E, Lampl I. Shift in the balance between excitation and inhibition during sensory adaptation of S1 neurons. J Neurosci. 2008;28:13320–13330. doi: 10.1523/JNEUROSCI.2646-08.2008. [DOI] [PMC free article] [PubMed] [Google Scholar]
- Heys JG, Giocomo LM, Hasselmo ME. Cholinergic modulation of the resonance properties of stellate cells in layer II of medial entorhinal cortex. J Neurophysiol. 2010;104:258–270. doi: 10.1152/jn.00492.2009. [DOI] [PMC free article] [PubMed] [Google Scholar]
- Isaacson JS, Scanziani M. How inhibition shapes cortical activity. Neuron. 2011;72:231–243. doi: 10.1016/j.neuron.2011.09.027. [DOI] [PMC free article] [PubMed] [Google Scholar]
- Kispersky TJ, Fernandez FR, Economo MN, White JA. Spike resonance properties in hippocampal O-LM cells are dependent on refractory dynamics. J Neurosci. 2012;32:3637–3651. doi: 10.1523/JNEUROSCI.1361-11.2012. [DOI] [PMC free article] [PubMed] [Google Scholar]
- Klausberger T, Somogyi P. Neuronal diversity and temporal dynamics: the unity of hippocampal circuit operations. Science. 2008;321:53–57. doi: 10.1126/science.1149381. [DOI] [PMC free article] [PubMed] [Google Scholar]
- Klausberger T, Magill PJ, Márton LF, Roberts JD, Cobden PM, Buzsáki G, Somogyi P. Brain-state- and cell-type-specific firing of hippocampal interneurons in vivo. Nature. 2003;421:844–848. doi: 10.1038/nature01374. [DOI] [PubMed] [Google Scholar]
- Koenig J, Linder AN, Leutgeb JK, Leutgeb S. The spatial periodicity of grid cells is not sustained during reduced theta oscillations. Science. 2011;332:592–595. doi: 10.1126/science.1201685. [DOI] [PubMed] [Google Scholar]
- Köndgen H, Geisler C, Fusi S, Wang XJ, Lüscher HR, Giugliano M. The dynamical response properties of neocortical neurons to temporally modulated noisy inputs in vitro. Cereb Cortex. 2008;18:2086–2097. doi: 10.1093/cercor/bhm235. [DOI] [PMC free article] [PubMed] [Google Scholar]
- Liu BH, Li P, Sun YJ, Li YT, Zhang LI, Tao HW. Intervening inhibition underlies simple-cell receptive field structure in visual cortex. Nat Neurosci. 2010;13:89–96. doi: 10.1038/nn.2443. [DOI] [PMC free article] [PubMed] [Google Scholar]
- Nolan MF, Dudman JT, Dodson PD, Santoro B. HCN1 channels control resting and active integrative properties of stellate cells from layer II of the entorhinal cortex. J Neurosci. 2007;27:12440–12451. doi: 10.1523/JNEUROSCI.2358-07.2007. [DOI] [PMC free article] [PubMed] [Google Scholar]
- O'Keefe J, Burgess N. Dual phase and rate coding in hippocampal place cells: theoretical significance and relationship to entorhinal grid cells. Hippocampus. 2005;15:853–866. doi: 10.1002/hipo.20115. [DOI] [PMC free article] [PubMed] [Google Scholar]
- O'Keefe J, Recce ML. Phase relationship between hippocampal place units and the EEG theta rhythm. Hippocampus. 1993;3:317–330. doi: 10.1002/hipo.450030307. [DOI] [PubMed] [Google Scholar]
- Okun M, Lampl I. Instantaneous correlation of excitation and inhibition during ongoing and sensory-evoked activities. Nat Neurosci. 2008;11:535–537. doi: 10.1038/nn.2105. [DOI] [PubMed] [Google Scholar]
- Okun M, Naim A, Lampl I. The subthreshold relation between cortical local field potential and neuronal firing unveiled by intracellular recordings in awake rats. J Neurosci. 2010;30:4440–4448. doi: 10.1523/JNEUROSCI.5062-09.2010. [DOI] [PMC free article] [PubMed] [Google Scholar]
- Paré D, Shink E, Gaudreau H, Destexhe A, Lang EJ. Impact of spontaneous synaptic activity on the resting properties of cat neocortical pyramidal neurons in vivo. J Neurophysiol. 1998;79:1450–1460. doi: 10.1152/jn.1998.79.3.1450. [DOI] [PubMed] [Google Scholar]
- Pécseli HL. Fluctuations in physical systems. Cambridge, UK: Cambridge UP; 2000. [Google Scholar]
- Pouille F, Scanziani M. Enforcement of temporal fidelity in pyramidal cells by somatic feed-forward inhibition. Science. 2001;293:1159–1163. doi: 10.1126/science.1060342. [DOI] [PubMed] [Google Scholar]
- Poulet JF, Petersen CC. Internal brain state regulates membrane potential synchrony in barrel cortex of behaving mice. Nature. 2008;454:881–885. doi: 10.1038/nature07150. [DOI] [PubMed] [Google Scholar]
- Quilichini P, Sirota A, Buzsáki G. Intrinsic circuit organization and theta-gamma oscillation dynamics in the entorhinal cortex of the rat. J Neurosci. 2010;30:11128–11142. doi: 10.1523/JNEUROSCI.1327-10.2010. [DOI] [PMC free article] [PubMed] [Google Scholar]
- Renart A, de la Rocha J, Bartho P, Hollender L, Parga N, Reyes A, Harris KD. The asynchronous state in cortical circuits. Science. 2010;327:587–590. doi: 10.1126/science.1179850. [DOI] [PMC free article] [PubMed] [Google Scholar]
- Richardson MJ, Gerstner W. Synaptic shot noise and conductance fluctuations affect the membrane voltage with equal significance. Neural Comput. 2005;17:923–947. doi: 10.1162/0899766053429444. [DOI] [PubMed] [Google Scholar]
- Richardson MJ, Brunel N, Hakim V. From subthreshold to firing-rate resonance. J Neurophysiol. 2003;89:2538–2554. doi: 10.1152/jn.00955.2002. [DOI] [PubMed] [Google Scholar]
- Rudolph M, Pospischil M, Timofeev I, Destexhe A. Inhibition determines membrane potential dynamics and controls action potential generation in awake and sleeping cat cortex. J Neurosci. 2007;27:5280–5290. doi: 10.1523/JNEUROSCI.4652-06.2007. [DOI] [PMC free article] [PubMed] [Google Scholar]
- Rutishauser U, Ross IB, Mamelak AN, Schuman EM. Human memory strength is predicted by theta-frequency phase-locking of single neurons. Nature. 2010;464:903–907. doi: 10.1038/nature08860. [DOI] [PubMed] [Google Scholar]
- Sceniak MP, Sabo SL. Modulation of firing rate by background synaptic noise statistics in rat visual cortical neurons. J Neurophysiol. 2010;104:2792–2805. doi: 10.1152/jn.00023.2010. [DOI] [PubMed] [Google Scholar]
- Schmidt-Hieber C, Häusser M. Cellular mechanisms of spatial navigation in the medial entorhinal cortex. Nat Neurosci. 2013;16:325–331. doi: 10.1038/nn.3340. [DOI] [PubMed] [Google Scholar]
- Shu Y, Hasenstaub A, McCormick DA. Turning on and off recurrent balanced cortical activity. Nature. 2003;423:288–293. doi: 10.1038/nature01616. [DOI] [PubMed] [Google Scholar]
- Stewart M, Quirk GJ, Barry M, Fox SE. Firing relations of medial entorhinal neurons to the hippocampal theta rhythm in urethane anesthetized and walking rats. Exp Brain Res. 1992;90:21–28. doi: 10.1007/BF00229252. [DOI] [PubMed] [Google Scholar]
- Suzuki N, Bekkers JM. Microcircuits mediating feedforward and feedback synaptic inhibition in the piriform cortex. J Neurosci. 2012;32:919–931. doi: 10.1523/JNEUROSCI.4112-11.2012. [DOI] [PMC free article] [PubMed] [Google Scholar]
- Vogels TP, Abbott LF. Gating multiple signals through detailed balance of excitation and inhibition in spiking networks. Nat Neurosci. 2009;12:483–491. doi: 10.1038/nn.2276. [DOI] [PMC free article] [PubMed] [Google Scholar]
- Waters J, Helmchen F. Background synaptic activity is sparse in neocortex. J Neurosci. 2006;26:8267–8277. doi: 10.1523/JNEUROSCI.2152-06.2006. [DOI] [PMC free article] [PubMed] [Google Scholar]
- Wehr M, Zador AM. Balanced inhibition underlies tuning and sharpens spike timing in auditory cortex. Nature. 2003;426:442–446. doi: 10.1038/nature02116. [DOI] [PubMed] [Google Scholar]
- Wei W, Wolf F. Spike onset dynamics and response speed in neuronal populations. Phys Rev Lett. 2011;106 doi: 10.1103/PhysRevLett.106.088102. 088102. [DOI] [PubMed] [Google Scholar]
- Wu GK, Arbuckle R, Liu BH, Tao HW, Zhang LI. Lateral sharpening of cortical frequency tuning by approximately balanced inhibition. Neuron. 2008;58:132–143. doi: 10.1016/j.neuron.2008.01.035. [DOI] [PMC free article] [PubMed] [Google Scholar]