

In showing that regional spending variations do not correlate with differences in disease burden or outcome, the Dartmouth Atlas of Health Care has felled the notion that higher health care spending necessarily leads to improved health outcomes. Policymakers have seized upon two possible ways to wring savings out of this information. The health care reform bill recently passed in the House of Representatives contains provisions for identifying regions where Medicare spending appears disproportionately high and adjusting payment rates accordingly. And some policymakers, including President Barack Obama, have proposed that the features of high-performing, “efficient” health care systems should be identified, and their lower-cost practices emulated.
Dartmouth Atlas researchers have also begun attempting to convert their observations into cost-saving policies. By analyzing Medicare claims for people who have been treated in hospitals and have died, they aim to identify and rank high- and low-efficiency hospitals.1 Because the Atlas is so influential, their rankings could have broad effects on policy. They could affect hospitals’ payments and prestige, and Consumer Reports is already publicizing them to consumers (consumerhealthreports.org). Given their potentially far-reaching implications, it is concerning that the rankings are unsound both conceptually and methodologically.
The conceptual problem lies in the fact that, in Atlas analyses, all health care costs incurred by patients over the 2 years before their death are attributed to the hospital where they were admitted most frequently during that period. This method assumes that the hospital controls all, or at least most, patient care, even if it occurs outside the hospital or in another hospital. It thus seems to presuppose a system in which hospitals are accountable for all care — perhaps a noble long-term objective, but not a current reality.
Hospitals can sometimes influence the immediate follow-up care of discharged patients, but much care is beyond their control. According to the Center for Studying Health System Change, less than 20% of U.S. physicians have a financial connection with any hospital. Home health agencies and subacute-care inpatient facilities — which tend to have high costs — are designed to serve multiple hospitals, not a single hospital that can exert control over them. Frequently, even the hospital to which a patient is assigned has very limited contact with that patient. In a recent Atlas analysis, one third of the patients included in an assessment of hospital efficiency had been admitted to the hospital in question only once.2
Atlas-based analyses are also hampered by methodologic problems, starting with their implicit definition of efficiency. A true analysis of efficiency would ask “whether healthcare resources are being used to get … improved health,”3 weighing both resources consumed and outcomes. Yet Atlas efficiency rankings consider only costs (i.e., resources consumed).
Conceptually, this approach would be appropriate only if outcomes were the same in all hospitals, so that costs equaled efficiency. But since outcomes vary among hospitals and providers, both costs and outcomes must be assessed in evaluating efficiency. Atlas researchers might argue, correctly, that costs correlate poorly with outcomes. But poor correlation does not imply that outcomes are homogeneous, but rather that there are high-spending hospitals that use resources in a manner that improves outcomes and others that squander resources, failing to improve health. The same goes for low-spending hospitals. Figuring out which is which is the purpose of efficiency assessment, which therefore requires consideration of both costs and outcomes.
Hospital A and Hospital B each have a set of patients with a uniformly fatal disease. Hospital A gives each a $1 pill and cures half. Hospital B provides no treatment. The Atlas would conclude paradoxically that Hospital B was more efficient, as it spent less ($0) per decedent. But all patients die at Hospital B, while only half do at Hospital A, where the cost per life saved is a bargain at $2. Although $1 cures are rare, changing the price or efficacy of the pill does not alter the fundamental problem with examining costs alone when cost differences are (at least sometimes) associated with outcome differences.
Another methodologic problem is that Atlas analyses assess hospital efficiency overall on the basis of costs incurred for nonrepresentative patients — decedents who were enrolled in fee-for-service Medicare. This group both varies among hospitals in terms of severity of illness and is not representative of a given hospital’s overall spending pattern.
Regarding illness severity, Atlas researchers note on their Web site (www.dartmouthatlas.org/faq/hospital.shtm) that they focus on “patients who died so that [they can be sure] that patients were similarly ill across hospitals,” further explaining that “by definition, the prognosis of all patients [who died was] identical — all were dead … therefore, variations [in resource use] cannot be explained by differences in the severity of illness.” But since some hospitals take care of sicker patients than others, the average severity of illness of patients who die also varies among hospitals. This fact is being ignored when all spending differences are attributed to differences in efficiency.4
My analysis of the 2006 Nationwide Inpatient Sample on decedents 65 years of age or older illustrates how far off the Atlas assumption is (see graph). Using “All-Patient–Refined Diagnosis-Related Groups,” I found that among such decedents, the predicted risk of death at the time of admission varied widely among hospitals. At the average hospital, the average risk was 15%. But the severity of illness was far lower at hospitals at the 10th percentile (6% risk of death) and far higher at hospitals at the 90th percentile (22% risk of death). Differences in illness severity result in differences in resource consumption: for example, the average length of stay for this population was 4.4 days at hospitals at the 10th percentile but 9.3 days at 90th-percentile hospitals. In other words, the average decedent in a hospital with low average illness severity started out much less sick than the average decedent in a hospital with high average severity, and differences in resource consumption should be expected. The Atlas, however, assumes that all decedents in all hospitals were equally sick prior to death, an error that tends to make low-severity hospitals look more efficient than high-severity hospitals even if the hospitals are equally efficient.
Resources consumed in the care of fee-for-service Medicare patients who died are also a poor surrogate for costs of care for other patients at the same hospital. If resource consumption is measured by the number of hospital days, the correlations are only 0.40 with patients in Medicare Advantage plans and and 0.34 with patients covered by commercial insurance.5 If most care and resources went to dying fee-for-service Medicare patients, then maybe these weak correlations wouldn’t matter. But I estimate that these patients account for less than $3 of every $100 spent on health care.
Only scientifically valid measures of efficiency should guide policy. Several organizations are developing such measures — for example, Medicare’s Physician Group Practice Demonstration recently released data incorporating measures of cost and quality with respect to the management of specific conditions; the Centers for Medicare and Medicaid Services is developing “value scores” for physicians based on quality performance and resource use; the National Committee on Quality Assurance publishes health-plan-level “Relative Resource Utilization” measures for various conditions; and Prometheus Payment has developed approaches to prospective payment that reward efficiency by enabling providers to share in savings for avoiding complications.
Of course, more work is required. But there are dangers in using scientifically shaky measures of efficiency to identify high-performing providers. Patients may be misled in selecting providers. Providers may base delivery changes on the wrong models. And the whole system may waste precious time and resources pursuing a path that fails to lead toward quality improvement and cost containment.
Figure.
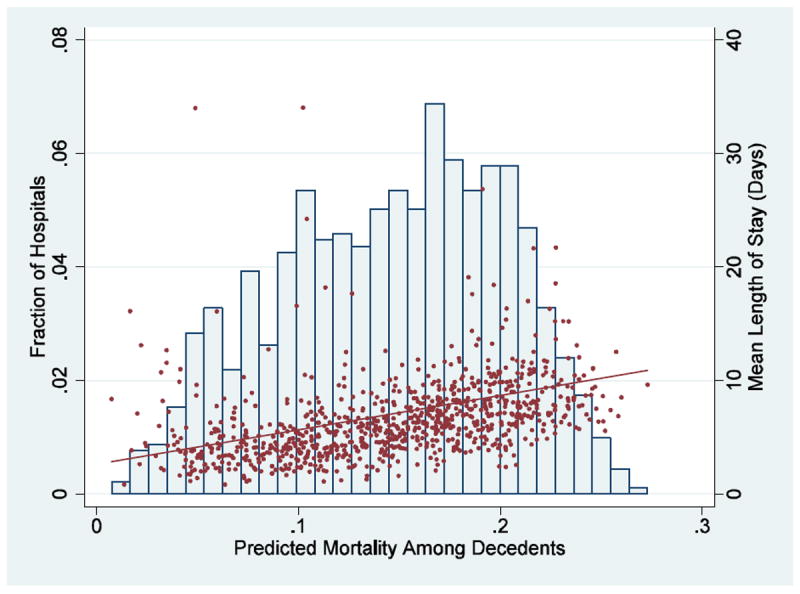
Distribution among Hospitals of the Average Predicted Risk of Death at Admission among Patients 65 Years of Age or Older Who Died
The histogram, graphed on the left axis, shows the distribution of the average predicted risk of death at admission in various hospitals among patients 65 years of age or older who died. The average length of stay for these individuals in each of those hospitals (red dots) and the linear relation (red line) between average predicted risk of death in the hospital and the average length of stay for those decedents are shown on the right axis. The linear relation between severity of illness and length of stay is highly statistically significant (P< 0.001). Data are from the 2006 Nationwide Inpatient Sample.
Footnotes
Financial and other disclosures provided by the author are available with the full text of this article at NEJM.org.
References
- 1.Wennberg JE, et al. Evaluating the efficiency of California providers in caring for patients with chronic illnesses. Health Aff (Millwood) 2005;(Suppl Web Exclusives):W5-526–43. doi: 10.1377/hlthaff.w5.526. [DOI] [PubMed] [Google Scholar]
- 2.Wennberg JE, et al. Use of hospitals, physician visits, and hospice care during last six months of life among cohorts loyal to highly respected hospitals in the United States. British Medical Journal. 2004;328(7440):607–610A. doi: 10.1136/bmj.328.7440.607. [DOI] [PMC free article] [PubMed] [Google Scholar]
- 3.Palmer S, Torgerson DJ. Economic notes: definitions of efficiency. BMJ. 1999;318(7191):1136. doi: 10.1136/bmj.318.7191.1136. [DOI] [PMC free article] [PubMed] [Google Scholar]
- 4.Bach PB, Schrag D, Begg CB. Resurrecting treatment histories of dead patients: a study design that should be laid to rest. JAMA. 2004;292(22):2765–2770. doi: 10.1001/jama.292.22.2765. [DOI] [PubMed] [Google Scholar]
- 5.Baker LC, Fisher ES, Wennberg JE. Variations in hospital resource use for Medicare and privately insured populations in California. Health Aff (Millwood) 2008;27(2):w123–34. doi: 10.1377/hlthaff.27.2.w123. [DOI] [PubMed] [Google Scholar]