

Abstract
OBJECTIVE:
To describe wait times, treatment times and length of stay (LOS) for pediatric mental health visits to emergency departments (EDs).
METHODS:
The present study was a retrospective cohort analysis of mental health visits (n=30,656) made by children <18 years of age between April 2002 and March 2008 to EDs in Alberta using administrative data. Wait time (time from triage to physician assessment), treatment time (time from physician assessment to end of visit) and LOS (time from start to end of visit) were examined for each visit. Wait time and treatment time data were available for 2006 to 2008, and LOS data were available for all study years. Wait times and LOS were compared with national benchmarks for the Canadian Triage and Acuity Scale (CTAS; levels 1 [resuscitative] through 5 [nonurgent]). All times are presented in h and min.
RESULTS:
Median wait times for visits triaged as CTAS 1, 2, 3 and 4 exceeded national recommendations. The longest wait times were for visits triaged as urgent (CTAS 3; 1 h 46 min) and less urgent (CTAS 4; 1 h 45 min). Lower-acuity visits had wait times that exceeded treatment times (CTAS 4: 1 h 45 min versus 1 h 8 min; CTAS 5: 1 h 5 min versus 52 min). Across all CTAS levels, the LOS in the ED increased during the study period, but met national benchmarks.
CONCLUSIONS:
Most median ED wait times for pediatric mental health visits exceeded national recommendations, while the median LOS for all visits met recommendations. Lower-acuity visits had wait times that exceeded treatment times. Future research should explore whether longer wait times are associated with adverse outcomes, and whether current wait/treatment times are warranted to ensure that ED throughput is optimized.
Keywords: Crisis intervention, Emergencies, Health services administration, Pediatrics
Abstract
OBJECTIF :
Décrire les temps d’attente, la durée du traitement et la durée de séjour (DdS) lors de visites au département d’urgence (DU) en raison de problèmes de santé mentale en pédiatrie.
MÉTHODOLOGIE :
La présente étude était une analyse rétrospective de cohorte des visites effectuées par des enfants de moins de 18 ans pour des problèmes de santé mentale (n=30 656) entre avril 2002 et mars 2008 aux DU de l’Alberta, extrapolées selon les données administratives. Pour chaque visite, les chercheurs ont examiné le temps d’attente (délai entre le triage et l’évaluation du médecin), la durée du traitement (délai entre l’évaluation du médecin et la fin de la visite) et la DdS (délai entre le début et la fin de la visite). Les données sur le temps d’attente et la durée du traitement étaient disponibles de 2006 à 2008, tandis que celles sur la DdS l’étaient pour toutes les années de l’étude. Les chercheurs ont comparé les temps d’attente et la DdS avec les normes nationales d’après l’Échelle canadienne de triage et de gravité (ÉCTG; niveaux 1 [réanimation] à 5 [non urgent]). Les temps et les durées sont présentés en heures et en minutes.
RÉSULTATS :
Le temps d’attente médian des visites dont le triage correspondait à une ÉCTG de 1, 2, 3 et 4 était supérieur aux recommandations nationales. Les temps d’attente les plus longs s’associaient aux visites classées comme urgentes (ÉCGT 3; 1 h 46 min) et moins urgentes (ÉCGT 4; 1 h 45 min) lors du triage. Le temps d’attente des visites moins aiguës était plus long que la durée de traitement (ÉCGT 4 : 1 h 45 min par rapport à 1 h 8 min; ÉCGT 5 : 1 h 5 min par rapport à 52 min). Dans tous les niveaux d’ÉCGT, la DdS au DU a augmenté pendant la période de l’étude, mais respectait les normes nationales.
CONCLUSION :
La plupart des temps d’attente médians des visites au DU pour des problèmes de santé mentale en pédiatrie étaient plus longs que les recommandations nationales, tandis que la DdS médiane de toutes les visites respectait les recommandations. Les visites moins aiguës s’associaient à des temps d’attente plus longs que la durée de traitement. Les prochaines recherches devraient viser à déterminer si les temps d’attente plus longs s’associent à des effets indésirables et si le temps d’attente et la durée de traitement actuels se justifient pour assurer l’optimisation du cheminement au DU.
Over the past decade, increased emergency department (ED) wait times across Canada have been the subject of considerable examination (1–3), and a number of studies involving adult patients have drawn attention to adverse treatment and patient outcomes due to prolonged wait times and length of stay (LOS; encompassing both wait and treatment times) (4–7). A position underpinning these studies is that ED wait time and LOS are important measures of treatment timelines and patient safety.
Longer ED wait times for patients of all ages have been associated with triage level (which denotes a level of urgency for the presenting complaint) (1,8), ED type (based on patient volume and teaching hospital status) (1,8), day of the week (8,9) and time of ED arrival (8,9). A longer LOS for admitted children has been associated with ethnicity, time of year and time of ED arrival (10), while ethnicity (11,12), resource use (diagnostic imaging and number of diagnostic/screening tests) (13) and critical illness (13) have been associated with a longer LOS for adult patients.
EDs are important sites of service for child psychiatric and psychosocial (both comprising ‘mental health’) crises (14,15). Care provided in an ED can stabilize acute problems and facilitate urgent follow-up for symptom management and family support (14,16). Children who present to EDs with mental health complaints are known to have a longer LOS compared with children with nonpsychiatric visits (17), and several studies have documented a lack of ED resources for mental health visits vis-à-vis lengths of stay >5 h (18,19). To date, no published studies have examined wait and treatment times for pediatric mental health visits to help clarify and quantify ED LOS.
The objective of the present study was to describe trends in key ED time intervals, wait times and treatment times, using an administrative dataset to clarify LOS during pediatric mental health visits across the province of Alberta. Wait times and LOS were compared with national benchmarks for the Canadian Triage and Acuity Scale (CTAS) (3,20), an instrument used during ED triage assessment to estimate the level of clinical urgency for care (21,22). We hypothesized that longer wait times would be observed for visits assessed as less urgent according to triage level, that treatment times would be longer for visits triaged as more urgent, and that wait times and LOS would exceed national benchmarks.
METHODS
Design and study population
Data analyzed in the present retrospective cohort study were obtained from the Ambulatory Care Classification System (ACCS) provincial database created by Alberta Health and included visits between April 1, 2002 and March 31, 2008 to all EDs in Alberta. All cases in the ACCS database that met inclusion criteria for the present study were extracted: visits by pediatric patients (<18 years of age) with a main discharge diagnosis of mental illness, mental/behavioural disorder secondary to substance abuse or intentional self-harm, which were grouped according to WHO clusters (23). This diagnosis reflects the main reason for provision of ED services. Using a de-identified, unique number, ACCS data were linked to an annual cumulative registry file to obtain sociodemographic data, and to identify First Nation Treaty Status (only for children with Treaty Status through registration with Health Canada) and membership in three socioeconomic groups (regular plan participant [ie, children of families receiving no social assistance] welfare recipient or recipient of other government subsidy due to low income). The three groups reflect the level of government subsidy provided during the study period for provincial health care premiums, which provided revenue for provincial coordination of health care in Alberta.
Study variables
Wait time was defined as the time (in h and min) from ED triage assessment to initial physician assessment. Treatment time was defined as the time (in h and min) from initial physician assessment to end of ED service. Mandatory reporting of triage time for urban EDs to the ACCS began April 1, 2006; a report of the initial physician assessment time is not mandatory. Data for wait and treatment times were available from 2006 to 2008. LOS was defined as the time (in h and min) from the start to the end of the ED service (registration to disposition time), and LOS data were available for all study years because the report of registration and disposition time to the ACCS is mandatory. Triage data were obtained and grouped according to the five CTAS levels (21,22). Geographical classifications were also defined for each ED (rural-based versus urban-based), with urban-based EDs meeting the Statistics Canada definition of census metropolitan area or census agglomeration (24).
Statistical analysis
Frequencies and percentages were used to summarize categorical data (eg, diagnosis, triage level); continuous time data were summarized using medians and interquartile ranges and represented graphically using boxplots. SPSS IS version 17 (IBM Corporation USA) was used for data analysis. Boxplots were generated using S-PLUS version 8.0.4 (TIBCO Software Inc, USA) for Windows (Microsoft Corporation, USA).
RESULTS
A total of 30,656 ED mental health visits made by 20,956 children met the criteria for inclusion in the present study. Females made 60% of the ED visits, and the largest age group presenting were between 15 and 17 years of age (Table 1). The most common diagnoses for visits were anxiety/stress-related illness (26.1%) and mental/behavioural disorders secondary to substance abuse (24.4%). More than 60% of patients were categorized as urgent (CTAS 3) or less urgent (CTAS 4) at triage.
TABLE 1.
Characteristics of mental health visits to emergency departments (n=30,656)
| Feature | n (%) |
|---|---|
| Age group, years | |
| 0–4 | 337 (1.1) |
| 5–9 | 1375 (4.5) |
| 10–14 | 9835 (32.1) |
| 15–17 | 19,109 (62.3) |
| Sex | |
| Female | 17,943 (58.5) |
| Sociodemographic group | |
| No subsidies received | 18,715 (61.0) |
| Government-sponsored program subsidy | 5739 (18.7) |
| First Nations status | 4230 (13.8) |
| Welfare | 1972 (6.4) |
| Discharge diagnosis | |
| Anxiety/stress-related disorder | 7989 (26.1) |
| Mental/behavioural disorder secondary to substance abuse | 7475 (24.4) |
| Mood disorder | 5093 (16.6) |
| Intentional self-harm | 4676 (15.3) |
| Behavioural/emotional disorders | 3703 (12.1) |
| Psychosis-related illness | 759 (2.5) |
| Personality-related disorder | 593 (1.9) |
| Behavioural syndrome | 304 (1.0) |
| Unspecified | 64 (0.2) |
| Canadian Triage and Acuity Scale level | |
| 1 (resuscitative) | 166 (0.5) |
| 2 (emergency) | 3580 (11.7) |
| 3 (urgent) | 11,318 (36.9) |
| 4 (less urgent) | 7310 (23.8) |
| 5 (nonurgent) | 1621 (5.3) |
| Not available* | 6661 (21.7) |
| Geographical location | |
| Urban emergency department | 18,493 (60.3) |
| Rural emergency department | 12,163 (39.7) |
| Disposition | |
| Discharge | 24,916 (81.3) |
| Admission | 4154 (13.6) |
| Left before completion of medical care | 752 (2.5) |
| Transferred | 817 (2.7) |
| Died | 17 (0.1) |
Mandatory reporting for urban emergency departments as of April 1, 2006
ED wait and treatment times stratified according to CTAS level are summarized in Table 2. With the exception of CTAS 5 visits, median ED wait times for pediatric mental health visits exceeded national benchmarks. Overall median wait times from 2006 to 2008 were longest for visits triaged as urgent (CTAS 3; median [IQR] 1 h 46 min [59 min, 2 h 53 min]) and less urgent (CTAS 4; 1 h 45 min [57 min, 2 h 47 min]) (Table 2, Figure 1). The most common mental health diagnoses for these visits were anxiety/stress-related disorders (26.4%) and mental/behavioural disorders secondary to substance abuse (22.9%). From 2006 to 2008, ED wait times decreased the most (% change) for CTAS 1 visits (a 67% reduction in wait time) and increased the most for CTAS 5 visits (an 18% increase in wait time) and CTAS 2 visits (a 17% increase in wait time). The longest median treatment times from 2006 to 2008 were for visits triaged with the highest level of acuity, CTAS 1 (4 h 41 min [1 h 57 min, 6 h 51 min]) and CTAS 2 (4 h 12 min [2 h 23 min, 8 h 22 min]) (Table 2, Figure 2). The most common diagnoses for this level of visit acuity were mental/behavioural disorders secondary to substance abuse (41.1%) and intentional self-harm (32.1%) (Figure 3). From 2006 to 2008, ED treatment times decreased for all CTAS levels with the exception of CTAS 5 visits, which exhibited a 53% increase. Median wait times for lower-acuity visits exceeded treatment times (CTAS 4: 1 h 45 min versus 1 h 8 min; CTAS 5: 1 h 5m versus 52 min).
TABLE 2.
Emergency department wait and treatment times for the 2006/2007 and 2007/2008 fiscal years according to CTAS level, n and median (interquartile range)
| CTAS | 2006/2007 | 2007/2008 | % change for median time between years | Overall median time (2006 to 2008) | National wait time benchmark (fractile response) |
|---|---|---|---|---|---|
| 1 | wait (n=5): 9 min (1 min, 16 min) | wait (n=8): 3 min (3 min, 5 min) | ↓67 | wait (n=13): 3 min (1 min, 10 min) | 0 min (98%) |
| treatment (n=5): 5 h 26 min (5 h 16 min, 9 h 7 min) | treatment (n=11): 4 h 1 min (1 h 47 min, 5 h 25 min) | ↓26 | treatment (n=16): 4 h 41 min (1 h 57 min, 6 h 51 min) | ||
| 2 | wait (n=200): 52 min (26 min, 1 h 43 min) | wait (n=247): 1 h 1 min (28 min, 1 h 58 min) | ↑1 | wait (n=447): 57 min (27 min, 1 h 52 min) | ≤15 min (95%) |
| treatment (n=200): 4 h 13 min (2 h 23 min, 8 h 13 min) | treatment (n=254): 4 h 11 min (2 h 24 min, 8 h 22 min) | ↓1 | treatment (n=454): 4 h 12 min (2 h 23 min, 8 h 22 min) | ||
| 3 | wait (n=665): 1 h 40 min (56 min, 2 h 41 min) | wait (n=735): 1 h 53 min (1 h 3 min, 3 h 6 min) | ↑13 | wait (n=1400): 1 h 46 min (59 min, 2 h 53 min) | ≤30 min (90%) |
| treatment (n=677): 2 h 7 min (56 min, 4 h 12 min) | treatment (n=756): 1 h 55 min (44 min, 4 h 5 min) | ↓9 | treatment (n=1433): 2 h 1 min (49 min, 4 h 10 min) | ||
| 4 | wait (n=265): 1 h 46 min (1 h 4 min, 2 h 46 min) | wait (n=259): 1 h 41 min (54 min, 2 h 57 min) | ↓5 | wait (n=524): 1 h 45 min (57 min, 2 h 47 min) | ≤60 min (85%) |
| treatment (n=275): 1 h 34 min (35 min, 2 h 51 min) | treatment (n=299): 55 min (23 min, 2 h 5 min) | ↓41 | treatment (n=574): 1 h 8 min (28 min, 2 h 25 min) | ||
| 5 | wait (n=23): 56 min (36 min, 1 h 39 min) | wait (n=37): 1 h 6 min (42 min, 1 h 50 min) | ↑18 | wait (n=60): 1 h 5 min (40 min, 1 h 51 min) | ≤120 min (80%) |
| treatment (n=25): 36 min (26 min, 1 h 18 min) | treatment (n=51): 55 min (15 min, 2 h 6 min) | ↑53 | treatment (n=76): 52 min (22 min, 2 h 0 min) |
↓ Decreased; ↑ Increased; CTAS Canadian Triage and Acuity Scale
Figure 1).
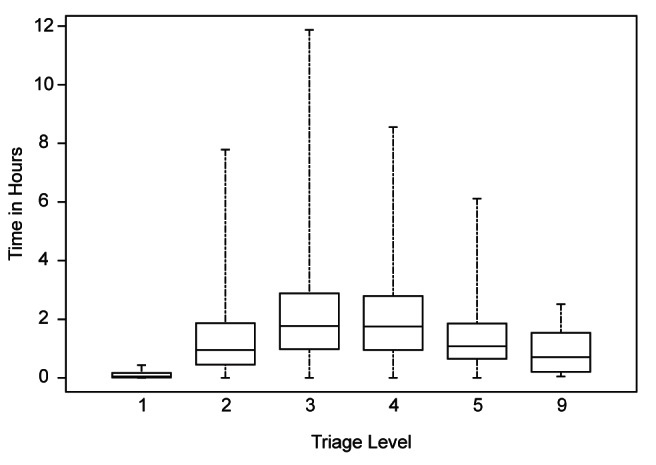
Wait time according to triage level. Canadian Triage and Acuity Scale (CTAS) level 1, resuscitative; 2, emergency; 3, urgent; 4, less urgent; 5, nonurgent; 9, CTAS data unavailable
Figure 2).
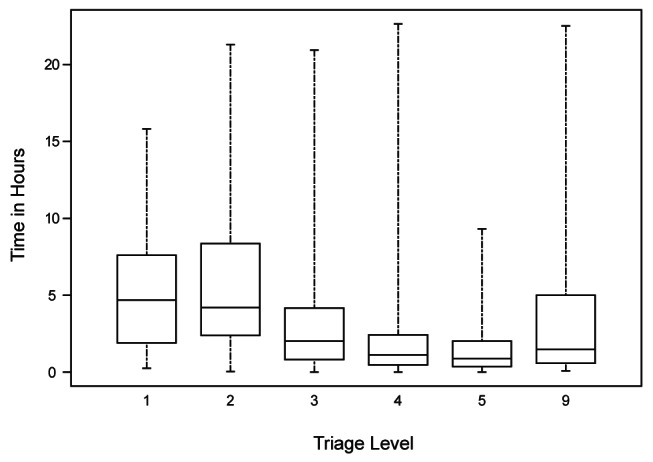
Treatment time according to triage level. Canadian Triage and Acuity Scale (CTAS) level 1, resuscitative; 2, emergency; 3, urgent; 4, less urgent; 5, nonurgent; 9, CTAS data unavailable
Figure 3).
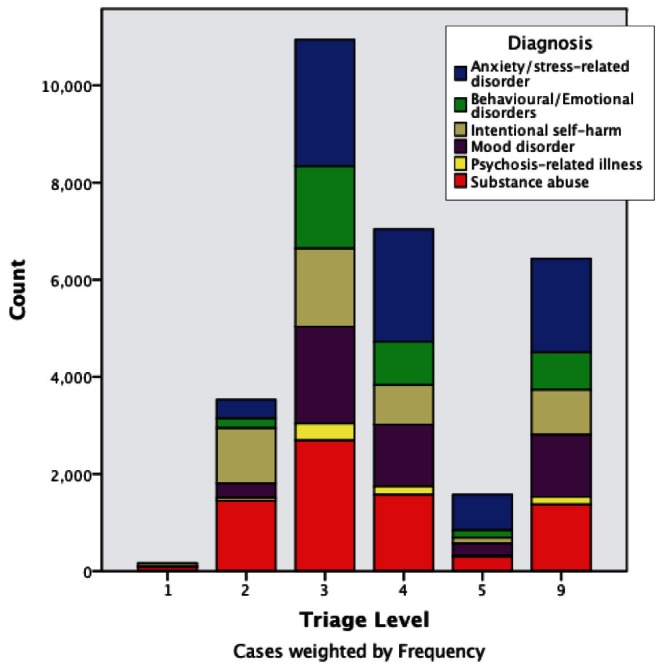
Discharge diagnosis according to triage level.The following diagnostic groups are not visually represented due to low numbers: behavioural syndrome, personality-related disorder and unspecified
A post-hoc comparison of wait time and institution location revealed that wait and treatment times in urban-based EDs were shorter than those in rural-based EDs. The wait time in urban EDs was 59 min (33 min, 1 h 45 min) versus a wait of 1 h 45 min (55 min, 2 h 51 min) in rural EDs. The treatment time in urban EDs was 1 h 3 min (25 min, 2 h 23 min) versus a treatment time of 2 h 27 min (56 min, 4 h 38 min) in rural-based EDs.
As shown in Table 3, the overall median LOS for all ED visits for pediatric mental health increased during the study period, but met national benchmarks overall. ED LOS was longest for visits triaged as emergencies (CTAS 2) (4 h 50 min [2 h 50 min, 8 h 6 min]) and shortest for visits triaged as nonurgent visits (CTAS 5) (1 h 8 min [40 min, 2 h 7 min]). LOS increased from 2002 to 2008, with the most significant increases observed for CTAS 1 visits (an increase of 139%). The change in LOS from 2006/2007 to 2007/2008, however, represented a decrease of 9%. ED LOS increased from 2006/2007 to 2007/2008 for CTAS 2 visits (an 8% increase) and CTAS 5 visits (a 13% increase).
TABLE 3.
Emergency department length of stay (LOS) according to fiscal year and Canadian Triage and Acuity Scale (CTAS) level
| CTAS level |
Fiscal year
|
% change for median time (2002–2008) | Overall LOS (all years) | National LOS benchmark | |||||
|---|---|---|---|---|---|---|---|---|---|
| 2002–2003 | 2003–2004 | 2004–2005 | 2005–2006 | 2006–2007 | 2007–2008 | ||||
| 1 | n=19 2 h 2 min (52 min, 3 h 45 min) |
n=27 3 h 8 min (1 h 15 min, 5 h 54 min) |
n=21 2 h 33 min (2 h 7 min, 4 h 32 min) |
n=34 4 h 14 min (1 h 46 min, 7 h 38 min) |
n=25 5 h 21 min (2 h, 9 h 21 min) |
n=40 4 h 51 min (1 h 47 min, 7 h 30 min) |
↑139 | n=166 3 h 53 min (1 h 39 min, 7 h 22 min) |
<6 h |
| 2 | n=241 4 h 32 min (2 h 27 min, 7 h 28 min) |
n=500 4 h 28 min (2 h 31 min, 7 h 55 min) |
n=622 4 h 31 min (2 h 45 min, 7 h 40 min) |
n=640 4 h 49 min (2 h 40 min, 7 h 59 min) |
n=684 4 h 52 min (3 h, 8 h 1 min) |
n=893 5 h 16 min (3 h 11 min, 8 h 48 min) |
↑16 | n=3580 4 h 50 min (2 h 50 min, 8 h 6 min) |
<6 h |
| 3 | n=1075 3 h (1 h 42 min, 5 h 9 min) |
n=1605 3 h 17 min (1 h 53 min, 5 h 45 min) |
n=2115 3 h 21 min (2 h 3 min, 5 h 27 min) |
n=2066 3 h 30 min (2 h 3 min, 5 h 49 min) |
n=2240 3 h 42 min (2 h 9 min, 6 h 7 min) |
n=2217 3 h 41 min (2 h 9 min, 6 h 13 min) |
↑23 | n=11,318 3 h 29 min (2 h 1 min, 5 h 50 min) |
<6 h |
| 4 | n=1057 2 h 14 min (1 h 8 min, 4 h 11 min) |
n=1154 2 h 12 min (1 h 7 min, 3 h 53 min) |
n=1241 2 h 28 min (1 h 11 min, 4 h 23 min) |
n=1320 2 h 22 min (1 h 16 min, 4 h 23 min) |
n=1296 2 h 21 min (1 h 13 min, 4 h 16 min) |
n=1242 2 h 16 min (1 h 6 min, 4 h 19 min) |
↑1 | n=7310 2 h 19 min (1 h 11 min, 4 h 14 min) |
4 h |
| 5 | n=205 1 h 3 min (38 min, 2 h 11 min) |
n=213 1 h 8 min (39 min, 2 h 25 min) |
n=248 1 h 9 min (38 min, 2 h 5 min) |
n=285 1 h 2 min (36 min, 1 h 50 min) |
n=326 1 h 7 min (41 min, 2 h) |
n=344 1 h 16 min (45 min, 2 h 43 min) |
↑21 | n=1621 1 h 8 min (40 min, 2 h 7 min) |
4 h |
Data presented as n, median (interquartile range) unless otherwise indicated. ↑ Increased
DISCUSSION
While recent studies suggest that pediatric mental health ED visits involve long LOS (17–19), there is a lack of clarity regarding how much ED LOS are reflected in lower visit acuity (eg, potentially longer wait times) (19,25), resource intensiveness due to acute behaviours and clinical investigations (eg, potentially longer treatment times) (18,26–28), and/or limited clinical resources (eg, potentially shorter treatment times) (19). The present analysis was the first Canadian study to clarify and quantify ED LOS for pediatric mental health visits. We found that while the overall median wait times for CTAS levels 1, 2, 3 and 4 exceeded national recommendations (3), the overall median ED LOS for pediatric mental health visits in Alberta met national recommendations (20). By quantifying wait and treatment times, we were able to identify periods during the ED stay that would benefit from further investigation to ensure ED throughput and patient experiences are optimized.
With the exception of pediatric mental health visits requiring nonurgent care (CTAS 5), all other median wait times for each CTAS level exceeded national benchmarks (3). Contrary to our hypothesis that longer wait times would correspond to CTAS levels (eg, longer waits for lower-acuity CTAS visits), the longest median wait times were for urgent (CTAS 3) and less urgent (CTAS 4) visits while nonurgent (CTAS 5) visits exhibited shorter wait times, similar to CTAS 2 visits. Typically, CTAS 5 patients can be seen in ‘clinical fast track’ areas of the ED, where patients are treated and discharged more quickly, which may explain a wait time comparable with more urgent visits. While there was a notable 18% increase in wait time from 2006/2007 to 2007/2008 for CTAS 5 visits, times remained below national benchmarks, and it may be that clinical fast tracking for nonurgent care is one clinical model that has helped clinicians manage waits and promote more timely ED throughput to care for more urgent but clinically stable presenting complaints. Given that treatment times actually increased by 53% during the same time that wait times decreased for CTAS 5 visits, a detailed examination of more recent data (2008 to 2012) as well as factors related to treatment delay is warranted, but was outside of the scope of the present study. Delays in the time to specialty assessments (eg, psychiatry, social work) and discharge planning may be areas in which EDs can develop benchmarks for tracking and monitoring to ensure that ED LOS for lower-acuity visits is as short as possible to maximize resources for higher-acuity visits.
Triage-associated initiatives shown to improve timelines to care may help to address the long wait times observed for CTAS 3 and 4 visits, where the patient may not be as medically stable as patients seen in clinical fast-track areas. These initiatives include having a health care provider (ie, nurse practitioner, physician assistant) in the triage area to perform initial assessments and initiate diagnostic tests or referrals to other mental health services (29), general practice clinics adjacent to the ED to divert patients (30), and bedside registration/triage, which involves the primary care nurse working alongside registration staff at a mobile computer station to log the presenting complaints and initial assessment (31).
Parent dissatisfaction with care (32) and leaving the ED before the child is seen by a physician for diagnosis and treatment (33) are two outcomes documented as a result of longer wait times for children. The frequency of premature ED departure for pediatric mental health visits (range 1.9% to 4.3%) (19,25) is comparable with findings for other pediatric ED visits (range 3% to 5.5%) (33,34), which suggests that lengthy wait times (such as the case for CTAS 3 visits) may not be a deterrent for individuals waiting for mental health care. In a study by Goldman et al (33), children who left the ED early were more likely to be taken elsewhere for care. Whether differences exist in a parent’s/child’s reasons for enduring ED waits for mental health concerns (eg, other health care venues have already been pursued or families are desperate for help and regard the ED as their only remaining option) is not known, but may help to explain motivations for accessing acute care services and quantify parent/child satisfaction with care following this wait period. Using the present descriptive study as impetus, future research is also needed to explore whether longer waits are associated with adverse outcomes and to ensure that ED throughput is optimized.
ED use for less urgent conditions do not factor into long wait times or delays in ED throughput (3), and most EDs can handle these cases efficiently. Less urgent visits are suggested to involve shorter treatment times because these visits often require minimal medical/nursing intervention and usually require only assessment and reassurance. In the present study, and as hypothesized, we found that treatment times for pediatric mental health visits decreased with level of urgency, with a marked difference between CTAS 3 and 4 visits (median CTAS 3 time 2 h 1 min versus median CTAS 4 time 1 h 8 min). Given that wait times for these visits tend to be longer, it may be of value to investigate parent and child satisfaction with the ED visit because expectations following a lengthy wait time may include less time interacting with ED care providers. The adequacy of information provided during provider-patient interactions and the quality of this interaction has been associated with satisfaction (32) and also warrants exploration for pediatric mental health visits. Interaction quality is of particular importance given the results of a recent study showing that pediatric mental health visits often involve inadequate mental health assessments, counselling and discharge recommendations (19). As suggested previously, the length of treatment time may also reflect the time it takes to arrange multiple resources including specialty consultations, versus ‘active treatment’ time. ED administrators may want to develop ‘time and outcome benchmarks’ for tracking and monitoring treatment times to ensure that bottlenecks in care are flagged and addressed.
On a final note, in our post hoc analyses, we found that wait and treatment times were longer for visits to rural EDs. These findings may be explained by a lack of mental health resources that are more readily available at larger centres. A shortage of trained emergency physicians able to manage patients with mental health concerns, as well as an inability of rural physicians to transfer patients requiring a higher level of care to urban receiving facilities due to these facilities being full, may also explain longer wait and treatment times at rural EDs. Further investigation is required to determine whether differences in wait and treatment times are reflected in patient outcomes and whether there are important disparities regarding where children receive emergency mental health care.
Limitations
There are several limitations to the present study. First, the availability of wait and treatment time data was limited to the final two fiscal years of the present study, and is reflected in the mandatory versus optional provincial reporting guidelines for the ACCS database we used. For example, the proportion of pediatric patients triaged to CTAS 1 with wait and treatment time data was low (only 8% of wait and 10% of treatment times available for 166 ED visits) and, although reflective of the relatively small proportion of pediatric mental health triaged at this level (19,25), the generalizability of our conclusions including trends over time for this CTAS level and level 5 (only 4% of wait and 5% of treatment times were available for 1621 visits) remains limited. The sample sizes for wait and treatment time data for visits at the other CTAS levels were larger and provided us with more confidence in our findings, as did our analyses of the LOS data, which were available for all visits in our dataset. Second, the trends detailed in the present study provide a starting point to further investigations of ED wait and treatment times and LOS, and analysis of more recent data (2008 to 2012) is desirable. The present study should be viewed as a catalyst for further study on the topic and a reference point to support ED strategies and metrics for managing ED mental health visits. Finally, we did not collect reference data on all pediatric ED presentations. While the use of a comparison group was not part of the objectives of the present study, and its use varies in the published literature (10,17,35–37), such data would help contextualize time trends relative to other pediatric presentations. Even without these comparison data, however, it is clear that ED wait and treatment times for pediatric mental health visits warrant further discussion to ensure that visits are safe and effective for children. Importantly, for ED administrators, whether wait or treatment times for mental health visits are longer or shorter compared with other visits may not matter administratively as much as establishing universal metrics to ensure that ED throughputs for these patients and others are optimized.
CONCLUSION
Our findings indicate that median wait times for pediatric mental health patients triaged from CTAS 1 to 4 exceeded national recommendations, although the ED LOS for these patients did not exceed national recommendations. Future research should explore whether longer waits are associated with adverse outcomes, examine child and parent experiences in the ED and, most importantly, determine which clinical management strategies can expedite wait and treatment times to ensure safe and effective emergency mental health care.
Footnotes
DISCLAIMER: This study was based, in part, on data provided by Alberta Health. The interpretation and conclusions contained herein are those of the researchers and do not necessarily represent the views of the Government of Alberta. Neither the Government nor Alberta Health express any opinion in relation to this study.
REFERENCES
- 1.Canadian Institute for Health Information (CIHI) Ottawa, Ontario: CIHI; 2005. Understanding emergency department wait times. Who is using emergency departments and how long are they waiting? < https://secure.cihi.ca/free_products/Wait_times_e.pdf> (Accessed April 17, 2012). [Google Scholar]
- 2.Canadian Institute for Health Information (CIHI) Understanding emergency department wait times. How long to people spend in emergency departments in Ontario? Ottawa, Ontario: CIHI; Jan, 2007. < https://secure.cihi.ca/free_products/emergency_department_wait_times_e.pdf> (Accessed April 17, 2012). [Google Scholar]
- 3.Canadian Association of Emergency Physicians (CAEP) Taking action on the issue of overcrowding in Canada’s emergency departments. CAEP. 2005 Jun 16; < www.waittimealliance.ca/waittimes/CAEP.pdf> (Accessed April 17, 2012). [Google Scholar]
- 4.Guttman A, Schull MJ, Vermeulen MJ, et al. Association between waiting times and short term mortality and hospital admission after departure from emergency department: Population based cohort study from Ontario, Canada. BMJ. 2011;342:d2983. doi: 10.1136/bmj.d2983. [DOI] [PMC free article] [PubMed] [Google Scholar]
- 5.Liew D, Liew D, Kennedy MP. Emergency department length of stay independently predicts excess inpatient length of stay. Med J Aust. 2003;179:524–6. doi: 10.5694/j.1326-5377.2003.tb05676.x. [DOI] [PubMed] [Google Scholar]
- 6.Sprivulis PC, Da Silva JA, Jacobs IG, et al. The association between hospital overcrowding and mortality among patients admitted via Western Australian emergency departments. Med J Aust. 2006;184:208–12. doi: 10.5694/j.1326-5377.2006.tb00416.x. [DOI] [PubMed] [Google Scholar]
- 7.Ackroyd-Stolarz S, Guernsey J, MacKinnon N, et al. Is a prolonged length of stay in the emergency department associated with adverse events in older patients? Acad Emerg Med. 2008;15:S67. [Google Scholar]
- 8.Arkun A, Briggs WM, Patel S, et al. Emergency department crowding: Factors influencing flow. West J Emerg Med. 2010;11:10–5. [PMC free article] [PubMed] [Google Scholar]
- 9.Elkum N, Fahim M, Shoukri M, et al. Which patients wait longer to be seen and when? A waiting time study in the emergency department. East Mediterr Health J. 2009;15:416–24. [PubMed] [Google Scholar]
- 10.Bekmezian A, Chung PJ, Cabana MD, et al. Factors associated with prolonged emergency department length of stay for admitted children. Pediatr Emer Care. 2011;27:110–5. doi: 10.1097/PEC.0b013e31820943e4. [DOI] [PubMed] [Google Scholar]
- 11.Pines JM, Russell Localio A, Hollander JE. Racial disparities in emergency department length of stay for admitted patients in the United States. Acad Emerg Med. 2009;16:403–10. doi: 10.1111/j.1553-2712.2009.00381.x. [DOI] [PubMed] [Google Scholar]
- 12.Fee C, Burstin H, Maselli JH, et al. Association of emergency department length of stay with safety-net status. JAMA. 2012;307:476–82. doi: 10.1001/jama.2012.41. [DOI] [PMC free article] [PubMed] [Google Scholar]
- 13.Herring A, Wilper A, Himmelstein DU, et al. Increasing length of stay among adult visits to US emergency departments, 2001–2005. Acad Emerg Med. 2009;16:609–16. doi: 10.1111/j.1553-2712.2009.00428.x. [DOI] [PubMed] [Google Scholar]
- 14.Dolan MA, Fein JA, the Committee on Pediatric Emergency Medicine Technical report: Pediatric and adolescent mental health emergencies in the emergency medical services system. Pediatrics. 2011;127:e1356–66. doi: 10.1542/peds.2011-0522. [DOI] [PubMed] [Google Scholar]
- 15.American Academy of Pediatrics, Committee on Pediatric Emergency Medicine Pediatric mental health emergencies in the emergency medical services system. Pediatrics. 2006;118:1764–7. doi: 10.1542/peds.2006-1925. [DOI] [PubMed] [Google Scholar]
- 16.Cooper JL, Masi R. Unclaimed children revisited (Issue Brief No 1): Child and youth emergency mental health care: A national problem. Columbia University, NY: National Center for Children in Poverty; Jul, 2007. < www.nccp.org/publications/pdf/text_750.pdf> (Accessed April 2, 2013). [Google Scholar]
- 17.Wassem M, Prasankumar R, Pagan K, et al. A retrospective look at length of stay for pediatric psychiatric patients in an urban emergency department. Pediatr Emer Care. 2011;27:170–3. doi: 10.1097/PEC.0b013e31820d644b. [DOI] [PubMed] [Google Scholar]
- 18.Christodulu KV, Lichenstein R, Weist M, et al. Psychiatric emergencies in children. Pediatr Emer Care. 2002;18:268–70. doi: 10.1097/00006565-200208000-00009. [DOI] [PubMed] [Google Scholar]
- 19.Newton AS, Ali S, Hamm MP, et al. Exploring differences in the clinical management of pediatric mental health in the emergency department. Pediatr Emer Care. 2011;27:275–83. doi: 10.1097/PEC.0b013e31821314ca. [DOI] [PubMed] [Google Scholar]
- 20.Canadian Association of Emergency Physicians Position statement on emergency department overcrowding. Canadian Association of Emergency Physicians Board Approved June 2009. < http://caep.ca/sites/default/files/caep/files/edoc_position_statement_board_approved_june_2009_gl.pdf> (Accessed April 2, 2013).
- 21.Gravel J, Manzano S, Arsenault M. Validity of the Canadian Paediatric Triage and Acuity Scale in a tertiary care hospital. CJEM. 2009;11:23–8. doi: 10.1017/s1481803500010885. [DOI] [PubMed] [Google Scholar]
- 22.Warren DW, Jarvis A, LeBlanc L, et al. CTAS National Working Group; Canadian Association of Emergency Physicians. National Emergency Nurses Affiliation. Association des Medecins d’Urgence du Quebec. Canadian Paediatric Society. Society of Rural Physicians of Canada Revisions to the Canadian Triage and Acuity Scale paediatric guidelines (PaedCTAS) CJEM. 2008;10:224–43. [PubMed] [Google Scholar]
- 23.World Health Organization International Statistical Classification of Diseases and Related Health Problems. < www.who.int/classifications/icd/en> (Accessed April 2, 2013).
- 24.Statistics Canada . 1996 Census Dictionary, Final Edition. Ottawa: Statistics Canada; 1999. [Google Scholar]
- 25.Newton AS, Ali S, Johnson DW, et al. A 4-year review of pediatric mental health emergencies in Alberta. CJEM. 2009;11:447–54. doi: 10.1017/s1481803500011647. [DOI] [PubMed] [Google Scholar]
- 26.Santiago LI, Tunik MG, Foltin GL, et al. Children requiring psychiatric consultation in the pediatric emergency department. Pediatr Emer Care. 2006;22:85–9. doi: 10.1097/01.pec.0000199568.94758.6e. [DOI] [PubMed] [Google Scholar]
- 27.Grupp-Phelan J, Mahajan P, Foltin GL, et al. Pediatric Emergency Care Applied Research Network. Referral and resource use patterns for psychiatric-related visits to pediatric emergency departments. Pediatr Emer Care. 2009;25:217–20. doi: 10.1097/pec.0b013e31819e3523. [DOI] [PubMed] [Google Scholar]
- 28.Meunier-Sham J, Needham M. Increased volume/length of stay for pediatric mental health patients: One ED’s response. J Emerg Nurs. 2003;29:229–39. doi: 10.1067/men.2003.98. [DOI] [PubMed] [Google Scholar]
- 29.Love RA, Murphy JA, Lietz TE, Jordan KS. The effectiveness of a provider in triage in the emergency department: A quality improvement initiate to improve patient flow. Adv Emerg Nurs J. 2012;34:65–74. doi: 10.1097/TME.0b013e3182435543. [DOI] [PubMed] [Google Scholar]
- 30.Sharma A, Inder B. Impact of a co-located general practitioner (GP) clinics and patient choice on duration of wait in the emergency department. Emerg Med J. 2011;28:658–61. doi: 10.1136/emj.2009.086512. [DOI] [PubMed] [Google Scholar]
- 31.Handel D, Epstein S, Khare R, et al. Interventions to improve the timeliness of emergency care. Acad Emerg Med. 2011;18:1295–302. doi: 10.1111/j.1553-2712.2011.01230.x. [DOI] [PubMed] [Google Scholar]
- 32.Magaret ND, Clark TA, Warden CR, et al. Patient satisfaction in the emergency department – a survey of pediatric patients and their parents. Acad Emerg Med. 2002;9:1379–88. doi: 10.1197/aemj.9.12.1379. [DOI] [PubMed] [Google Scholar]
- 33.Goldman RD, Macpherson A, Schuh S, et al. Patients who leave the pediatric emergency department without being seen: A case-control study. CMAJ. 2005;172:39–43. doi: 10.1503/cmaj.1031817. [DOI] [PMC free article] [PubMed] [Google Scholar]
- 34.Browne GJ, McCaskill ME, Giles H, et al. Paediatric walk-out patients: Characteristics and outcomes. J Paediatr Child Health. 2001;37:235–9. doi: 10.1046/j.1440-1754.2001.00648.x. [DOI] [PubMed] [Google Scholar]
- 35.Horwitz L, Bradley EH. Percentage of US emergency department patients seen within the recommended triage time: 1997 to 2006. Arch Intern Med. 2009;169:1857–65. doi: 10.1001/archinternmed.2009.336. [DOI] [PMC free article] [PubMed] [Google Scholar]
- 36.Horwitz L, Green J, Bradley EH. US emergency department performance on wait time and length of visit. Ann Emerg Med. 2010;55:133–41. doi: 10.1016/j.annemergmed.2009.07.023. [DOI] [PMC free article] [PubMed] [Google Scholar]
- 37.Case SD, Case BG, Olfson M, et al. Length of stay of pediatric mental health emergency department visits in the United States. J Am Acad Child Adolesc Psychiatry. 2011;50:1110–9. doi: 10.1016/j.jaac.2011.08.011. [DOI] [PMC free article] [PubMed] [Google Scholar]