

Abstract
Bone formation in a variety of contexts depends on angiogenesis, however there are few reports of the vascular response to osteogenic skeletal loading. We used the rat forelimb compression model to characterize vascular changes after fatigue loading. The right forelimbs of 72 adult rats were loaded cyclically in vivo to one of four displacement levels, to produce four discrete levels of ulnar damage. Rats were euthanized 3–14 days after loading and their vasculature perfused with silicone rubber. Transverse histological sections were cut along the ulnar diaphysis. We quantified vessel number, average vessel area, total vessel area and bone area. On day 3 we observed a dramatic periosteal expansion near the ulnar midshaft, with significant increases in periosteal vascularity; total vessel area was increased 250–450% (p<0.001). Vascularity remained elevated on days 7 and 14. Vessel number and average vessel area were not correlated (p=0.09) and contributed independently to total vascular increases. Bone area was not increased on day 3, but on days 7 and 14 was increased significantly in all displacement groups (p<0.01) due to periosteal woven bone formation. Vascular and bone changes depended on longitudinal location (p<0.001), with peak increases 2 mm distal to the midshaft. Vascular and bone changes also depended on displacement level (p<0.005), with greater increases at higher levels of fatigue displacement. We conclude that skeletal fatigue loading induces a rapid increase in periosteal vascularity, followed by an increase in bone area. The angiogenic-osteogenic response is spatially coordinated and scaled to the level of the mechanical stimulus.
Introduction
There is abundant evidence of a strong linkage between bone formation (osteogenesis) and the formation of new blood vessels (vasculogenesis or angiogenesis) [1]. For example, angiogenesis plays an important role during skeletal development [2–4], fracture healing [5, 6], distraction osteogenesis [7–11] and cortical defect healing [12].
Repetitive mechanical loading is a powerful stimulus for new bone formation [13, 14]. Despite the critical link between angiogenesis and bone formation noted above, there is little known about changes in vascularity following repetitive skeletal loading. Treadmill running in rats has been shown to stimulate increases in vascularity and trabecular bone density [15, 16], and increased blood flow in bone has been reported following fatigue loading [17]. To our knowledge, these are the only reports describing quantitative vascular responses to skeletal loading.
One animal model that has been widely utilized to examine skeletal responses to loading is compression of the rat forelimb [18]. While most studies of rat forelimb compression have focused on induction of lamellar bone formation in response to “mild overload” conditions, we and others have observed a rapid woven bone response after damaging fatigue loading [19, 20]. Recently, skeletal responses to fatigue loading have been detected by imaging 18F-fluoride uptake using positron emission tomography (PET) [21], and we reported that fluoride uptake was increased in a dose-response manner with increasing levels of fatigue displacement [22]. Because fluoride uptake is influenced by any factor that increases blood flow or exposed mineral surface [23, 24], we concluded that the fluoride uptake observed ~1 week after loading reflected a combination of increased vascularity and new bone formation [22]. Qualitative histological observations supported this conclusion, but we did not quantify the changes in vascularity and osteogenesis separately.
Compression of the rat forelimb causes bending of the curved ulna, leading to gradients in mechanical strain [18, 25–27]. In the central region of the ulna, the strain magnitude within the cross-section is greatest on the medial (compressive) periosteal surface; longitudinally, the strain magnitude is greatest 1–3 mm distal to the midpoint [27, 28]. The cross-sectional and longitudinal strain distributions correspond well to the pattern of bone formation observed following loading; peak measures of osteogenesis occur on the medial periosteal surface, 1–3 mm distal to the midpoint [25, 27–29]. The strain distribution also correlates with the pattern of crack formation observed after damaging fatigue loading, where cracks are consistently observed on the medial half of the cross-section and are centered ~1 mm distal to the midpoint [20, 30, 31]. Because of the documented spatial patterns of ulnar bone formation and damage following rat forelimb loading, we asked if a similar pattern of angiogenesis occurs after loading.
Our objective was to use the rat forelimb compression model to characterize the vascular changes that occur in response to fatigue loading. Using an established protocol [31], we assessed the qualitative and quantitative changes in periosteal vascularity. We hypothesized that: 1) fatigue loading stimulates increases in periosteal vasculature; 2) fatigue-induced increases in ulnar vascularity occur in a spatially similar pattern as increases in bone formation; and 3) the magnitude of the vascular changes depend on the level of applied fatigue displacement.
Materials and Methods
Experimental Design
A total of 72 male Fischer/NHsd rats (4.5 – 5.5 months old; 339 ± 25 g; Harlan) were used. Rats were assigned randomly to one of four loading groups according to the level of imposed fatigue displacement: 30, 45, 65 or 85% of the average displacement to fracture (2 mm). We have shown previously that these displacement levels correspond to four discrete levels of ulnar damage, with reductions in whole-bone strength at time-zero of 10, 20, 40 and 60%, respectively [31]. Left forelimbs were not loaded and were used as controls. Rats were euthanized 3, 7 or 14 days after loading. Thus, we had 12 experimental groups with six rats per group. All procedures were approved by our institutional Animal Studies Committee.
In Vivo Mechanical Loading
The loading protocol was modified from the method of Bentolila et al. [32] and has been described in detail recently [31]. Briefly, the animals were anesthetized with 1–3% isofluorane gas. Right forelimbs were positioned in a loading fixture connected to a servohydraulic materials testing machine (Instron 1331/8500R) and a 0.3 N compressive pre-load applied. The forelimbs were then cyclically loaded using a 2 Hz haversine waveform to a peak compressive force of 0.055 N/g BW (average 18.6 N) until the actuator reached the prescribed increase in axial displacement (0.6, 0.9, 1.3 or 1.7 mm). The average number of loading cycles ranged from 1650 to 5287 (Table 1). After loading the animals received an intramuscular injection of an analgesic (0.05 mg/kg buprenorphine). They were returned to their cages and allowed unrestricted activity and ad libitum access to water and chow.
Table 1.
Number of in vivo loading cycles applied to the right forelimb
| Fatigue Displacement (% of fracture displacement [2 mm] as determined previously [31]) | Mean | SD | Min | Max |
|---|---|---|---|---|
| 30 | 1650 | 1438 | 292 | 5258 |
| 45 | 3097 | 3246 | 273 | 12247 |
| 65 | 3363 | 3279 | 278 | 13836 |
| 85 | 5287 | 4848 | 420 | 16778 |
Vascular Perfusion
At 3, 7 or 14 days after loading, the rats were anesthetized by intraperitoneal injection of ketamine (87 mg/kg) and xylazine (13 mg/kg). Through a longitudinal incision at the center of the chest, the left ribs were severed from the sternum to expose the heart. An 18-gauge plastic catheter was inserted into the left ventricle and held in place with sutures; all injections were via the catheter. Ten ml heparin (100 USP units/ml) and 5 ml lidocaine (2%) were injected to inhibit clotting and promote vasodilation, respectively. The rats were then killed by exsanguination through a small incision at the right atrium. The vasculature was irrigated with 100 ml saline; drainage was via the right atrium. A silicone rubber solution (100 ml) (MICROFIL®, MV-122, Flow Tech, Inc.) was injected until sufficient perfusion was confirmed visually by color change (yellow) at the ends of the digits, and leakage of the liquid rubber from an incision made at the volar surface of the forepaw. Following injection, the specimens were store at 4 °C overnight to allow the rubber to cure.
Histological Processing and Analysis
The attached ulna and radius were dissected along with a small amount of the muscle tissue to preserve the periosteal layer. Specimens were fixed with 10% formalin for 48 hours and decalcified in 14% ethylenediamine-tetraacetic acid (EDTA) for 3 weeks. The central portion of each forelimb was then sectioned transversely into 2 mm blocks and the blocks embedded in paraffin. Thin (5 μm) sections were cut from the face of each block and mounted on glass slides. Thus, sections were obtained at five sites along the length of each ulna (Fig. 1). Slides were either left unstained, stained with toluidine blue, or stained with hemaetoxylin and eosin. Toluidine blue- and H&E-stained sections were examined by a pathologist (D.N.) for qualitative assessment of the tissue response to loading.
Figure 1.
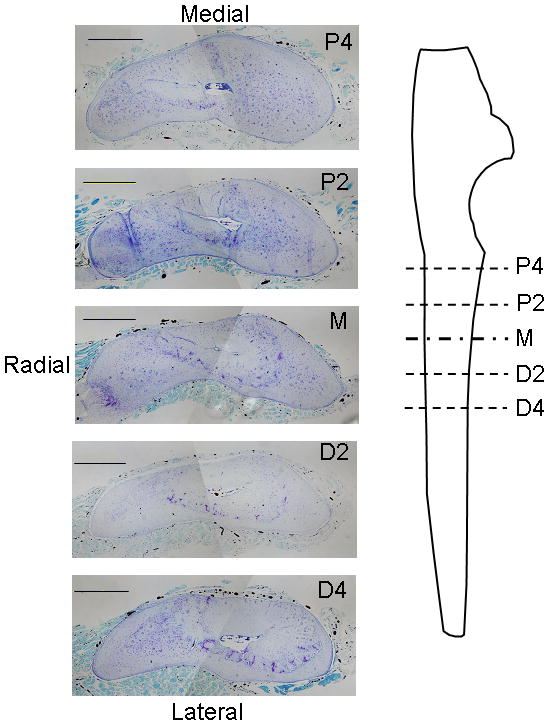
Photomicrographs of transverse histological sections from a control (left) ulna at five sites along the ulnar length. Perfused vessels were easily visualized as opaque areas within the thin periosteal layer, as well as within bone and muscle. (stained with toluidine blue; scale bar = 500μm) P4: 4 mm proximal to the midpoint; P2: 2 mm proximal to the midpoint; M: midpoint; D2: 2 mm distal to the midpoint; D4: 4 mm distal to the midpoint.
For quantitative analysis, a complete set of un-stained and toluidine blue-stained sections were viewed under a light microscope (Olympus BX-51) at 10x objective and digital images were captured (1360 x 1024 pixels; 1.25 μm/pixel; Olympus DP-30). From these, composite images of the complete ulnar section were constructed (Adobe Photoshop). Unstained images were used for quantitative assessment of blood vessels by a single operator (H.M.). The surrounding muscle tissue was digitally erased so that only the bone and surrounding periosteum were analyzed. Using image analysis software (Image J, NIH) a binary image was created using a threshold value midway between background (white) and perfused vessels (black). The number and size of all black objects (perfused vessels) greater than 10 pixels in size were determined using the particle analysis function of Image J. From these data we determined vessel number (V.N), average vessel area (V.Ar.Avg), and total vessel area (V.Ar.Tot). The repeatability of the method was assessed by analyzing ten sections three times each, and computing the average value of the range of the three repeats. Expressed as a percent of the mean value, the repeatability was 7.5, 5.4 and 10.2% for V.N, V.Ar.Avg and V.Ar.Tot. Toluidine blue-stained images were used for quantitative assessment of bone area by a single operator (J.L.) (ImageJ).
Data Analysis
Repeated measures analysis of variance (ANOVA) was used to assess the effects of longitudinal location (repeated factor; P4, P2, M, D2, D4), fatigue displacement level (30, 45, 65, 85%) and time (3, 7, 14 days) on vascular and bone outcomes. Two-way ANOVA with Fisher’s protected least significant differences post hoc tests were used to assess the effects of displacement level and time for individual locations. Significance was defined as p < 0.05. Simple and stepwise linear regression were used to investigate correlations between bone and vessel parameters. For control data, we computed mean values at each longitudinal location from 11 non-loaded, left specimens (Table 2). Analysis of these controls indicated a significant effect of location on average vessel area, total vessel area and bone area (p < 0.001). Interestingly, total vessel area and bone area were inversely related in these control samples: total vessel area increased by 90% from proximal to distal, whereas bone area decreased by 23%. To account for these normal anatomical gradients, for each section from a loaded bone we computed the percent change in loaded versus control (100*[Loaded-Control]/Control), using the mean value from the control group at the corresponding longitudinal location; results are reported in terms of these relative values.
Table 2.
Control values of vascular and bone parameters from left ulnae at each of five longitudinal locations (mean ± SD; n=11)
| P4 | P2 | M | D2 | D4 | |
|---|---|---|---|---|---|
| Vessel Number (V.N) | 104.7 a ± 22.9 | 120.3 ± 29.7 | 125.5 b ± 32.1 | 116.1 ± 19.2 | 118.1 ± 15.8 |
| Average Vessel Area (V.Ar.Avg) (μm2) | 69.3 a ± 10.2 | 66.1 a ± 13.2 | 84.6 b ± 26.8 | 87.8 b ± 21.3 | 115.8 c ± 25.4 |
| Total Vessel Area (V.Ar.Tot) (μm2) | 7205 a ± 1588 | 7950 a ± 2619 | 10,765 b ± 4826 | 10,472 b ± 3796 | 13,553 c ± 2995 |
| Bone Area (B.Ar) (mm2) | 1.67 a ± 0.14 | 1.57 b ± 0.07 | 1.48 c ± 0.09 | 1.35 d ± 0.09 | 1.28 e ± 0.11 |
P4: 4 mm proximal to the midpoint; P2: 2 mm proximal to the midpoint; M: midpoint; D2: 2 mm distal to the midpoint; D4: 4 mm distal to the midpoint.
Locations with different letters are significantly different, p < 0.05
Results
Fatigue loading stimulated dramatic increases in periosteal vascularity and bone area (Fig. 2). Three days after loading, there was an expansion of the sub-periosteal layer at all displacement levels, with numerous plump, cuboidal cells between the vessels (Fig. 2a–b). There was minimal deposition of new bone matrix to the outside of the original bone surface at this time. In samples from the lower displacement groups the periosteum itself was also expanded and contained numerous vessels, of both small and large diameter, with no evidence of inflammatory infiltrate. In samples from the higher displacement groups there was a large expansion of the periosteum, which contained blood vessels and fibroblasts, as well as inflammatory cells (neutrophils, mononuclear cells). By seven days after loading, specimens from all displacement levels showed a large increase in bone matrix (Fig. 2c–d). This new woven bone, unlike the preexisting lamellar bone, contained many spaces with small blood vessels and osteoblasts. Also at 7 days, the periosteum continued to be highly vascular but the inflammatory infiltrate seen in high displacement groups at day 3 had largely resolved, and the periosteum was relatively thin in all displacement groups. At day 14, the new bone retained its vascularity, with many spaces that were lined with osteoblasts and contained small vessels (Fig. 2e–f).
Figure 2.

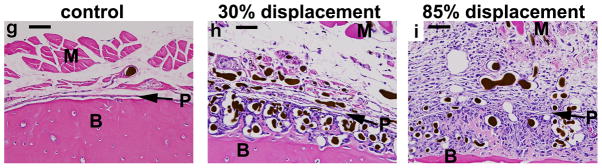
Photomicrographs of transverse histological sections from six loaded (right) and one control (left) ulnae taken 2 mm distal to the midpoint (D2) (orientation same as in Figure 1). (a–f) Low power images of representative samples from the lowest (30%) and highest (85%) displacement groups 3, 7 and 14 days after fatigue loading (10X objective; scale bar = 200 μm). (g–i) Higher power images of ulnae on day 3 (40X objective; scale bar = 50 μm). Loading caused a dramatic expansion of the periosteal and sub-periosteal tissue layers by day 3 for all displacement groups, with greater expansion observed in the higher displacement groups; note that the muscle [M] has been displaced away from the bone [B] in the loaded ulnae compared to control. The number and size of periosteal vessels were greatly increased in loaded ulnae. On day 3, a clear demarcation is seen at higher power (h,i) between the sub-periosteal layer (tissue between the original bone and the periosteal margin [P]) and the periosteal layer (which we define as the tissue between the periosteal margin and the muscle). The sub-periosteal layer is filled with numerous plump cuboidal cells surrounding the blood vessels, and small buds of newly formed bone (pink) are seen; the periosteal layer has a looser, fibrovascular appearance. By day 7, the sub-periosteal layer has transformed to woven bone and the periosteal layer is reduced in size. Isolated regions of chondroid bone (d, *) were observed in the 85% displacement group at this timepoint. By day 14, the woven bone layer has consolidated and the periosteal layer is further reduced. On days 7 and 14, the major site of new vessels is in channels in the woven bone, whereas at day 3 the new vessels are not yet enveloped in bone. (stained with hematoxylin and eosin)
The histological observations of increased vascularity were supported by quantitative analysis. Vessel number and total vessel area were significantly greater in loaded versus control ulnae at each timepoint in all four displacement groups (p < 0.05). Average vessel area was likewise increased in all experimental groups, with the exception of the lowest displacement group (30%) on day 14. Bone area was not significantly increased at day 3 in any of the displacement groups, but was increased at days 7 and 14. Thus, the increase in vascularity preceded the increase in bone size.
Increases in vessel number, average vessel area, total vessel area and bone area varied significantly with longitudinal location (p < 0.001; Fig. 3). The distribution of new vessels and new bone was consistent across time and displacement groups, with the greatest changes observed 2 mm distal to the midpoint (section D2) and the least changes 4 mm proximal to the midpoint (P4). Within the cross-section, we consistently observed the greatest vascular and bony changes on the medial aspect of the ulna.
Figure 3.

Increases in vessel parameters and bone area depended significantly on longitudinal location. Values represent the overall mean (± SD) from all 12 loaded groups (N = 67–70) and are representative of the pattern seen in each of the groups. With the exception of bone area at P4, significant increases were observed over the entire 8 mm region of the central ulna (P4 to D4). Vessel number, total vessel area and bone area each increased in a similar pattern, with peaks occurring at section D2. Average vessel area increased in a slightly different pattern, with a broad peak from P2 to D2. (Section locations defined in Figure 1.)
Vascular changes depended significantly on the level of applied fatigue displacement (p < 0.005 for all parameters) with a general finding of greater increases in vascularity with increasing displacement. We focused on changes at the site of maximal response (section D2). On day 3, vessel number and total vessel area in loaded ulnae at D2 did not differ significantly between displacement levels, whereas the average vessel area was greater in the 65 and 85% groups compared to the 30% displacement group (Fig. 4). In contrast, on days 7 and 14 vessel number and total vessel area were greater in the 65 and 85% groups compared to the 30% group, whereas average vessel area was not different between displacement groups. At days 7 and 14 bone area in loaded ulnae was also increased significantly with increasing fatigue displacement.
Figure 4.

Increases in vessel parameters and bone area depended significantly on fatigue displacement. Values are mean (± SD) percent increases in the loaded ulnae versus the control group at section D2. Note the large magnitude of the vascular and osseous response, with mean peak increases of approximately 275% in vessel number, 110% in average vessel area, 500% in total vessel area, and 100% in bone area.
a: different from 30% group at same time (p < 0.05); b: different from 45% group at same time (p < 0.05); c: different from 65% group at same time (p < 0.05)
Vascular changes in loaded ulnae also depended on time, although not in a consistent manner for all parameters. At section D2, based on the two-way ANOVA (which accounts for the four displacement groups) vessel number increased from 3 to 7 days (p = 0.004) but did not change from 7 to 14 days (p = 0.15). Average vessel area was greatest on day 3, and decreased from 3 to 7 days (p < 0.001) with no changes between 7 and 14 days (p = 0.97). Total vessel area was increased at all timepoints but did not depend on time (p = 0.39). Thus, the increase in vessel number after day 3 was offset by a decrease in average vessel area, resulting in no significant change in total vessel area. Bone area increased from 3 to 7 days (p < 0.001) but did not change from 7 to 14 days (p = 0.74).
Stepwise linear regression analysis indicated that changes in vessel number and average vessel area both contributed to changes in total vessel area. Total vessel area was strongly correlated with vessel number (r2 = 0.75, p < 0.001), and the addition of average vessel area to the regression model significantly improved the correlation (r2 = 0.95, p < 0.001). Consistent with this finding, vessel number and average vessel area were not significantly correlated with each other (p = 0.09). Overall, correlations between bone area and vessel parameters were modest at best (vessel number: r2 = 0.39, p < 0.001; average vessel area: p = 0.53; total vessel area: r2 = 0.22, p < 0.001). We attribute this to the temporal differences between the vascular and bony changes.
Discussion
Our objective was to characterize the vascular changes that occur in response to fatigue loading of the rat forelimb. In support of our first hypothesis, we observed dramatic increases in periosteal vascularity in the central region of the ulna 3–14 days after loading. Highly significant increases in vessel size and number were observed on day 3, whereas significant increases in bone area were not detected until 7 days after loading. Significant vascular increases compared to control were observed along the entire 8 mm region of interest, although the increases were consistently greatest on the medial surface at the cross-section located 2 mm distal to the ulnar midpoint. This finding supports our second hypothesis that fatigue-induced increases in ulnar vascularity occur in a spatially similar pattern to increases in bone formation. In support of our third hypothesis, we observed that increases in vascularity were generally greater in ulnae that were subjected to greater levels of applied fatigue displacement.
The angiogenic response to dynamic skeletal loading has not been well characterized. Yao et al. [16] used a treadmill running model in growing rats and demonstrated increased vessel number in the trabecular bone of the proximal tibia as an early (2 week) adaptation to loading that preceded increases in bone volume. Both the increases in vessel number and trabecular bone volume were blocked by delivery of an antibody to vascular endothelial growth factor (VEGF). That study appears to be the first one showing that angiogenesis is critical to exercise-induced osteogenesis. Recently, Muir et al. used a similar loading method as we used and reported increased bone blood flow in the first 5 days following fatigue loading [17]. Our study indicates that these changes in blood flow after fatigue loading are associated with increased periosteal vascularity, and extends the results of the previous studies by quantifying the temporospatial changes in vascularity following loading to several levels of fatigue displacement.
Our data indicate that there were two independent changes that contributed to increased vascularity after fatigue loading – increased vessel size and number. At day 3, increases in average vessel area and in the number of vessels contributed approximately equally to the increase in total vessel area. At 7 and 14 days, the increases in total vessel area were due mostly to increased vessel number. Interestingly, as the average vessel size decreased from 3 to 7 days, vessel number increased and there was no net change in total vessel area.
The rat forelimb loading model is useful for examining the spatial relationships between angiogenesis and osteogenesis because a characteristic gradient of bone formation is observed both within the cross-section and along the length [25, 27–29]. Our results clearly indicate that the localized pattern of loading-induced bone formation corresponds to an identical pattern of increased vascularity (Fig. 3). The spatial pattern of vascular increase is established by day 3, prior to the accrual of significant woven bone. It has been noted that the vasculature provides a spatial template for bone formation in the developing skeleton [1, 2] and in distraction osteogenesis [7, 8, 10, 33]. We did not determine if individual vessels served as the templates for local bone formation after fatigue loading, although each marrow-like space within the woven bone contained at least one blood vessel and the “endosteal” surface of these spaces were lined with osteoblasts. Thus, our overall quantitative findings and our localized observations are consistent with the notion that the vessels provide a template for woven bone formation that occurs in response to fatigue loading.
Further evidence of the tight association between angiogenesis and osteogenesis in our loading model is that changes in both vascularity and bone size depended on the level of applied fatigue displacement. This finding is consistent with our recent report of a displacement-dependent increase in fluoride uptake within hours after fatigue loading in the same loading model [22]. We now attribute the elevated fluoride uptake in the first 4 days to increased blood flow, due in part to increased vascularity, a conclusion consistent with the findings of Muir et al. [17]. However, we do not know what the mechanical stimulus is for the displacement-dependent response we observed. Our fatigue loading protocol produces bone damage as well as dynamic strains that increase as a function of applied fatigue displacement [31]. Additional studies are needed to determine the relative contributions of these factors to the combined angiogenic-osteogenic response.
The process of bone formation we observed is largely independent of cartilage formation and thus bears some similarity to what occurs in distraction osteogenesis. Bone formation during distraction osteogenesis is predominantly intramembranous, with fibrous tissue being replaced directly by bone [8–10, 33]. Histologically, bone formation in distraction osteogenesis proceeds as mesenchymal fibroblasts in the gap proliferate and deposit a collagen fiber matrix that is invaded by vascular channels; these vessels in turn appear to provide the appropriate local environment for osteoblastic differentiation and bone formation [7, 10, 34]. Our histological observations support a similar sequence of events in the formation of periosteal bone after fatigue loading, although without the deposition of a provisional fibrous matrix. A quantitative angiogenesis-osteogenesis link in distraction osteogenesis is suggested by reports that the rate of distraction (1 mm/day) that leads to the maximum angiogenic response [9] also leads to the optimal bone formation response [35]. These findings taken together with our results support the concept that the magnitude of the angiogenic response is regulated by the same factors that regulate the magnitude of the osteogenic response, i.e., that the formation of blood vessels and new bone represents a coordinated effort driven by the requirement for a certain amount of bone formation in response to a mechanical stimulus. Alternatively, the magnitude of the angiogenic response may control the magnitude of the osteogenic response. Additional experiments using angiogenic inhibitors will be required to better determine the cause-effect relationship between angiogenesis and osteogenesis after mechanical loading.
In some samples from the highest displacement group (85%) we observed isolated regions of chondral-appearing cells and tissue on day 7 (Fig. 2d). Interestingly, in this displacement group the vessel number and total vessel area on day 3 tended to be less than in some of the lower displacement groups (Fig. 4), suggesting that the process of angiogenesis in the highest damage group was delayed compared to groups with lesser damage. The presence of chondral tissue is consistent with such a delay, as there may have been regions within the sub-periosteal layer that were not adequately vascularized to support bone formation. These regions may be examples of “chondroid bone formation”, a process that is neither purely intramembranous nor endochondral [36, 37]. Nonetheless, these regions were few, and the overwhelming histological appearance is consistent with a process of non-endochondral bone formation.
One limitation of our method is that the perfusion media (silicone rubber) was not present in all vessels that were observed on histological sections, and in some vessels where media was present it was smaller in size than the vessel dimensions. We did not determine if the absence of media represented incomplete perfusion or whether the media was displaced from the vessels during processing. Regardless, it is likely that we underestimated the actual number of vessels and their area. Importantly, these artifacts were noted in samples from each of the experimental groups and did not appear related to vessel size as there were many fine vessels in the muscle layer that were fully perfused. Because all specimens were subjected to the same processing, we assume that the underestimation of vessels affected all groups equally and that the relative differences between groups are valid. During preliminary studies, we evaluated the use of microcomputed tomography as an alternative to histology for visualizing and quantifying vascularity, as described by others [38]. Using a desktop microCT scanner (Scanco μCT 40) at 16 μm resolution we were able to resolve large caliber vessels and a general pattern of increased vascularity in loaded ulnae, but could not adequately resolve individual vessels on the order of < 30μm that were the majority of the periosteal vessels of interest in this experiment.
In summary, we have quantified for the first time the temporospatial pattern of vascular changes following bone fatigue loading. Significant increases in vessel size and number occurred in the periosteum of loaded ulnae by day 3, prior to significant increases in bone area. Spatially, the pattern of increased vascularity matched the pattern of bone formation; the greatest vascular and bony responses were observed on the medial surface, 2 mm distal to the midshaft. Increases in vascularity were generally greater in ulnae that were subjected to higher levels of fatigue displacement. We conclude that skeletal fatigue loading induces a rapid increase in periosteal vascularity, followed by an increase in bone area. The angiogenic-osteogenic response is spatially coordinated and scaled to the level of the mechanical stimulus.
Acknowledgments
The authors thank Pat Keller and Crystal Idleburg for histological sectioning and staining. Funding was provided by a grant from the U.S. National Institutes of Health/National Institute of Arthritis and Musculoskeletal and Skin Diseases (AR050211).
References
- 1.Brandi ML, Collin-Osdoby P. Vascular biology and the skeleton. J Bone Miner Res. 2006;21:183–192. doi: 10.1359/JBMR.050917. [DOI] [PubMed] [Google Scholar]
- 2.Pechak DG, Kujawa MJ, Caplan AI. Morphological and histochemical events during first bone formation in embryonic chick limbs. Bone. 1986;7:441–458. doi: 10.1016/8756-3282(86)90004-9. [DOI] [PubMed] [Google Scholar]
- 3.Ferrara N. Role of vascular endothelial growth factor in regulation of physiological angiogenesis. American Journal of Physiology - Cell Physiology. 2001;280:C1358–1366. doi: 10.1152/ajpcell.2001.280.6.C1358. [DOI] [PubMed] [Google Scholar]
- 4.Gerber HP, Vu TH, Ryan AM, Kowalski J, Werb Z, Ferrara N. VEGF couples hypertrophic cartilage remodeling, ossification and angiogenesis during endochondral bone formation. Nature Medicine. 1999;5:623–628. doi: 10.1038/9467. [DOI] [PubMed] [Google Scholar]
- 5.Glowacki J. Angiogenesis in fracture repair. Clin Orthop Rel Res. 1998;355S:S82–S89. doi: 10.1097/00003086-199810001-00010. [DOI] [PubMed] [Google Scholar]
- 6.Hausman MR, Schaffler MB, Majeska RJ. Prevention of fracture healing in rats by an inhibitor of angiogenesis. Bone. 2001;29:560–564. doi: 10.1016/s8756-3282(01)00608-1. [DOI] [PubMed] [Google Scholar]
- 7.Ilizarov GA. Clinical application of the tension-stress effect for limb lengthening. Clin Orthop Relat Res. 1990:8–26. [PubMed] [Google Scholar]
- 8.Jazrawi LM, Majeska RJ, Klein ML, Kagel E, Stromberg L, Einhorn TA. Bone and cartilage formation in an experimental model of distraction osteogenesis. J Orthop Trauma. 1998;12:111–116. doi: 10.1097/00005131-199802000-00008. [DOI] [PubMed] [Google Scholar]
- 9.Li G, Simpson AH, Kenwright J, Triffitt JT. Effect of lengthening rate on angiogenesis during distraction osteogenesis. J Orthop Res. 1999;17:362–367. doi: 10.1002/jor.1100170310. [DOI] [PubMed] [Google Scholar]
- 10.Choi IH, Chung CY, Cho TJ, Yoo WJ. Angiogenesis and mineralization during distraction osteogenesis. J Korean Med Sci. 2002;17:435–447. doi: 10.3346/jkms.2002.17.4.435. [DOI] [PMC free article] [PubMed] [Google Scholar]
- 11.Fang TD, Salim A, Xia W, Nacamuli RP, Guccione S, Song HM, Carano RA, Filvaroff EH, Bednarski MD, Giaccia AJ, Longaker MT. Angiogenesis is required for successful bone induction during distraction osteogenesis. J Bone Miner Res. 2005;20:1114–1124. doi: 10.1359/JBMR.050301. [DOI] [PubMed] [Google Scholar]
- 12.Street J, Bao M, deGuzman L, Bunting S, Peale FV, Jr, Ferrara N, Steinmetz H, Hoeffel J, Cleland JL, Daugherty A, van Bruggen N, Redmond HP, Carano RA, Filvaroff EH. Vascular endothelial growth factor stimulates bone repair by promoting angiogenesis and bone turnover. Proceedings of the National Academy of Sciences of the United States of America. 2002;99:9656–9661. [Google Scholar]
- 13.Forwood MR, Turner CH. Skeletal adaptations to mechanical usage: results from tibial loading studies in rats. Bone. 1995;17:197S–205S. doi: 10.1016/8756-3282(95)00292-l. [DOI] [PubMed] [Google Scholar]
- 14.Rubin CT, Lanyon LE. Regulation of bone formation by applied dynamic loads. J Bone Jt Surg [Am] 1984;66:397–402. [PubMed] [Google Scholar]
- 15.Barou O, Mekraldi L, Vico G, Boivin G, Alexandre C, Lafage-Proust MH. Relationships between trabecular bone remodeling and bone vascularization: a quantitative study. Bone. 2002;30:604–612. doi: 10.1016/s8756-3282(02)00677-4. [DOI] [PubMed] [Google Scholar]
- 16.Yao Z, Lafage-Proust MH, Plouet J, Bloomfield S, Alexandre C, Vico L. Increase of both angiogenesis and bone mass in response to exercise depends on VEGF. J Bone Miner Res. 2004;19:1471–1480. doi: 10.1359/JBMR.040517. [DOI] [PubMed] [Google Scholar]
- 17.Muir P, Sample SJ, Barrett JG, McCarthy J, Vanderby R, Jr, Markel MD, Prokuski LJ, Kalscheur VL. Effect of fatigue loading and associated matrix microdamage on bone blood flow and interstitial fluid flow. Bone. 2007 doi: 10.1016/j.bone.2006.11.012. [DOI] [PubMed] [Google Scholar]
- 18.Torrance AG, Mosley JR, Suswillo RFL, Lanyon LE. Noninvasive loading of the rat ulna in vivo induces a strain-related modeling response uncomplicated by trauma or periosteal pressure. Calcified Tissue International. 1994;54:241–247. doi: 10.1007/BF00301686. [DOI] [PubMed] [Google Scholar]
- 19.Hsieh YF, Silva MJ. In vivo fatigue loading of the rat ulna induces both bone formation and resorption and leads to time-related changes in bone mechanical properties and density. Journal of Orthopaedic Research. 2002;20:764–771. doi: 10.1016/S0736-0266(01)00161-9. [DOI] [PubMed] [Google Scholar]
- 20.Tami AE, Nasser P, Schaffler MB, Knothe Tate ML. Noninvasive fatigue fracture model of the rat ulna. J Orthop Res. 2003;21:1018–1024. doi: 10.1016/S0736-0266(03)00099-8. [DOI] [PubMed] [Google Scholar]
- 21.Li J, Miller MA, Hutchins GD, Burr DB. Imaging bone microdamage in vivo with positron emission tomography. Bone. 2005;37:819–824. doi: 10.1016/j.bone.2005.06.022. [DOI] [PubMed] [Google Scholar]
- 22.Silva MJ, Uthgenannt BA, Rutlin JR, Wohl GR, Lewis JS, Welch MJ. In vivo skeletal imaging of 18F-fluoride with positron emission tomography reveals damage- and time-dependent responses to fatigue loading in the rat ulna. Bone. 2006;39:229–236. doi: 10.1016/j.bone.2006.01.149. [DOI] [PubMed] [Google Scholar]
- 23.Blau M, Ganatra R, Bender MA. 18 F-fluoride for bone imaging. Semin Nucl Med. 1972;2:31–37. doi: 10.1016/s0001-2998(72)80005-9. [DOI] [PubMed] [Google Scholar]
- 24.Genant HK, Bautovich GJ, Singh M, Lathrop KA, Harper PV. Bone-seeking radionuclides: an in vivo study of factors affecting skeletal uptake. Radiology. 1974;113:373–382. doi: 10.1148/113.2.373. [DOI] [PubMed] [Google Scholar]
- 25.Mosley JR, March BM, Lynch J, Lanyon LE. Strain magnitude related changes in whole bone architecture in growing rats. Bone. 1997;20:191–198. doi: 10.1016/s8756-3282(96)00385-7. [DOI] [PubMed] [Google Scholar]
- 26.Hsieh YF, Wang T, Turner CH. Viscoelastic response of the rat loading model: implications for studies of strain-adaptive bone formation. Bone. 1999;25:379–382. doi: 10.1016/s8756-3282(99)00181-7. [DOI] [PubMed] [Google Scholar]
- 27.Kotha SP, Hsieh Y-F, Strigel RM, Muller R, Silva MJ. Experimental and finite element analysis of the rat ulnar loading model - correlations between strain and bone formation following fatigue loading. Journal of Biomechanics. 2004;37:541–548. doi: 10.1016/j.jbiomech.2003.08.009. [DOI] [PubMed] [Google Scholar]
- 28.Hsieh Y-F, Robling AG, Ambrosius WT, Burr DB, Turner CH. Mechanical loading of diaphyseal bone in vivo: the strain threshold for an osteogenic response varies with location. Journal of Bone Mineral Research. 2001;16:2291–2297. doi: 10.1359/jbmr.2001.16.12.2291. [DOI] [PubMed] [Google Scholar]
- 29.Mosley JR, Lanyon LE. Strain rate as a controlling influence on adaptive modeling in response to dynamic loading of the ulna in growing male rats. Bone. 1998;23:313–318. doi: 10.1016/s8756-3282(98)00113-6. [DOI] [PubMed] [Google Scholar]
- 30.Danova NA, Colopy SA, Radtke CL, Kalscheur VL, Markel MD, Vanderby R, McCabe RP, Escarcega AJ, Muir P. Degradation of bone structural properties by accumulation and coalescence of microcracks. Bone. 2003;33:197–205. doi: 10.1016/s8756-3282(03)00155-8. [DOI] [PubMed] [Google Scholar]
- 31.Uthgenannt BA, Silva MJ. Use of the rat forelimb compression model to create discrete levels of bone damage in vivo. J Biomech. 2007;40:317–324. doi: 10.1016/j.jbiomech.2006.01.005. [DOI] [PubMed] [Google Scholar]
- 32.Bentolila V, Boyce TM, Fyhrie DP, Drumb R, Skerry TM, Schaffler MB. Intracortical remodeling in adult rat long bones after fatigue loading. Bone. 1998;23:275–281. doi: 10.1016/s8756-3282(98)00104-5. [DOI] [PubMed] [Google Scholar]
- 33.Pacicca DM, Patel N, Lee C, Salisbury K, Lehmann W, Carvalho R, Gerstenfeld LC, Einhorn TA. Expression of angiogenic factors during distraction osteogenesis. Bone. 2003;33:889–898. doi: 10.1016/j.bone.2003.06.002. [DOI] [PubMed] [Google Scholar]
- 34.Aronson J, Harrison BH, Stewart CL, Harp JH., Jr The histology of distraction osteogenesis using different external fixators. Clin Orthop Relat Res. 1989:106–116. [PubMed] [Google Scholar]
- 35.Ilizarov GA. The tension-stress effect on the genesis and growth of tissues: Part II. The influence of the rate and frequency of distraction. Clin Orthop Relat Res. 1989:263–285. [PubMed] [Google Scholar]
- 36.Aronson J, Shen XC, Skinner RA, Hogue WR, Badger TM, Lumpkin CK., Jr Rat model of distraction osteogenesis. J Orthop Res. 1997;15:221–226. doi: 10.1002/jor.1100150210. [DOI] [PubMed] [Google Scholar]
- 37.Yasui N, Sato M, Ochi T, Kimura T, Kawahata H, Kitamura Y, Nomura S. Three modes of ossification during distraction osteogenesis in the rat. J Bone Joint Surg Br. 1997;79:824–830. doi: 10.1302/0301-620x.79b5.7423. [DOI] [PubMed] [Google Scholar]
- 38.Guldberg RE, Ballock RT, Boyan BD, Duvall CL, Lin AS, Nagaraja S, Oest M, Phillips J, Porter BD, Robertson G, Taylor WR. Analyzing bone, blood vessels, and biomaterials with microcomputed tomography. IEEE Eng Med Biol Mag. 2003;22:77–83. doi: 10.1109/memb.2003.1256276. [DOI] [PubMed] [Google Scholar]