

Abstract
We compared the contractile performance of papillary muscle from a mouse model of hypertrophic cardiomyopathy [α-cardiac actin (ACTC) E99K mutation] with nontransgenic (non-TG) littermates. In isometric twitches, ACTC E99K papillary muscle produced three to four times greater force than non-TG muscle under the same conditions independent of stimulation frequency and temperature, whereas maximum isometric force in myofibrils from these muscles was not significantly different. ACTC E99K muscle relaxed slower than non-TG muscle in both papillary muscle (1.4×) and myofibrils (1.7×), whereas the rate of force development after stimulation was the same as non-TG muscle for both electrical stimulation in intact muscle and after a Ca2+ jump in myofibrils. The EC50 for Ca2+ activation of force in myofibrils was 0.39 ± 0.33 μmol/l in ACTC E99K myofibrils and 0.80 ± 0.11 μmol/l in non-TG myofibrils. There were no significant differences in the amplitude and time course of the Ca2+ transient in myocytes from ACTC E99K and non-TG mice. We conclude that hypercontractility is caused by higher myofibrillar Ca2+ sensitivity in ACTC E99K muscles. Measurement of the energy (work + heat) released in actively cycling heart muscle showed that for both genotypes, the amount of energy turnover increased with work done but with decreasing efficiency as energy turnover increased. Thus, ACTC E99K mouse heart muscle produced on average 3.3-fold more work than non-TG muscle, and the cost in terms of energy turnover was disproportionately higher than in non-TG muscles. Efficiency for ACTC E99K muscle was in the range of 11–16% and for non-TG muscle was 15–18%.
Keywords: energy metabolism, hypertrophic cardiomyopathy, efficiency, calcium cycling/excitation-contraction coupling, animal models of human disease
hypertrophic cardiomyopathy (HCM) is the most common monogenic inherited cardiomyopathy; its incidence is believed to be as high as 0.2% of the population. It is characterized by hypertrophy of the muscle of the heart, especially the interventricular septum, and impaired relaxation in diastole. At the cellular level, HCM is characterized by myocyte disarray and interstitial fibrosis (10, 22, 33). It is noteworthy that the vast majority of mutations associated with the HCM phenotype are in cardiac-specific isoforms of contractile proteins (23, 30, 45–48). Initially, the heart muscle of HCM mutation carriers and HCM animal models is functionally hypercontractile, but secondary progression toward heart failure and an enhanced possibility of arrhythmias are commonly observed; in fact, HCM is a leading cause of sudden cardiac death in young adults.
Many studies have addressed the question of how HCM-causing mutations affect contractility and subsequently cause hypertrophy. It is evident from animal studies that contractile abnormality is a primary effect of the mutation and that hypertrophy and fibrosis develop subsequently (27, 41). At the myofilament level, the likely primary effect of HCM mutations is an increase in Ca2+ sensitivity, which can also be associated with faster cross-bridge cycling and impaired relaxation (23, 29, 33, 42).
Thus, HCM may be triggered by a gain of contractile function that cannot be compensated for by a corresponding reduction in the intracellular Ca2+ transient (12).
While enhanced Ca2+ sensitivity may account for the hypercontractility and diastolic dysfunction caused by HCM mutations, the mechanism by which increased myofibrillar Ca2+ sensitivity leads to muscle growth and ultimately pathological hypertrophy is not understood. The hypotheses that have been proposed have focused on deranged Ca2+ handling leading to activation of hypertrophic signaling pathways (17) and on energy depletion, although these are not mutually exclusive mechanisms. Ashrafian et al. (2) proposed that HCM causes an energy compromise in the myocyte because the abnormal contractility of HCM muscle is less efficient in converting the energy of ATP hydrolysis into mechanical work in the heart. There are currently two lines of indirect evidence for this hypothesis. First, phenocopies of HCM, such as glycogen storage disease and mitochondrial disease, are associated with derangements of the supply of ATP, thus linking energy status and hypertrophy. Second, levels of ATP and phosphocreatine (PCr) are decreased, whereas ADP and Pi are increased, in mouse models of HCM, in patients with overt HCM, and even in HCM mutation carriers that do not have symptoms of hypertrophy (7, 16). Such observations are compatible with reduced efficiency of conversion of the energy from ATP hydrolysis to work by the contractile apparatus in HCM, but this has not been tested directly.
We have used myothermic techniques for observing efficiency directly by measuring work output and heat output, measured as a rise in muscle temperature, in working muscle. Myothermic methods have a long history of use in cardiac physiology, either using a thermopile or flow microcalorimeter to measure heat production. Thermopiles for use with cardiac muscle have been developed in the laboratories of N. Alpert (26), C. Gibbs (13, 14), and C. Barclay (49). Flow microcalorimeters for cardiac muscle have been developed by J. Daut and Elzinga (9) and, most recently, by D. Loiselle and colleagues (39). Our experiments were based on the thermopile methodology recently adapted by Barclay and Widen (49) to measure heat output by papillary muscle of mouse heart. We have also developed a transgenic mouse model of HCM with the α-cardiac actin (ACTC) E99K mutation that has been demonstrated to reproduce many of the characteristics of HCM in the human heart, including enhanced myofibrillar Ca2+ sensitivity, myocyte disarray, fibrosis, atrial enlargement and ventricular wall thickening, arrhythmia, and a high probability of sudden cardiac death and progression to a heart failure phenotype (36).
In this study, we report that myofibrils isolated from the hearts of ACTC E99K transgenic (TG) mice have enhanced Ca2+ sensitivity of force. We also measured work and heat output by papillary muscles from ACTC E99K mice and from their non-TG littermates, allowing a direct comparison of the efficiency of contraction. These measurements show that the papillary muscle of the ACTC E99K HCM mouse is hypercontractile and that hypercontractility is associated with lower efficiency.
METHODS
Experiments and animal handling were done in accordance with College guidelines. Mice were euthanized by cervical dislocation as required by Schedule I of the United Kingdom Animals (Scientific Procedures) Act 1986.
Intact Muscle
We used muscles from ACTC E99K transgenic mice (36) and control non-TG littermates. The heart was quickly removed and rinsed in standard saline solution plus 30 mmol/l 2,3-butanedione 2-monoxime (BDM) to remove blood. The standard saline solution contained (in mmol/l) 118 NaCl, 4.75 KCl, 1.18 KH2PO4, 1.18 MgSO4, 24.8 NaHCO3, 2.5 CaCl2, and 10 glucose and was equilibrated with 95% O2-5% CO2. The ventricle was opened and pinned to a Sylgard-lined petri dish on a cooled microscope stage. Dissection was done in BDM-containing saline solution. Platinum foil clips were attached to the ends of the preparation.
The muscle was transferred to a bath, where one end was attached to a force transducer (type AE-801, Kronex, Oakland, CA) and the other end to a hook. Platinum plate stimulating electrodes were positioned along the length of the bath close to the muscle. Standard saline solution (without BDM) flowed continuously through the bath at 27°C. Muscle length was adjusted to give a passive force of ∼5 kPa. After 1 h, the muscle was stimulated, and voltage was adjusted to supramaximal strength at a constant pulse duration of 0.5 ms. The muscle was stimulated at 0.2 Hz for a 10 min run-in period.
Experiments on force, work, and heat were done on whole papillary muscle stimulated at 2 Hz for 20 s at 27°C using ACTC E99K mice (n = 13) and non-TG littermates (n = 12); characteristics of these groups are shown in Table 1. For heat measurements, the muscle was transferred to a horizontal thermopile with one end of the muscle attached to a force transducer (model 400A, Aurora Scientific, Aurora, ON, Canada) and the other end to a servo-motor (model 300B, Aurora Scientific). Attachment was via platinum hooks through which stimuli were applied. The thermopile consisted of constantan-chromel thermocouples at a spacing of four per mm; the output of each 1-mm section was recorded separately. A thermopile is a set of thermocouples connected in series, where the thermocouples operate on the same principles as the thermocouple in a digital thermometer. In our experiments, the thermopile detects the very small temperature change caused by the heat produced by the papillary muscle, typically 0.005°C during the 20-s twitch protocol used here. Stimulus voltage was adjusted to supramaximal strength at a constant pulse duration of 0.5 ms, and muscle length was adjusted to that giving the maximum force during an isometric twitch. A digital photo of the preparation on the thermopile was taken and used to measure the distance between the clips (referred to as L0) and to identify the thermopile sections under muscle. The time constant for heat loss was evaluated by the Peltier method (20) before each set of recordings.
Table 1.
Characteristics of ACTC E99K and non-TG mice and papillary muscles
| ACTC E99K | Non-TG | P Value | |
|---|---|---|---|
| Sex ratio (male:female) | 11:2 | 10:2 | |
| Age, days | 76.2 ± 3.1 | 81.2 ± 3.7 | 0.321 |
| Muscle blotted mass, mg | 1.29 ± 0.134 | 1.71 ± 0.149 | 0.048 |
| Muscle CSA, mm2 | 0.482 ± 0.044 | 0.625 ± 0.049 | 0.040 |
| Muscle radius, mm | 0.386 ± 0.018 | 0.442 ± 0.018 | 0.041 |
Values are means ± SE; n = 13 α-cardiac actin (ACTC) E99K and 12 nontransgenic (non-TG) mice and muscles. Muscle radius was calculated from the cross-sectional area (CSA) assuming a circular cross section.
The standard protocol for heat experiments was similar to that used in Ref. 49. Each “test” consisted of a 0.375-s baseline period, 20 s with stimuli at 2 Hz (40 twitches), and 60 s without stimuli. In the test protocol, stimuli were either applied under isometric conditions or with shortening and lengthening to mimic the cardiac cycle. Each movement cycle consisted of shortening by 0.1 L0 starting 0.06 s after the stimulus, a hold at the short length, and stretch by 0.1 L0 to reach L0 at 0.5 s after the stimulus (see Fig. 4A). Four velocities of movement were tested. Each “control” included movement as in the test but without stimuli. In the usual experiment, the following records were made: isometric, the four velocities with and without stimulation, isometric, and a 10-min rinse of the muscle in fresh saline; this set of records was then repeated. Records of stimulus heat were made after the muscle had been made unexcitable with 30 mmol/l procaine in standard saline solution. At the end of the experiments, the muscle between the clips was removed, blotted, and quickly weighed on a Cahn electrobalance (model C-31, Orion Research, Boston, MA).
Fig. 4.

Papillary muscles from non-TG and ACTC E99K mice in work-producing cycles. A: example of one cycle during the working protocol for an intact papillary muscle. Top, imposed length change. Downward indicates shortening. Bottom, active force. The arrow at time 0 indicates the stimulus. Shaded areas mark periods of shortening and lengthening. B: work loop for the records shown in A. Active force was plotted versus length change. The arrow at length change = 0 indicates the point at which the stimulus occurred. The dashed arrows indicate the direction of the loop. Net work in the cycle is the area enclosed in the loop, 1.35 μJ in this example. C: summary of the work done by ACTC E99K (●) and non-TG (○) muscles during a series of 40 twitches at 2 Hz with movement at different velocities as shown. Work is the integral of the active force and length change expressed relative to muscle blotted weight. Values are means ± SE. n = 13 ACTC E99K muscles at each velocity, 12 non-TG muscles at velocities 0.5 and 2.0 L0/s, and 11 non-TG muscles at velocities of 0.67 and 1.0 L0/s. ANOVA indicated a highly significant difference between genotypes (F = 74.0, P < 0.001) but not among velocities (F = 1.08, P = 0.372). One overall work value for each genotype (▲ and △) was calculated using one value for each muscle (mean of all velocities for that muscle). The difference between genotypes was statistically significant (P ≤ 0.001). D: summary of the work during a series of 40 twitches (2-Hz stimulation) with shortening at 0.67 L0/s. Results for intact papillary muscles from ACTC E99K mice (n = 13, ●) and non-TG mice (n = 11 or 12, ○) are shown. Values are means ± SE. Work is expressed relative to that in the second twitch of the same series by the same muscle. For clarity, some values are not shown.
Active force was evaluated by subtracting the control records from test records. Work was evaluated as the integral of active force and length change. Heat produced by the muscle during active force production was evaluated by subtracting stimulus heat and the heat produced during the control protocol (movement of the unstimulated muscle) from the heat produced during test protocol. Passive stiffness (Δforce/Δlength) was evaluated from the force and length change during stretch in the control protocol.
The total heat produced during the 80-s protocol was separated into initial heat released during the contractions and recovery heat released during and after the end of the series of stimuli. The initial heat is produced by processes directly due to contraction, such as the cross-bridge cycle, ion fluxes, associated ATP hydrolysis, and creatine kinase reaction. The recovery heat is that due to resynthesis of ATP, mainly oxidative processes in mitochondria, and reversal of the creatine kinase reaction. All of the heat produced after the last twitch in the series is recovery heat. The recovery ratio [recovery heat/(initial heat + work)] was evaluated and used to compare ACTC E99K and non-TG muscles.
The method we used to separate initial and recovery heat was based on that described in Refs. 3 and 24. In brief, the division was based on the following assumptions: first, the rate of the recovery process is always proportional to the amount of recovery required. The constant of proportionality (τ) is a time constant, evaluated as described below. Second, each element of the initial process (i) requires a proportionate amount of the recovery process (r). The ratio of r to i (R = r/i) is constant during any one 80-s observation of activity and recovery. The value of R is not known a priori but is evaluated from the time course of the observed energy release. The analysis proceeded as follows, using records such as that shown in Fig. 5C. In step 1, the value of τ was determined by an exponential fit to the part of the record (60 s) after the end of stimulation, when all the energy produced is recovery heat. In step 2, the energy in each 0.05-s time section of the 20-s twitch series was divided into r and i components on the basis of an assumed R value. This allowed computation of the recovery heat still required at the end of the twitch series, which was compared with the recovery heat observed after that time. If the two quantities did not agree, step 2 was repeated with a new value of R. The iterations were repeated until agreement was reached. The recovery ratio was 1.65 for the example shown in Fig. 5C. We measured recovery heat for seven ACTA E99K muscles and four non-TG muscles; recovery heat from the other muscles could not be measured due to technical problems such as a low signal-to-noise ratio or baseline drift during 80 s of heat recording.
Fig. 5.

Mechanical output and energy turnover in isometric twitches and working cycles. A and B: mechanical output and energy turnover results for isometric twitches (A) and working twitches (B) of papillary muscles from ACTC E99K mice (n = 13, ●) and non-TG mice (n = 12, ○) during a series of 40 twitches at 2 Hz. In A, each symbol is the mean value for all the isometric series (usually 4) performed by the muscle. In B, each symbol is the mean value of the results for all velocities of shortening (usually 4) of the muscle. The solid lines are fits of the following equation to the data: y = (maximum × x)/(K + x). For isometric twitches, maximum = 453.8 μJ·s and K = 720 μJ (n = 25, r2 = 0.94); for working twitches, maximum = 152.3 μJ and K = 823 μJ (n = 25, r2 = 0.997). The dashed vertical line at 130 μJ shows the energy turnover from 1 ATP use per myosin per twitch in a 1.5 mg muscle (see text). Insets: energy output/energy turnover (efficiency) calculated from the solid line in A and B. C: example record of energy (heat + work) released during 20 s (shaded box) with stimulation at 2 Hz followed by 60 s without stimulation. Each stimulus was followed by shortening of 0.1 L0 at a velocity of 0.5 L0/s. OBS is heat + work as recorded during the experiment (gray line). The calculation described in the text divided the recorded energy into initial energy (ini) and recovery heat (rec). The line labeled ini + rec is the sum of initial and recovery components and is a good match to the recorded energy. For this record, the recovery ratio (recovery heat/initial energy) was 1.65. D: recovery ratio values for 7 ACTC E99K papillary muscles and 4 non-TG muscles. The horizontal lines indicate mean values. ACTC E99K: 1.6 ± 0.2, n = 7; non-TG: 2.0 ± 0.50, n = 4.
Taking account of muscle size.
Specific force (in kPa) was evaluated by expressing force relative to muscle cross-sectional area (CSA), as follows: CSA = w/(L0 × d), where w is the mass of the blotted muscle after removal of the tissue held within the clips, L0 is the distance between the clips measured on the digital photo of the muscle on the thermopile, and d is muscle density (assumed to be 1.0 mg/mm3). Muscle radius was calculated assuming a circular cross-section. Velocity is expressed relative to L0 (fractions of L0/s). Work and heat are expressed relative to muscle mass. Efficiency was evaluated from the relationship between energy output and total energy turnover during the 20-s twitch series. For this purpose, energy “per muscle” was used rather than energy per unit mass because regression coefficients for energy versus mass were low: for heat + work vs. mass, r2 = 0.031 and 0.168 for ACTC E99K and non-TG muscles, respectively, and for isometric force-time integral × L0 versus mass, r2 = 0.015 and 0.090 for ACTC E99K and non-TG muscles, respectively. It is important to note that, on average, ACTC E99K muscle mass was less than non-TG muscle (Table 1) and that the largest total energy turnover (heat + work production) was by muscles with midrange masses. Muscle mass did not appear to be a good estimate of the amount of energetically active material in the muscle, probably because the fraction of noncontractile mass varied among the muscles.
We simulated the time course of [O2] at the muscle center during the contraction series (49) and found that [O2] in our muscles was well above that at which mitochondrial respiration is impaired (31).
Statistics.
When a condition was repeated, the mean (one value) of the repeats by that muscle was used to calculate the overall mean for the condition.
ANOVA and F-tests were done using MatLab, and curve fitting was done with Excel10 Solver. Heteroscedastic t-tests were done with Excel10 Analysis ToolPak, a two-tailed t-test, and two samples assuming unequal variance. P values of <0.05 were taken as statistically significant.
Isolated Myofibrils
Myofibrils were isolated from TG (ACTC E99K) and non-TG mice (male and female, age range: 12–23 wk). Mice were euthanized as described above. The heart was removed, and tissue samples (<5 mg) were dissected from the left ventricle, frozen, and kept in liquid nitrogen until myofibrils were prepared. Single myofibrils or thin bundles (2–7 myofibrils) were prepared from the samples by permeabilization and subsequent homogenization. Samples were immersed for 3 h in 2 ml of permeabilization solution containing (in mmol/l) 10 Tris, 132 NaCl, 5 KCl, 1 MgCl2, 5 EGTA, 5 DTT, 10 NaN3, 5 NaF (pH 7.1) and 20 BDM with 1% Triton-X-100. All of our solutions contained the following protease inhibitors (in μM): 10 chymostatin, 5 pepstatin, 10 leupeptin, 10 trans-epoxysuccinyl-l-leucylamido(4-guanidino) butane, and 200 PMSF. Triton X-100 and BDM were then removed from the permeabilized samples using washing solution (like permeabilization solution but without Triton X-100, NaF, and BDM), and, finally, the samples were homogenized for 15 s with an Ultra-Turrax T10 blender (IKA Werke, Staufen, Germany) to produce a suspension of myofibrils. The suspension was washed two times by centrifugation and suspended in the washing solution. A final pellet was dissolved in 200 μl of washing solution and kept on ice for use within 3 days.
Maximum force and the time course (kinetics) of force development and relaxation were measured in fully activated myofibrils (pCa 4.5) (37). The kinetic parameters included the following: rate constant of force development (kACT), duration (tLIN) and rate of the linear slow phase of relaxation (slow kREL), and rate constant of fast phase of relaxation (fast kREL). In some experiments, a quick release-restretch was applied after the force had developed. The myofibril length was decreased by 20%, then held for 20 ms, and then stretched to its initial length. The rate constant of force redevelopment after the stretch (kTR) was measured.
A second set of experiments was done on myofibril preparations to measure the force-[Ca2+] relationship.
Apparatus for measurement of myofibril contractility.
Contraction and relaxation were initiated using a fast-solution change system and sensitive force transducer system, which were similar to those previously described (6). Briefly, our apparatus for the measurement of force in single myofibrils was built around of an inverted microscope (Eclipse Ti-U, Nikon UK, Surrey, UK) equipped with two micromanipulators (MP-285, Sutter Instruments, Novato, and Huxley-type micromanipulator) and a charge-coupled device camera (Rolera XR, Qimaging). Myofibrils were manipulated by means of two fine glass microneedles mounted on the micromanipulators. One microneedle could be moved by a piezoactuator (P 212.40, Physik Instrumente, Bedford, UK) for quick release-restretch movement. The second microneedle was a cantilever force sensor. Under illumination of a 5-mW HeNe laser, the shadow of the tip of the cantilever force sensor was projected on a photodiode position detector (Spot-2D, UDT Sensors, Hawthorne, CA). The extent of bending of the cantilever was proportional to the force on the cantilever, so the force produced by a myofibril was measured from the photodiode's current response. Each cantilever force sensor was calibrated by measuring its compliance using the needle of a microammeter to apply known forces to the cantilever and observing the extent of bending; the range of measured cantilever compliances was 4–11 μm/μN.
Rapid activation and relaxation in myofibrils was achieved using an ultrafast solution change system constructed from a double-barrelled micropipette mounted on a stepper motor that switched solutions in 10 ms. The micropipette was positioned perpendicular to the long axis of the myofibril. The relaxing and activating solutions were applied via adjacent barrels of the micropipettes with flow being driven by gravity. The stepper motor controlled the position of the micropipette relative to the myofibril, thus enabling changes between the two solutions, each flowing in a laminar pattern.
For the force-pCa2+ experiments, we used an eight-channel perfusion valve controller (VC-8M, Warner Instruments). Using this system, it is possible to perfuse the barrel of the micropipette with a range of different solutions. We applied eight different solutions, ranging from low to high [Ca2+], with a 30-s interval between changes, which allowed sufficient time for the myofibril force response to stabilize.
Experimental solutions.
Activating (pCa 4.5: 31.62 μmol/l) and relaxing (pCa 8.0: 0.01 μmol/l) solutions contained (in mmol/l) 10 MOPS (pH 7.0), 5 MgATP, 1 free Mg2+, 5 DTT, and 10 PCr with 200 U/ml creatine kinase. The Ca-EGTA-to-EGTA ratio was set to obtain 10 mmol/l total EGTA and the desired free [Ca2+]. In the force-[Ca2+] experiments, other free [Ca2+] used ranged between pCa 7.0 and 5.25. Potassium propionate and sodium sulfate were added to adjust the ionic strength of the final solution to 200 mmol/l.
Experimental protocol.
A small droplet of myofibril solution was placed on the bottom of the glass chamber (temperature controlled to 16.5 ± 0.7°C). The chamber was then filled with relaxing solution. The selected myofibril was positioned horizontally between the microneedles described above and viewed with the video camera mounted on the microscope. Sarcomere length was set to 2.17 μm while the striation pattern in the myofibril image was observed using the fast Fourier transform analysis function in LabVIEW. The length and diameter of the myofibril were measured using ImageJ (http://imagej.nih.gov/ij/). CSA was calculated from the observed diameter assuming a circular cross-section. Contraction and relaxation were initiated by the fast solution switch system described above. A number of activation-relaxation cycles (range: 1–5) were performed by the myofibril, and the average value of measured parameters for the set of cycles was reported.
Data collection and analysis.
Apparatus control and data recording were done using a data acquisition device (NI USB-6251, National Instruments) and custom-written software in LabVIEW (National Instruments, Newbury, UK). kACT, kTR, and fast kREL were evaluated by curve fitting using the Levenberg-Marquardt nonlinear least-square algorithm in LabVIEW. The slow relaxation phase was fitted using linear regression, and, afterward, the rate of the linear slow phase of relaxation (slow kREL) was calculated dividing the obtained slope by the maximum force. Maximum force was also obtained by curve-fitting force development upon activation. Force data from the force-[Ca2+] experiments were scaled between 0 (minimum force) and 1.0 (maximum force) and then fitted to the following Hill equation: y = [Ca2+]nH/(EC50nH + [Ca2+]nH) by adjusting the values of the Hill coefficient (nH) and EC50.
Ca2+ Transients Measured in Isolated Ventricular Myocytes
Cardiac myocytes were enzymatically isolated from the ventricles of adult male mice using liberase (Roche Applied Science) and a modification of methods previously described in detail elsewhere (43, 44). Intact isolated myocytes were incubated with 5 μmol/l fura-2 AM (Invitrogen) for 20 min at room temperature. Cells were then re-suspended in normal Tyrode solution (140 mmol/l NaCl, 6 mmol/l KCl, 10 mmol/l glucose, 10 mmol/l HEPES, 1 mmol/l MgCl2, and 2 mmol/l CaCl2; pH adjusted to 7.4 with NaOH). After a 30-min period of deesterification of the indicator molecule, myocytes were placed into a small superfusion chamber mounted on the stage of an inverted microscope (Nikon Eclipse, Nikon). Myocyte adhesion to the glass coverslip forming the base of the superfusion chamber was improved using laminin (Sigma-Aldrich). All single myocyte Ca2+ determinations and contraction measurements were performed with an Ionoptix system (Ionoptix, Milton, MA) at 37°C. Data were acquired and analyzed with Ionwizard software. Background subtracted epifluorescence was measured at 510 nm when the excitation was 360 nm (the isobestic point for fura-2) and 380 nm. The fluorescence ratio was calculated by dividing the emitted light signal measured at 360 nm excitation by the emitted light signal determined with 380 nm excitation.
RESULTS
Intact Muscle
Active force in isometric twitches at L0.
The specific twitch force (force expressed relative to CSA) produced by ACTC E99K muscle was much greater than that from non-TG muscle at both 27 and 37°C and when stimulated at a range of frequencies (Fig. 1).
Fig. 1.

Isometric force produced by muscle from α-cardiac actin (ACTC) E99K and nontransgenic (non-TG) mice. Isometric force (in kPa) produced by ACTC E99K (black) and non-TG (gray) muscles is shown. Stimulation was at the frequency shown under the bars. Force was measured when peak twitch force had stabilized during a 150-s series. Values are means ± SE. A: values for whole papillary muscles at 27°C (n = 5 ACTC E99K muscles and 5 non-TG muscles). B: values for strips of papillary muscle and trabeculae at 37°C (n = 5 ACTC E99K mice and 4 non-TG mice).
Peak forces produced by papillary muscles during series of 40 twitches at 2 Hz are shown in Fig. 2 and Table 2. In Fig. 2B, force is expressed relative to that in the second twitch of the series. When expressed in these relative units, it is clear that the decline of force during the series of twitches was greater for ACTC E99K muscle than for non-TG muscle. The difference in relative force between the genotypes for the last twitch in the series was statistically significant (P = 0.048). Time courses of force development and relaxation during individual isometric twitches are shown in Fig. 3. Examples of records from the two genotypes are shown in Fig. 3, A and B, and show how the measurements were made. Figure 3C shows the time to peak force for the series of 40 twitches, which were very similar for the two genotypes. In contrast, Fig. 3D shows that the relaxation of force was very different for the two genotypes: the decline of force after the peak was slower in ACTC E99K muscle, and ∼50% more time was required for force to relax from its peak to half the peak value; this difference occurred during the entire series of 40 twitches. Active force had almost completely relaxed within the 0.5 s between successive stimulations even in the ACTC E99K muscle, which relaxed more slowly. The average value of the force at the end of each cycle (just before the next stimulation) expressed relative to the peak force in the second twitch of the series was higher for the ACTC E99K muscle (0.039 ± 0.014, n = 13) than the non-TG muscle (0.017 ± 0.006, n = 12), but the difference was not statistically significant, and both values were very small (see Table 2, mean of all twitches).
Fig. 2.

Peak isometric force during a series of 40 twitches. Peak isometric force (in kPa) during series of 40 twitches (2-Hz stimulation) is shown. A: results for intact papillary muscles from ACTC E99K mice (n = 13; ●) and non-TG mice (n = 12, ○). Values are means ± SE. B: peak force expressed relative to that in the second twitch of the same series in the same muscle. For clarity, some values are not shown.
Table 2.
Characteristics of isometric twitches of ACTC E99K and non-TG papillary muscles
| ACTC E99K | Non-TG | P Value | |
|---|---|---|---|
| Peak F values | |||
| First twitch, kPa | 20.72 ± 2.43 | 6.82 ± 1.11 | <0.001 |
| Second twitch, kPa | 17.73 ± 2.33 | 5.03 ± 0.94 | <0.001 |
| Last twitch/second twitch | 0.704 ± 0.041 | 0.852 ± 0.058 | 0.048 |
| Mean of all twitches | |||
| Peak F, kPa | 14.63 ± 1.91 | 4.54 ± 0.89 | <0.001 |
| Time from stimulation to peak F, ms | 95.1 ± 2.1 | 93.6 ± 1.9 | 0.591 |
| Time from peak F to one-half peak force, ms | 98.5 ± 2.9 | 68.8 ± 2.3 | <0.001 |
| F at stimulation/peak F in the second twitch | 0.039 ± 0.014 | 0.017 ± 0.006 | 0.177 |
| ∫Fdt, kPa•s | 103.6 ± 14.80 | 20.38 ± 4.09 | <0.001 |
Values are means ± SE based on 1 value/muscle, where the value for each muscle is the mean of all the repeats performed by that muscle; n = 13 ACTC E99K muscles and 12 non-TG muscles. F, active force.
Fig. 3.
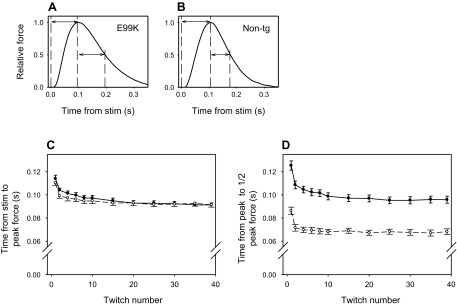
Dynamics of isometric force produced by intact papillary muscle. A: ACTC E99K mice. B: non-TG mice. Force is expressed relative to the peak force in the twitch. The dashed vertical lines indicate (from left to right) the time of the stimulus, peak force, and half peak force during relaxation. The arrows show the time from the stimulus to peak force (ACTC E99K: 0.095 s and non-TG: 0.105 s) and from the peak force to half relaxation (ACTC E99K: 0.100 s and non-TG: 0.070 s). C: summary of the time from stimulus to peak force. D: time from peak force to half peak force in relaxation during a series of 40 twitches at 2 Hz. Values are means ± SE; n = 13 ACTC E99K mice (●) and 12 non-TG mice (○). For clarity, some values are not shown.
Passive stiffness.
When unstimulated papillary muscle was stretched, it produced stretch-resisting force. We measured the passive stiffness as a ratio, the change in force/change in length. In all cases, the change in length was 0.1 L0 (from 0.9 to 1.0 L0); four different velocities of stretch (0.5, 0.67, 1.0, and 2.0 L0/s) were used. Average results are shown in Table 3. For each velocity, the passive stiffness of ACTC E99K muscles was less than non-TG muscles, but the difference was not statistically significant.
Table 3.
Passive stiffness of unstimulated ACTC E99K and non-TG papillary muscles measured during stretches at different velocities
| Velocity, Δlength•Lo−1•s−1 | ACTC E99K | Non-TG | P Value |
|---|---|---|---|
| 0.5 | 74.1 ± 8.2 | 92.9 ± 9.6 | 0.148 |
| 0.67 | 73.1 ± 7.5 | 92.6 ± 10.0 | 0.133 |
| 1.0 | 73.0 ± 7.5 | 93.6 ± 10.3 | 0.122 |
| 2.0 | 75.7 ± 8.0 | 95.5 ± 9.7 | 0.129 |
Values are means ± SE, based on 1 value/muscle, where the value for each muscle is the mean of all the repeats performed by that muscle; n = 13 ACTC E99K muscles and 12 non-TG muscles except for velocity = 1.0, where n = 11 non-TG muscles. Stiffness = Δ (passive force/CSA)/Δ(length/L0), in units of kPa. The distance stretched was 0.1 L0 in all cases.
Work during twitches.
Figure 4A shows an example record of active force produced by a papillary muscle during a twitch with shortening at a velocity 0.67 L0/s. The net work during this twitch is the area enclosed in the work loop plot of active force versus length change (Fig. 4B). A summary of the net work during series of 40 twitches with shortening at four velocities is shown in Fig. 4C. At all velocities, ACTC E99K muscles produced at least threefold more work than non-TG muscles. This higher mechanical performance by ACTC E99K muscles is consistent with the difference in peak isometric force described above and shown in Fig. 2A. ANOVA showed a highly significant difference between work done by the genotypes but not among velocities. Figure 4C also shows the mean work for all velocities for each genotype; the difference between genotypes was statistically significant.
The change in work per twitch during progress of the series of 40 twitches with shortening at 0.67 L0/s is shown in Fig. 4D for the two genotypes. At other velocities, a very similar pattern was seen except for non-TG muscle shortening at the highest velocity, 2 L0/s, where work increased during the series. Table 4 shows the work in the last twitch of the series relative to that in the second twitch for all velocities. The work declined more for ACTC E99K muscles than for non-TG muscles, but the differences were not statistically significant.
Table 4.
Maintenance of work during the series of twitches of ACTC E99K and nonTG papillary muscles shortening at various velocities
| Velocity, Δlength•Lo−1•s−1 | ACTC E99K | Non-TG | P Value |
|---|---|---|---|
| 0.5 | 0.639 ± 0.067 | 0.756 ± 0.050 | 0.180 |
| 0.67 | 0.688 ± 0.075 | 0.796 ± 0.070 | 0.306 |
| 1.0 | 0.757 ± 0.077 | 0.811 ± 0.065 | 0.594 |
| 2.0 | 0.795 ± 0.083 | 1.13 ± 0.020 | 0.147 |
Values are means ± SE, based on 1 value/muscle, where the value for each muscle is the mean of all the repeats performed by that muscle; n = 13 ACTC E99K muscles and 12 non-TG muscles except for velocity = 0.67 and 1.0, where n = 11 non-TG muscles. Work in 40th twitch/work in 2nd twitch by same muscle is shown.
Energetic cost of twitches.
We evaluated efficiency by comparing the mechanical output with the total energy turnover during the series of 40 twitches. For the isometric twitches, the force-time integral × L0 was used as the measure of mechanical output and heat as the measure of total energy turnover. (L0 is included to take account of muscle size.) For twitches with shortening, net work was used as the measure of mechanical output, and work + heat was used as the measure of total energy output. These are per muscle values that are not expressed relative to muscle mass (see methods).
Our underlying assumption is that mechanical output and total energy turnover are coupled, but the efficiency of coupling may vary. We observed a continuous relationship between mechanical output and total energy turnover approximating to a saturation curve with the slope diminishing at higher energy outputs; accordingly, the data were fitted to the following equation: y = (maximum × x)/(K + x), where maximum and K are constants (Fig. 5, A and B). The curve fit the data significantly better than a linear regression; F-ratio tests for both isometric and working cases were significant, P = 0.0078 and 0.0032, respectively. The change in slope of the saturation curve indicated that mechanical output as a fraction of total energy turnover (efficiency) was reduced when total energy output increased for both types of contraction. The non-TG observations were in the low to middle total energy turnover range, for which the efficiency values w/h + w range from 0.18 to 0.15. ACTC E99K values were in the middle to high total energy output range, with efficiencies ranging from 0.16 to 0.11.
Recovery.
The total energy turnover during the series of 40 twitches consists of both initial energy (initial heat + work) directly due to contraction and energy due to the recovery processes that resynthesize the ATP used by actomyosin used to drive ion fluxes. We separated the energy produced during the series of twitches into initial energy and recovery heat and also measured the part of the recovery heat produced during 60 s afterward (see the example in Fig. 5C). The results were expressed as recovery ratios, recovery heat/(initial heat + work), which provide evidence about the efficiency of resynthesis of ATP.
Figure 5D shows the values of the recovery ratios for ACTC E99K and non-TG papillary muscles. The recovery ratios of the two genotypes (ACTC E99K: 1.6 ± 0.2, n = 7, and non-TG: 2.0 ± 0.5, n = 4) were not significantly different (P = 0.50), although it should be noted that the variance of the non-TG value was relatively large.
Contraction of Myofibrils
Force production by single or small bundles of heart myofibrils after rapid [Ca2+] changes were measured (Fig. 6). Maximum force (expressed relative to CSA) and kinetic parameters for changes in force during development and relaxation of myofibrils at saturating [Ca2+] are shown in Table 5. Comparison of the values for myofibrils from ventricles of ACTC E99K and non-TG mice showed that there were no significant differences in maximum force or in kACT and kTR. The observation that kACT matched kTR for both ACTC E99K and non-TG myofibrils is evidence that force development upon activation was not limited by diffusion of Ca2+ in either type of myofibril. The results for relaxation showed that the ACTC E99K mutation significantly impaired myofibril relaxation (see Fig. 6B). tLIN was longer (by 87%, P = 0.0005), slow kREL was slower (by 55%, P = 0.0030), and fast kREL was also reduced (by 39%, P = 0.0043) in ACTC E99K myofibrils.
Fig. 6.

A: example record of force produced by a sample of non-TG myofibrils. The arrows indicated the time of switch to activating, high-Ca2+ solution (Act) and to relaxing, low-Ca2+ solution (Rel) brought about by rapidly switching the solutions. The point at which the release-restretch maneuver was initiated is indicated by the arrow labeled R-R. Four myofibrils (length: 45 μm) were adjusted to 2.17-μm sarcomere length before the solutions were switched and kinetic parameters were recorded. B: example records of force relaxation of an ACTC E99K sample (5 myofibrils, ●) and a non-TG sample (4 myofibrils, ○) plotted on an expanded timescale to illustrate the differences in relaxation rates. Force is expressed relative to the maximum value after the initiation of solution change. Time 0 corresponds to the initiation of the change to pCa 8.0 solution. Force values were recorded at 1-ms intervals, and all values recorded between 0 and 0.1 s are shown. At later times, for clarity, not all values are shown. C: relationship between isometric force and [Ca2+] for ACTC E99K and non-TG myofibrils. Example results for two experiments are shown. Force values were scaled between 0, the minimum value, and 1.0, the maximum value. The lines show the Hill equation fitted to the observations: ACTC E99K, EC50: 0.393 μmol/l, Hill coefficient = 2.14; and non-TG, EC50 = 0.744 μmol/l, Hill coefficient = 3.68. Mean EC50 from multiple myofibril preparations: ACTC E99K, 0.336 ± 0.014 μmol/l, n = 5; and non-TG, 0.803 ± 0.114 μmol/l, n = 7 (see Table 5).
Table 5.
Maximal tension, Ca2+ activation, and kinetic parameters of cardiac myofibrils isolated from ACTC E99K and non-TG mice
| ACTC E99K | Non-TG | |||
|---|---|---|---|---|
| Means ± SE | n | Means ± SE | n | |
| Isometric force | ||||
| Fmax, kN/m2 | 70.2 ± 4.9 | 11 | 77.8 ± 5.5 | 20 |
| EC50 Ca2+ activation, μmol/l | 0.34 ± 0.01* | 5 | 0.80 ± 0.11 | 7 |
| Activation kinetics | ||||
| kACT, s−1 | 4.37 ± 0.68 | 13 | 4.55 ± 0.42 | 14 |
| kTR, s−1 | 5.63 ± 0.86 | 5 | 5.56 ± 0.53 | 11 |
| Relaxation kinetics | ||||
| tLIN, ms | 71.2 ± 6.9* | 7 | 38.0 ± 3.7 | 9 |
| Slow kREL, s−1 | 1.50 ± 0.29* | 7 | 3.35 ± 0.41 | 6 |
| Fast kREL, s−1 | 21.9 ± 3.4* | 7 | 35.7 ± 2.4 | 9 |
n, Number of myofibril samples. Experimental conditions were as follows: mean temperature was 16.5 ± 0.7°C (mean ± SD) and single or bundles of myofibrils (≤7) were adjusted to a mean sarcomere length of 2.17 ± 0.04 μm (mean ± SD). kACT, rate constant of force development; kTR, rate constant of force redevelopment after the stretch; tLIN, duration of the linear slow phase of relaxation; kREL, rate constant of fast phase of relaxation.
P < 0.05, non-TG vs. ACTC E99K (by Student's t-test).
To determine whether Ca2+ sensitivity was changed by the ACTC E99K mutation, the isometric force-[Ca2+] response of myofibrils was measured by changing [Ca2+] in steps. The force-[Ca2+] curve of ACTC E99K myofibrils was shifted to the left of that for non-TG myofibrils, indicating that ACTC E99K myofibrils had a significantly higher Ca2+ sensitivity (Fig. 6C). The mean EC50 for ACTC E99K myofibrils was only 42% of that required by myofibrils from non-TG mice (P = 0.004, n = 7; see Table 5).
Intracellular [Ca2+] in Isolated Myocytes
Shortening and intracellular [Ca2+] were compared during steady-state stimulation at 1.0 Hz in cells isolated from male ACTC E99K or non-TG mouse hearts. Mean amplitudes of Ca2+ transients and twitches were not significantly different, whereas diastolic Ca2+ levels appeared to be 10% less in ACTC E99K mice, suggesting that Ca2+ delivery to the myofilaments was not greatly altered by the HCM mutation (Table 6).
Table 6.
Ca2+ transients, diastolic [Ca2+], and shortening measured in single myocytes
| ACTC E99K | Non-TG | P Value | |||
|---|---|---|---|---|---|
| Means ± SE | Number of cells/number of mice | Means ± SE | Number of cells/number of mice | ||
| Ca2+ transient amplitude, fura-2 Δratio | 0.48 ± 0.04 | 37/5 | 0.56 ± 0.03 | 46/5 | 0.12 |
| Diastolic [Ca2+], fura-2 Δratio | 1.26 ± 0.02 | 37/5 | 1.38 ± 0.01 | 46/5 | <0.001 |
| Sarcomere shortening, μm | 0.10 ± 0.01 | 53/7 | 0.11 ± 0.01 | 63/6 | 0.14 |
DISCUSSION
We compared the contractile performance and energetics of papillary muscle from the ACTC E99K mouse model of HCM with non-TG littermates. We found that ACTC E99K muscle is hypercontractile both in isometric contractions and work-producing cycles and that the high mechanical performance by ACTC E99K muscle was accompanied by an increased force cost and reduced efficiency of converting the energy of ATP hydrolysis to work.
In isometric twitches, ACTC E99K muscle produced three to four times greater force than non-TG muscle under the same conditions, and this greater contractility was observed independent of stimulation frequency and temperature (Fig. 1). In working cycles, ACTC E99K papillary muscle generated about three times the work of non-TG muscle. We believe this hypercontractility is a consequence of the higher myofibrillar Ca2+ sensitivity in the ACTC E99K contractile apparatus. A number of lines of evidence support this interpretation. Here, we report measurements of isometric force in isolated myofibrils showing that Ca2+ sensitivity was 2.5 times higher, in agreement with previous assays of the ACTC E99K mouse using an in vitro motility assay and permeabilized papillary muscle (36). These results are also consistent with those from other HCM mutations, most of which have myofibrillar Ca2+ sensitivity increased by 1.5 to 2.5-fold [as summarized by Marston (23)]. We conclude that the hypercontractility of intact papillary muscle reported is here due to higher Ca2+ sensitivity and not due to increased maximum force-producing capacity because our results with fully activated myofibrils show that the maximum isometric force in ACTC E99K myofibrils was not significantly different from that of non-TG myofibrils. Studies (25, 38, 40) in other HCM models have likewise found similar or reduced maximum force compared with maximally activated wild-type controls.
The rate of force development after stimulation was the same as non-TG mice for both electrical stimulation in intact muscle and after Ca2+ jump in myofibrils. ACTC E99K muscles relaxed slower than non-TG muscles for both papillary muscle (1.4×) and individual myofibrils (1.7×). This result resembles other studies of HCM mutations in mouse myofibrils (18, 21). The slower relaxation could be due to cross-bridges remaining attached for a longer time and/or to additional attachments during relaxation. Our methods do not distinguish between these two mechanisms, but when energy turnover is high (and efficiency relatively low; Fig. 5, A and B) there are more cross-bridge cycles, and it seems likely that some of these occur during relaxation.
The link between excitation and contraction is the release of Ca2+ from the sarcoplasmic reticulum into the sarcoplasm. We found that measurements of intracellular Ca2+ transients indicated no significant difference in amplitudes in ACTC E99K and non-TG mouse cardiomyocytes (Table 6). These parameters have been measured in several different TG mouse models of HCM, and both increases and decreases have been observed (11, 12, 15, 32), suggesting the pattern of changes in Ca2+ handling in mouse models of HCM may be mutation or gene specific (15). In the absence of compensatory changes in the Ca2+ transient, it is probable that the maximum concentration of sarcoplasmic Ca2+ reached is not sufficient in magnitude or duration to fully activate the intact papillary muscle during a twitch. In this situation, the higher myofibrillar Ca2+ sensitivity would automatically lead to higher contractility since [Ca2+] is partially saturating.
We used a thermopile to measure heat production by ex vivo papillary muscles. The sensitivity and time resolution of thermopiles compare favorably with other methods used to study the energetics of contraction, such as O2 consumption and P-MRS. Limitations of these methods have been fully discussed by Woledge (50). A major difference is that myothermic techniques are nonspecific. The twitches of papillary muscle produce relatively low force compared with skeletal muscle, presumably due to a lower density and rate of actively cycling cross-bridges. Consequently, detecting heat production during a papillary muscle twitch approaches the limits of resolution. Also, after a series of twitches, recovery heat is produced at a relatively low rate, so measuring it is particularly difficult because baseline drift can mask the signal.
Measurement of the energy (work + heat) released in actively cycling heart muscle showed that for both genotypes, the amount of energy turnover increased with mechanical output as force in isometric twitches and as net work in cycles of shortening and lengthening. However, the relationship was better described by a saturating curve (Fig. 5, A and B) than a straight line. Thus, efficiency decreased as energy turnover increased, with non-TG results populating the high to middle efficiency range (0.18–0.16) and ACTC E99K results in the middle to low efficiency range (0.15–0.11). The ACTC E99K mouse heart muscle produced, on average, threefold more work than non-TG mouse heart, and the cost in terms of energy turnover was disproportionately higher than the non-TG mouse heart.
The efficiency of conversion of energy of ATP hydrolysis to work by the actomyosin motors is greater than these overall efficiency figures because some of the energy turnover measured in the series of twitches is not converted to work but is instead used for active transport of ions and by the resynthesis of ATP by oxidative phosphorylation.
Total energy turnover consists of initial energy directly due to contraction and the energy due to the recovery processes that resynthesize the ATP used by actomyosin and used to drive ions fluxes (3, 8, 24). The efficiency values described above could reflect a difference in the initial and/or recovery processes. For example, ACTC E99K efficiency could be lower than that of non-TG efficiency due to less work being done per ATP used and/or to more oxidation being required per unit of ATP resynthesis. In the latter case, TG mice would have a higher overall recovery ratio [equal to recovery heat/(initial heat + work)]. Recovery ratios were not significantly different for ACTC E99K and non-TG muscles (1.6 ± 0.2, n = 7, and 2.0 ± 0.5, n = 4, P = 0.50; Fig. 5D), which suggests that less efficient recovery processes in the TG muscle could not account for the efficiency difference reported above. In support of this, a study by He et al. (16) found that “ATP supply pathways assessed as Vmax of key mitochondrial, glycolytic, and phosphotransfer enzymes, are normal” in HCM TG and non-TG mouse hearts.
Since the primary effect of the ACTC E99K mutation is a substantially increased myofibrillar Ca2+ sensitivity that can account for the hypercontractility and higher work output, we suppose that this is also the cause of the reduced efficiency. This may be partly due to the slower relaxation leading to incomplete relaxation of the ACTC E99K muscle between twitches (Table 2). Alternatively, the population of actomyosin motors could be intrinsically less efficient when activated for a longer period of time within each twitch. There is both indirect (28) and direct (5) evidence showing that efficiency is less under fully activated conditions in skeletal muscle. A mechanism that could plausibly underlie such an effect in our papillary muscle is suggested by considering the number of ATP-using cross-bridge cycles during the twitches. Energy amounting to 130 μJ would be produced if there was 1 ATP turnover per myosin per twitch [calculated using 40 twitches and 1.5 mg muscle mass from the experiments reported here, 0.055 nmol myosin/mg muscle mass (49) and assuming 39 kJ energy/mol ATP, which corresponds to 34 kJ/mol for initial processes + 5 kJ/mol for partial recovery during the series of twitches]. The energy turnover by most of our non-TG muscles was <130 μJ, and most of the ACTC E99K energy turnover values were >130 μJ (see Fig. 5, A and B). A value of 1 ATP turnover per myosin per twitch matches was found by Widen and Barclay (49) for non-TG papillary muscles under conditions very similar to those used here. Thus, the results shown in Fig. 5, A and B, indicate that the greater Ca2+ sensitivity of ACTC E99K muscle results in >1 ATP turnover per myosin per twitch. In mechanistic terms, there are at least two ways that more cross-bridge cycles per twitch could cause lower efficiency by reducing the work done per ATP: 1) shortening ends before the second cross-bridge cycle has completed its full power stroke, so some of its energy cannot be converted to work; and/or 2) with a higher proportion of attached cross-bridges, it is more likely that some of them are pulled into the range where they exert negative force, thus decreasing the aggregate work produced by the entire ensemble of cross-bridges. See Refs. 4 and 35 for descriptions of cross-bridge models of this type.
Previous studies of HCM heart muscle have shown an increased force cost or reduced ATP-to-PCr ratios (16, 19, 25). It should be appreciated that these types of measurements do not directly correspond to the efficiency of chemomechanical transduction by the ATP-consuming actomyosin motor measured here. In fact, changes in force costs and ATP-to-PCr ratios would be probable secondary consequences of the reduced efficiency but could equally be due to other unrelated factors. In the absence of any compensatory changes in the resynthesis of ATP, reduced contractile efficiency would lead to an energetically compromised heart, as indicated by the results of magnetic resonance measurements (7, 16). This could be the trigger for hypertrophy, as proposed by Ashrafian et al. (2). The beneficial effect of energy-sparing drugs such as perhexiline is compatible with this hypothesis and may represent an effective therapy for HCM (1). On the other hand, treatment of the primary defect in Ca2+ sensitivity with Ca2+-desensitising drugs such as diltiazem (34) could be a more appropriate target.
GRANTS
This work was supported by a grant from the British Heart Foundation Grant RG/08/010/25918 and Seventh Framework Program of the European Union “BIG-HEART” Grant Agreement 241577.
DISCLOSURES
No conflicts of interest, financial or otherwise, are declared by the author(s).
AUTHOR CONTRIBUTIONS
Author contributions: W.S., P.G.V., M.A.F., K.T.M., S.M., and N.A.C. conception and design of research; W.S., P.G.V., M.N.K., C.R., and N.A.C. performed experiments; W.S., P.G.V., M.N.K., C.R., M.A.F., R.C.W., K.T.M., and N.A.C. analyzed data; W.S., P.G.V., M.N.K., C.R., M.A.F., R.C.W., K.T.M., S.M., and N.A.C. interpreted results of experiments; W.S., M.N.K., C.R., M.A.F., R.C.W., K.T.M., S.M., and N.A.C. edited and revised manuscript; W.S., P.G.V., M.N.K., C.R., M.A.F., R.C.W., K.T.M., S.M., and N.A.C. approved final version of manuscript; P.G.V., M.N.K., R.C.W., K.T.M., and N.A.C. prepared figures; P.G.V., M.A.F., R.C.W., K.T.M., S.M., and N.A.C. drafted manuscript.
ACKNOWLEDGMENTS
The authors thank Dr. Chris Barclay (Griffith University) and Dr. Sally Page (University College London) for help and advice about the papillary muscle experiments and Fadi Ifram for contributing to the papillary muscle measurements. The authors are grateful to Corrado Poggesi and Chiara Tesi (University of Florence) for help and advice on constructing the myofibrillar force apparatus.
*Present address of M. A. Ferenczi: Lee Kong Chian School of Medicine, Nanyang Technological University, Singapore 637553.
REFERENCES
- 1. Abozguia K, Elliott P, McKenna W, Phan TT, Nallur-Shivu G, Ahmed I, Maher AR, Kaur K, Taylor J, Henning A, Ashrafian H, Watkins H, Frenneaux M. Metabolic modulator perhexiline corrects energy deficiency and improves exercise capacity in symptomatic hypertrophic cardiomyopathy. Circulation 122: 1562–1569, 2010 [DOI] [PubMed] [Google Scholar]
- 2. Ashrafian H, Redwood C, Blair E, Watkins H. Hypertrophic cardiomyopathy:a paradigm for myocardial energy depletion. Trends Genet 19: 263–268, 2003 [DOI] [PubMed] [Google Scholar]
- 3. Barclay CJ, Widen C, Mellors LJ. Initial mechanical efficiency of isolated cardiac muscle. J Exp Biol 206: 2725–2732, 2003 [DOI] [PubMed] [Google Scholar]
- 4. Barclay CJ, Woledge RC, Curtin NA. Inferring crossbridge properties from skeletal muscle energetics. Prog Biophys Mol Biol 102: 53–71, 2010 [DOI] [PubMed] [Google Scholar]
- 5. Buschman HP, Elzinga G, Woledge RC. The effects of the level of activation and shortening velocity on energy output in type 3 muscle fibres from Xenopus laevis. Pflügers Arch 433: 153–159, 1996 [DOI] [PubMed] [Google Scholar]
- 6. Colomo F, Piroddi N, Poggesi C, te Kronnie G, Tesi C. Active and passive forces of isolated myofibrils from cardiac and fast skeletal muscle of the frog. J Physiol 500: 535–548, 1997 [DOI] [PMC free article] [PubMed] [Google Scholar]
- 7. Crilley JG, Boehm EA, Blair E, Rajagopalan B, Blamire AM, Styles P, McKenna WJ, Ostman-Smith I, Clarke K, Watkins H. Hypertrophic cardiomyopathy due to sarcomeric gene mutations is characterized by impaired energy metabolism irrespective of the degree of hypertrophy. J Am Coll Cardiol 41: 1776–1782, 2003 [DOI] [PubMed] [Google Scholar]
- 8. Curtin NA, Kushmerick MJ, Wiseman RW, Woledge RC. Recovery after contraction of white muscle fibres from the dogfish Scyliorhinus canicula. J Exp Biol 200: 1061–1071, 1997 [DOI] [PubMed] [Google Scholar]
- 9. Daut J, Elzinga G. Heat production of quiescent ventricular trabeculae isolated from guinea-pig heart. J Physiol 398: 259–275, 1988 [DOI] [PMC free article] [PubMed] [Google Scholar]
- 10. Elliott P, McKenna WJ. Hypertrophic cardiomyopathy. Lancet 363: 1881–1891, 2004 [DOI] [PubMed] [Google Scholar]
- 11. Fraysse B, Weinberger F, Bardswell SC, Cuello F, Vignier N, Geertz B, Starbatty J, Krämer E, Coirault C, Eschenhagen T, Kentish JC, Avkiran M, Carrier L. Increased myofilament Ca2+ sensitivity and diastolic dysfunction as early consequences of Mybpc3 mutation in heterozygous knock-in mice. J Mol Cell Cardiol 52: 1299–1307, 2012 [DOI] [PMC free article] [PubMed] [Google Scholar]
- 12. Gao WD, Perez NG, Seidman CE, Seidman JG, Marban E. Altered cardiac excitation-contraction coupling in mutant mice with familial hypertrophic cardiomyopathy. J Clin Invest 103: 661–666, 1999 [DOI] [PMC free article] [PubMed] [Google Scholar]
- 13. Gibbs CL, Barclay CJ. Cardiac efficiency. Cardiovasc Res 30: 627–634, 1995 [PubMed] [Google Scholar]
- 14. Gibbs CL, Chapman JB. Cardiac heat production. Annu Rev Physiol 41: 507–519, 1979 [DOI] [PubMed] [Google Scholar]
- 15. Haim TE, Dowell C, Diamanti T, Scheuer J, Tardiff JC. Independent FHC-related cardiac troponin T mutations exhibit specific alterations in myocellular contractility and calcium kinetics. J Mol Cell Cardiol 42: 1098–1110, 2007 [DOI] [PubMed] [Google Scholar]
- 16. He H, Javadpour MM, Latif F, Tardiff JC, Ingwall JS. R-92L and R-92W mutations in cardiac troponin T lead to distinct energetic phenotypes in intact mouse hearts. Biophys J 93: 1834–1844, 2007 [DOI] [PMC free article] [PubMed] [Google Scholar]
- 17. Huke S, Knollmann BC. Increased myofilament Ca2+-sensitivity and arrhythmia susceptibility. J Mol Cell Cardiol 48: 824–833, 2010 [DOI] [PMC free article] [PubMed] [Google Scholar]
- 18. Iorga B, Blaudeck N, Solzin J, Neulen A, Stehle I, Lopez Davila AJ, Pfitzer G, Stehle R. Lys184 deletion in troponin I impairs relaxation kinetics and induces hypercontractility in murine cardiac myofibrils. Cardiovasc Res 77: 676–686, 2008 [DOI] [PubMed] [Google Scholar]
- 19. Javadpour MM, Tardiff JC, Pinz I, Ingwall JS. Decreased energetics in murine hearts bearing the R92Q mutation in cardiac troponin T. J Clin Invest 112: 768–775, 2003 [DOI] [PMC free article] [PubMed] [Google Scholar]
- 20. Kretzschmar KM, Wilkie DR. The use of the Peltier effect for simple and accurate calibration of thermoelectric devices. Proc R Soc Lond B Biol Sci 190: 315–321, 1975 [DOI] [PubMed] [Google Scholar]
- 21. Kruger M, Zittrich S, Redwood C, Blaudeck N, James J, Robbins J, Pfitzer G, Stehle R. Effects of the mutation R145G in human cardiac troponin I on the kinetics of the contraction-relaxation cycle in isolated cardiac myofibrils. J Physiol 564: 347–357, 2005 [DOI] [PMC free article] [PubMed] [Google Scholar]
- 22. Maron BJ, Towbin J, Thiene G, Antzelevitch C, Corrado D, Arnett D, Moss AJ, Seidman CE, Young JB. Contemporary definitions and classification of the cardiomyopathies: an American Heart Association Scientific Statement from the Council on Clinical Cardiology, Heart Failure and Transplantation Committee; Quality of Care and Outcomes Research and Functional Genomics and Translational Biology Interdisciplinary Working Groups; and Council on Epidemiology and Prevention. Circulation 113: 1807–1816, 2006 [DOI] [PubMed] [Google Scholar]
- 23. Marston SB. How do mutations in contractile proteins cause the primary familial cardiomyopathies? J Cardiovasc Transl Res 4: 245–255, 2011 [DOI] [PubMed] [Google Scholar]
- 24. Mast F, Woledge RC, Elzinga G. Analysis of thermopile records from contracting isolated cardiac muscle. Am J Physiol Heart Circ Physiol 259: H1601–H1605, 1990 [DOI] [PubMed] [Google Scholar]
- 25. Montgomery DE, Tardiff JC, Chandra M. Cardiac troponin T mutations: correlation between the type of mutation and the nature of myofilament dysfunction in transgenic mice. J Physiol 536: 583–592, 2001 [DOI] [PMC free article] [PubMed] [Google Scholar]
- 26. Mulieri LA, Luhr G, Trefry J, Alpert NR. Metal-film thermopiles for use with rabbit right ventricular papillary muscles. Am J Physiol Cell Physiol 233: C146–C156, 1977 [DOI] [PubMed] [Google Scholar]
- 27. Nagueh SF, Chen S, Patel R, Tsybouleva N, Lutucuta S, Kopelen HA, Zoghbi WA, Quinones MA, Roberts R, Marian AJ. Evolution of expression of cardiac phenotypes over a 4-year period in the beta-myosin heavy chain-Q403 transgenic rabbit model of human hypertrophic cardiomyopathy. J Mol Cell Cardiol 36: 663–673, 2004 [DOI] [PMC free article] [PubMed] [Google Scholar]
- 28. Potma EJ, Stienen GJ, Barends JP, Elzinga G. Myofibrillar ATPase activity and mechanical performance of skinned fibres from rabbit psoas muscle. J Physiol 474: 303–317, 1994 [DOI] [PMC free article] [PubMed] [Google Scholar]
- 29. Redwood CS, Moolman-Smook JC, Watkins H. Properties of mutant contractile proteins that cause hypertrophic cardiomyopathy. Cardiovasc Res 44: 20–36, 1999 [DOI] [PubMed] [Google Scholar]
- 30. Richard P, Charron P, Carrier L, Ledeuil C, Cheav T, Pichereau C, Benaiche A, Isnard R, Duborg O, Burban M, Geffet JP, Millaire A, Desnos M, Schwartz K, Hainque B, Komadja M. Hypertrophic cardiomyopathy distribution of disease genes, spectrum of mutations, and implications for a molecular diagnosis strategy. Circulation 107: 2227–2232, 2003 [DOI] [PubMed] [Google Scholar]
- 31. Schenkman KA. Cardiac performance as a function of intracellular oxygen tension in buffer-perfused hearts. Am J Physiol Heart Circ Physiol 281: H2463–H2472, 2001 [DOI] [PubMed] [Google Scholar]
- 32. Schober T, Huke S, Venkataraman R, Gryshchenko O, Kryshtal D, Hwang HS, Baudenbacher FJ, Knollmann BC. Myofilament Ca sensitization increases cytosolic Ca binding affinity, alters intracellular Ca homeostasis, and causes pause-dependent Ca triggered arrhythmia. Circ Res 111: 170–179, 2012 [DOI] [PMC free article] [PubMed] [Google Scholar]
- 33. Seidman JG, Seidman C. The genetic basis for cardiomyopathy: from mutation identification to mechanistic paradigms. Cell 104: 557–567, 2001 [DOI] [PubMed] [Google Scholar]
- 34. Semsarian C, Ahmad I, Giewat M, Georgakopoulos D, Schmitt JP, McConnell BK, Reiken S, Mende U, Marks AR, Kass DA, Seidman CE, Seidman JG. The L-type calcium channel inhibitor diltiazem prevents cardiomyopathy in a mouse model. J Clin Invest 109: 1013–1020, 2002 [DOI] [PMC free article] [PubMed] [Google Scholar]
- 35. Smith NP, Barclay CJ, Loiselle DS. The efficiency of muscle contraction. Prog Biophys Mol Biol 88: 1–58, 2005 [DOI] [PubMed] [Google Scholar]
- 36. Song W, Dyer E, Stuckey D, Copeland O, Leung M, Bayliss C, Messer AE, Wilkinson R, Tremoleda J, Schneider M, Harding S, Redwood C, Clarke K, Nowak K, Monserrat L, Wells D, Marston S. Molecular mechanism of the Glu99lys mutation in cardiac actin (ACTC gene) that causes apical hypertrophy in man and mouse. J Biol Chem 286: 27582–27593, 2011 [DOI] [PMC free article] [PubMed] [Google Scholar]
- 37. Stehle R, Solzin J, Iorga B, Poggesi C. Insights into the kinetics of Ca2+-regulated contraction and relaxation from myofibril studies. Pflügers Arch 458: 337–357, 2009 [DOI] [PubMed] [Google Scholar]
- 38. Szczesna D, Zhang R, Zhao J, Jones M, Guzman G, Potter JD. Altered regulation of cardiac muscle contraction by troponin T mutations that cause familial hypertrophic cardiomyopathy. J Biol Chem 275: 624–630, 2000 [DOI] [PubMed] [Google Scholar]
- 39. Taberner AJ, Han JC, Loiselle DS, Nielsen PM. An innovative work-loop calorimeter for in vitro measurement of the mechanics and energetics of working cardiac trabeculae. J Appl Physiol 111: 1798–1803, 2011 [DOI] [PubMed] [Google Scholar]
- 40. Takahashi-Yanaga F, Morimoto S, Harada K, Minakami R, Shiraishi F, Ohta M, Lu QW, Sasaguri T, Ohtsuki I. Functional consequences of the mutations in human cardiac troponin I gene found in familial hypertrophic cardiomyopathy. J Mol Cell Cardiol 33: 2095–2107, 2001 [DOI] [PubMed] [Google Scholar]
- 41. Tanaka M, Fujiwara H, Onodera T, Wu DJ, Matsuda M, Hamashima Y, Kawai C. Pathogenetic role of myocardial fiber disarray in the progression of cardiac fibrosis in normal hearts, hypertensive hearts and hearts with hypertrophic cardiomyopathy. Jpn Circ J 51: 624–630, 1987 [DOI] [PubMed] [Google Scholar]
- 42. Tardiff JC. Thin filament mutations: developing an integrative approach to a complex disorder. Circ Res 108: 765–782, 2011 [DOI] [PMC free article] [PubMed] [Google Scholar]
- 43. Terracciano CM, Philipson KD, MacLeod KT. Overexpression of the Na+/Ca2+ exchanger and inhibition of the sarcoplasmic reticulum Ca2+-ATPase in ventricular myocytes from transgenic mice. Cardiovasc Res 49: 38–47, 2001 [DOI] [PubMed] [Google Scholar]
- 44. Terracciano CM, Souza AI, Philipson KD, MacLeod KT. Na+-Ca2+ exchange and sarcoplasmic reticular Ca2+ regulation in ventricular myocytes from transgenic mice overexpressing the Na+-Ca2+ exchanger. J Physiol 512: 651–667, 1998 [DOI] [PMC free article] [PubMed] [Google Scholar]
- 45. Van Driest SL, Ellsworth EG, Ommen SR, Tajik AJ, Gersh BJ, Ackerman MJ. Prevalence and spectrum of thin filament mutations in an outpatient referral population with hypertrophic cardiomyopathy. Circulation 108: 445–451, 2003 [DOI] [PubMed] [Google Scholar]
- 46. Van Driest SL, Jaeger MA, Ommen SR, Will ML, Gersh BJ, Tajik AJ, Ackerman MJ. Comprehensive analysis of the β-myosin heavy chain gene in 389 unrelated patients with hypertrophic cardiomyopathy. J Am Coll Cardiol 44: 602–610, 2004 [DOI] [PubMed] [Google Scholar]
- 47. Van Driest SL, Vasile VC, Ommen SR, Will ML, Tajik AJ, Gersh BJ, Ackerman MJ. Myosin binding protein C mutations and compound heterozygosity in hypertrophic cardiomyopathy. J Am Coll Cardiol 44: 1903–1910, 2004 [DOI] [PubMed] [Google Scholar]
- 48. Watkins H, Ashrafian H, Redwood C. Inherited cardiomyopathies. N Engl J Med 364: 1643–1656, 2011 [DOI] [PubMed] [Google Scholar]
- 49. Widen C, Barclay CJ. ATP splitting by half the cross-bridges can explain the twitch energetics of mouse papillary muscle. J Physiol 573: 5–15, 2006 [DOI] [PMC free article] [PubMed] [Google Scholar]
- 50. Woledge RC. Techniques for muscle energetics. In: Current Methods in Muscle Physiology: Advantages, Problems and Limitations, edited by Sugi H. Oxford: Oxford Univ. Press, 1998, p. 343–370 [Google Scholar]