Abstract
The functions of the skeletal muscle exercise pressor reflex (EPR) and its mechanically sensitive component are augmented in hypertension producing exaggerated increases in blood pressure during exercise. Afferent information from the EPR is processed in the nucleus tractus solitarius (NTS). Within the NT, nitric oxide (NO), produced via l-arginine oxidation by neuronal nitric oxide synthase (nNOS), buffers the pressor response to EPR activation. Therefore, EPR overactivity may manifest as a decrease in NO production due to reductions in nNOS. We hypothesized that nNOS protein expression is lower in the NTS of spontaneously hypertensive (SHR) compared with normotensive Wistar-Kyoto (WKY) rats. Further, we examined whether nNOS is expressed with FOS, a marker of neuronal excitation induced by EPR activation. The EPR and mechanoreflex were intermittently activated for 1 h via hindlimb static contraction or stretch, respectively. These maneuvers produced significantly greater pressor responses in SHR during the first 25 min of stimulation. Within the NTS, nNOS expression was lower from −14.9 to −13.4 bregma in SHR compared with WKY. For example, at −14.5 bregma the number of NTS nNOS-positive cells in SHR (13 ± 1) was significantly less than WKY (23 ± 2). However, the number of FOS-positive cells after muscle contraction in this area was not different (WKY = 82 ± 18; SHR = 75 ± 8). In both groups, FOS-expressing neurons were located within the same areas of the NTS as neurons containing nNOS. These findings demonstrate that nNOS protein expression is lower within NTS areas excited by skeletal muscle reflexes in hypertensive rats.
Keywords: hypertension, exercise, nucleus tractus solitarius
physical activity induces increases in arterial blood pressure (ABP), heart rate (HR), and sympathetic nerve activity (20, 32). In hypertension, exercise evokes abnormally exaggerated elevations in each of these variables (2, 9, 27). This places hypertensive patients at a greater risk for the occurrence of an adverse cardiovascular and/or cerebrovascular event during or immediately after a bout of exercise (6, 21). As a result, the intensity and duration of exercise prescription at a level that is both safe and therapeutically effective are often limited. Thus determining the cause of the cardiovascular hyperexcitability manifest in hypertension is clinically important.
Exercise-induced autonomic changes in the cardiovascular system are mediated by the central command, the arterial baroreflex and the exercise pressor reflex (EPR; Refs. 4, 18, 19). Of these, recent evidence in both the animal and human literature suggests that the EPR contributes significantly to the abnormally accentuated circulatory response to exercise in hypertension (2, 22, 23, 38). Activation of the EPR, a reflex originating in skeletal muscle, is mediated by stimulation of mechanically sensitive receptors located primarily on group III afferent fibers and metabolically sensitive receptors located primarily on group IV afferent fibers (10, 11). In hypertension, combined or individual activation of either the mechanical (i.e., mechanoreflex) or metabolic component (i.e., metaboreflex) of the EPR results in a heightened sympathetically mediated cardiovascular response (2, 13, 22, 23, 34, 38). To date, however, the mechanisms underlying EPR overactivity in hypertension remain largely unknown.
The nucleus tractus solitarius (NTS) within the medulla oblongata of the brainstem is a central site of integration for sensory information from skeletal muscle afferents fibers (7, 26, 42). As evidence, anterograde tracing with biotinylated dextran amine of ascending neuronal projections from the spinal cord, to which skeletal muscle afferents contribute, has demonstrated that these fibers project to the NTS (30). In addition, electrical stimulation of the tibial nerve, in which group III and IV sensory afferents travel, has been shown to excite NTS neurons (40). Nitric oxide (NO), produced by nitric oxide synthases (NOS) such as neuronal NOS (nNOS), serves as a neuromodulator evoking or enhancing excitatory and inhibitory neuronal signaling within the brainstem (41). To this end, previous investigations have demonstrated that NO independently modulates EPR function within the NTS. In barodenervated cats in which the EPR was preferentially activated, increasing NO production in the NTS via microdialysis of the NO-precursor l-arginine significantly attenuated the pressor response to hindlimb muscle contraction (37). In a separate study, bilateral microdialysis of a nonselective NO inhibitor significantly enhanced the pressor response to hindlimb muscle contraction (15). These findings suggest that centrally produced NO buffers the pressor response to activation of the EPR. Given this role, it is plausible to suggest that the EPR overactivity that develops in hypertension results from the reduced production/availability of NO within the NTS. Unfortunately, due to the labile nature of NO in oxygenated solutions, it is rapidly oxidized and, therefore, difficult to measure in vivo (39). As a result, little is known with regard to the changes that occur in NO production within the NTS after the development of hypertension.
In contrast, quantification of NOS expression can be readily assessed in a number of tissues. As NOS is required to produce NO, a downregulation in NOS expression could potentially reduce NO within the NTS and in this manner contribute to EPR overactivity in hypertension. Thus we sought to determine whether nNOS expression is reduced within the areas of the NTS excited by the EPR in hypertensive rats. Areas within the NTS activated by the EPR have been previously identified with immunofluorescence of FOS, the protein product of the early response gene c-fos (16). Therefore, FOS expression is an accepted marker of neuronal activity induced by stimulation of the EPR. As such, the hypotheses investigated were 1) nNOS protein expression is lower in the NTS of hypertensive compared with normotensive rats, and 2) NTS neurons activated by the EPR (marked by FOS expression) are located in the same areas of the NTS as neurons containing nNOS.
MATERIALS AND METHODS
Ethical Approval and Subjects
All experimental procedures were performed in age-matched, male normotensive Wistar-Kyoto (WKY; n = 25) and spontaneously hypertensive (SHR; n = 22) rats ranging from 14 to 24 wk of age. Animal procedures performed in this investigation were approved by the Institutional Animal Care and Use Committee of the University of Texas Southwestern Medical Center at Dallas and conducted in accordance with the United States Department of Health and Human Services National Institutes of Health Guide for the Care and Use of Laboratory Animals.
General Surgical Procedures
The same surgical procedures were performed in all animals undergoing reflex testing. Animals were anesthetized with 2–3% isoflurane gas. The level of anesthesia was increased with the presence of a withdrawal reflex to pinching of the hindpaw. Dexamethasone (0.1 cc of 4 mg/ml) was injected intramuscularly to minimize the development of edema. An endotracheal tube was inserted into the airway for mechanical ventilation (Harvard Apparatus). A catheter (polyethylene tubing, PE-50) was inserted into both common carotid arteries and one external jugular vein for the measurement of was and administration of fluids, respectively. To maintain baseline ABP throughout the experimental protocol, a solution (2 ml 1 M NaHCO3 and 10 ml 5% dextrose in 38 ml Ringer solution) was continuously infused into the jugular vein. Body temperature was maintained between 36.5 and 38°C by an isothermal pad (Deltaphase). A laminectomy was performed exposing the lower lumbar portions of the spinal cord (L2-L6). The dura of the cord was cut and reflected. The L4 and L5 ventral roots were carefully separated and the peripheral ends were cut and positioned on an insulated bipolar platinum electrode (S88; Grass Instruments). The exposed neural tissue was covered in a pool of warm mineral oil (37°C). The animals were secured in a spinal frame, and the pelvis was stabilized with steel posts. The calcaneal bone of the right hindlimb was cut, and the Achilles' tendon sectioned and connected to a force transducer (FT10; Grass Instruments) for the measurement of muscle tension. The limb was fixed in one position using clamps attached to the tibial bone. Animals were placed into a stereotaxic head frame (Kopf), and a precollicular decerebration was conducted as previously described (36). Briefly, a bilateral craniotomy was performed and the portion of bone superior to the sagittal sinus was removed. The brain was sectioned immediately rostral to the superior colliculus, and the forebrain was aspirated rendering the animal insentient. At this point, gas anesthesia was discontinued. Oxidized regenerated cellulose was placed around the remaining brain tissue to minimize hemorrhage and the cranial cavity was packed with cotton. Animals recovered from surgery for 1 h before beginning any experimental protocol to allow sufficient time for the effects of isoflurane anesthesia to completely dissipate and ABP to stabilize.
Protocol 1: Exercise Pressor Reflex Testing
Optimal FOS expression, a marker of neuron activity, is induced after 1 h of muscle reflex activation (14). Therefore, to quantify FOS expression induced by EPR stimulation, we continuously evoked skeletal muscle contraction in the hindlimb for 30 s followed by 30 s of muscle relaxation for a period of 1 h (SHR n = 6; WKY n = 10). The gastrocnemius and soleus muscles of the right hindlimb were contracted by electrical stimulation of the L4 and L5 ventral roots (constant current stimulation at 3 times motor threshold, pulse duration of 0.1 ms at 40 Hz). Throughout the hour-long protocol, the level of constant current was continually adjusted to maintain the stimulation at three times motor threshold. This procedure allowed simultaneous activation of group III and group IV mechanically and metabolically sensitive skeletal muscle afferent fibers as previously described (36). In addition to the experimental groups, these surgical procedures were also performed in sham groups of rats (WKY n = 2; SHR n = 2) as a control. In these animals, the isolated ventral roots were not electrically stimulated allowing quantification of basal FOS expression induced by surgical preparation.
Protocol 2: Mechanoreflex Testing
In a set of complementary experiments, mechanoreflex-induced FOS expression was likewise assessed. The rationale for these additional experiments was that 1) stimulation of mechanically sensitive afferent fibers can be readily induced by stretching skeletal muscle lending itself to a 30-s “stimulation/relaxation” protocol, and 2) the mechanoreflex component of the EPR has recently been shown to be dysfunctional in hypertension, producing elevated increases in ABP and sympathetic nerve activity (13, 23). In a separate group of animals (WKY n = 10; SHR n = 11) than those in which muscle contraction was evoked, mechanically sensitive afferent fibers were preferentially stimulated by passively stretching the soleus and gastrocnemius muscles of the right hindlimb using a calibrated 9.5-mm rack and pinion system (Harvard Apparatus). These hindlimb muscles were passively stretched to 1,200 g of tension for 30 s followed by 30 s of relaxation over a period of 1 h.
Immunohistochemistry
c-fos Gene expression is induced within 30 min following neuronal activation, and FOS (the protein product) reaches maximal expression 60–90 min thereafter (35). Therefore, following stimulation of the EPR or mechanoreflex, animals rested for 1 h to ensure maximal FOS expression. Subsequently, rats were transcardially perfused with saline followed by 4% paraformaldehyde for tissue fixation. The brainstem was harvested and stored overnight in 20% sucrose. With the use of visual markers (e.g., 4th ventricle, calamus scriptorius), the tissue was sectioned 1 mm rostral to 1 mm caudal from the calamus scriptorius and blocked. The tissue was then serially cut into 35-μm sections using a cryostat (2800 Frigocut; Reichert-Jung) and stored in cryoprotectant at −20°C. Tissue sections were rinsed in PBS (pH 7.4) and then incubated in 10% normal goat serum/PBS-TX for 1 h at room temperature followed by an overnight incubation at room temperature with primary antibodies raised against rabbit-anti-FOS (1:3,00; SC-52; Santa Cruz Biotechnology) and mouse-anti-nNOS (1:250; SC-5302; Santa Cruz Biotechnology). On day 2, the sections were rinsed in PBS and subsequently incubated in the FOS secondary IgG antibody goat-anti-rabbit Cy2 (1:500; 111–225-144; Jackson ImmunoResearch) and nNOS secondary IgG antibody goat-anti-mouse Cy3 (1:500; 115–165-146; Jackson ImmunoResearch) for 1 h at room temperature. Tissue sections were then rinsed with PBS and mounted on a slide with Immu-mount (Thermo Shandon). WKY and SHR tissue sample batches were stained in parallel to ensure any differences in protein expression were not due to pipette error, pH changes, or other variables. Negative control experiments were performed to ensure the specificity of the antibodies.
Analysis of Tissue Sections
Tissue sections were initially examined with a Zeiss standard microscope (Axio Imager A2) equipped for reflected fluorescence. Fluorophores were visualized independently using a selective filter, and the number of cells positively was stained for FOS and nNOS within the NTS (excluding the commissural NTS) were counted (ImageJ; National Institutes of Health). Beginning at 1 mm caudal to the calamus scriptorius (−15.4 bregma) and ending at 1 mm rostral to the calamus scriptorius (−13.4 bregma), the cells counted in three consecutive tissue sections were averaged to represent one group of cells. All sections from one animal were treated as a single sample. Only cells with visible nuclei were included in the analysis. FOS protein expression is localized to the nucleus. Thus cells in which FOS staining was present in the nucleus were considered positive. In contrast, nNOS protein is localized to the cytosol. As such, cells in which nNOS staining was present in the cytosol were considered positive. However, fluorescent microscopy alone cannot distinguish between the colocalization of proteins or overlapping fluorescence from separate cells. Therefore, in one representative WKY and one representative SHR, fluorophores of nNOS and FOS were examined simultaneously using a laser-scanning confocal microscope (Zeiss 510; Zeiss, Oberkochen, Germany) to determine whether the proteins were colocalized within the same NTS neurons. Protein expression within the same orthogonal axis (X-Y, X-Z, and Y-Z planes) confirms that the fluoresced proteins are located within the same cellular dimensions of the tissue slice. A series of optical sections (4-μm thickness) were collected, rendered, and processed with LSM Image Browser (National Institutes of Health). The brightness and contrast of the immunofluorescence figures were adjusted using Adobe Photoshop CS3 Extended 10.0 Software (Adobe Systems, San Jose, CA).
Western Blot Analysis
Immunoblot analysis was performed utilizing methods previously described (24, 43) with slight modification. WKY (n = 3) and SHR (n = 3) were anesthetized with 50 mg/kg pentobarbital (Nembutal) and decapitated. The brain was subsequently harvested and flash frozen in liquid nitrogen. With the use of a brain matrix (ASI Instruments), 1-mm thick coronal slices of the brain stem were generated using razor blades. Slices corresponding to those used for immunohistochemical analysis of the NTS were identified (i.e., −13.4 to −15.4 bregma). The NTS was punched from the slices using a blunt 19-gauge needle (Hamilton). Frozen NTS tissue was solubilized in Laemmli buffer (60 μl, 62.5 mM Tris-Cl, 2% SDS, 160 mM dithiothreitol, 0.001% bromophenol blue, and 6 M urea pH 6.8). Subsequently, 20 μl were loaded on a 10% acyrlmide SDS gel (Bio-Rad) and electrophoresed under denaturing conditions and transferred to a polyvinlyidene difluoride membrane in a buffering solution (0.7 glycine and 25 mM Tris base). Membranes were blocked for 1 h with 5% nonfat milk in Tris-buffered saline-Tween 20 (TBS-Tween, 50 mM Tris base, 200 mM NaCl, and 0.1% Tween 20). Next, at room temperature, membranes were incubated overnight with primary mouse antibody against nNOS (1:100; Santa Cruz Biotechnology). Blots were then rinsed three times with TBS-Tween and incubated at room temperature for 1 h in horseradish-peroxidase-conjugated goat-anti-mouse secondary antibody (1:10,000; Santa Cruz Biotechnology). Resultant immunoreactive bands were detected by enhanced chemiluminescence (Thermo Scientific) and captured digitally. The bands of interest were analyzed using densitometry functions of the ImageJ software suite (National Institutes of Health). Glyceraldehyde-3-phosphate dehydrogenase (GAPDH) analysis was likewise performed. This required that all blots be reblocked for 1 h at room temperature and incubated overnight with a primary antibody against GAPDH (1:96,000; Santa Cruz Biotechnology).
Analysis of Immunoblots
Digitized images of Western blots were analyzed using ImageJ software (National Institutes of Health). A semiquantitative analysis of nNOS protein expression was determined by measuring the density of the nNOS bands. To control for differences in protein loading, GAPDH was used as an internal standard. Data are expressed as relative nNOS densitometric units normalized to GAPDH.
Data Acquisition and Statistical Analysis
ABP was measured by connecting the arterial catheter to a pressure transducer (ADInstruments). MAP was obtained by integrating the arterial pressure signal with a time constant of 1–4 s. HR was measured using a standard three-lead electrocardiogram (ADInstruments). Hindlimb tension was quantified using a force transducer (FT-10; Grass Instruments). Baseline values for all variables were determined by analyzing 30 s of data a minimum of 1 h postdecerebration before muscle reflex activation. The peak response of each variable was defined as the greatest change from baseline elicited by the experimental stimulus. These peak responses were grouped and averaged in 5-min bins over the 1-h protocol. All data were collected, recorded, and analyzed using commercially available software (PowerLab; ADInstruments). Statistical analyses between and within animal groups were performed using a two-way mixed design ANOVA with a Student-Newman-Keuls post hoc test employed when appropriate. A Student's t-test was used for statistical analysis of Western blot data. Results are presented as means ± SE. The level of significance was set at P < 0.05. Statistical analyses were conducted using SigmaStat Software (SPSS; Jandel Scientific Software).
RESULTS
Baseline MAP was greater in decerebrate SHR (110 ± 12; n = 19) compared with WKY (78 ± 9; n = 22) rats (P = 0.02). Baseline HR was not significantly different between the two groups (SHR = 463 ± 19; WKY = 412 ± 27). In addition, body weight was not different between SHR (339 ± 7) and WKY (331 ± 6).
Physiological Response to EPR Activation
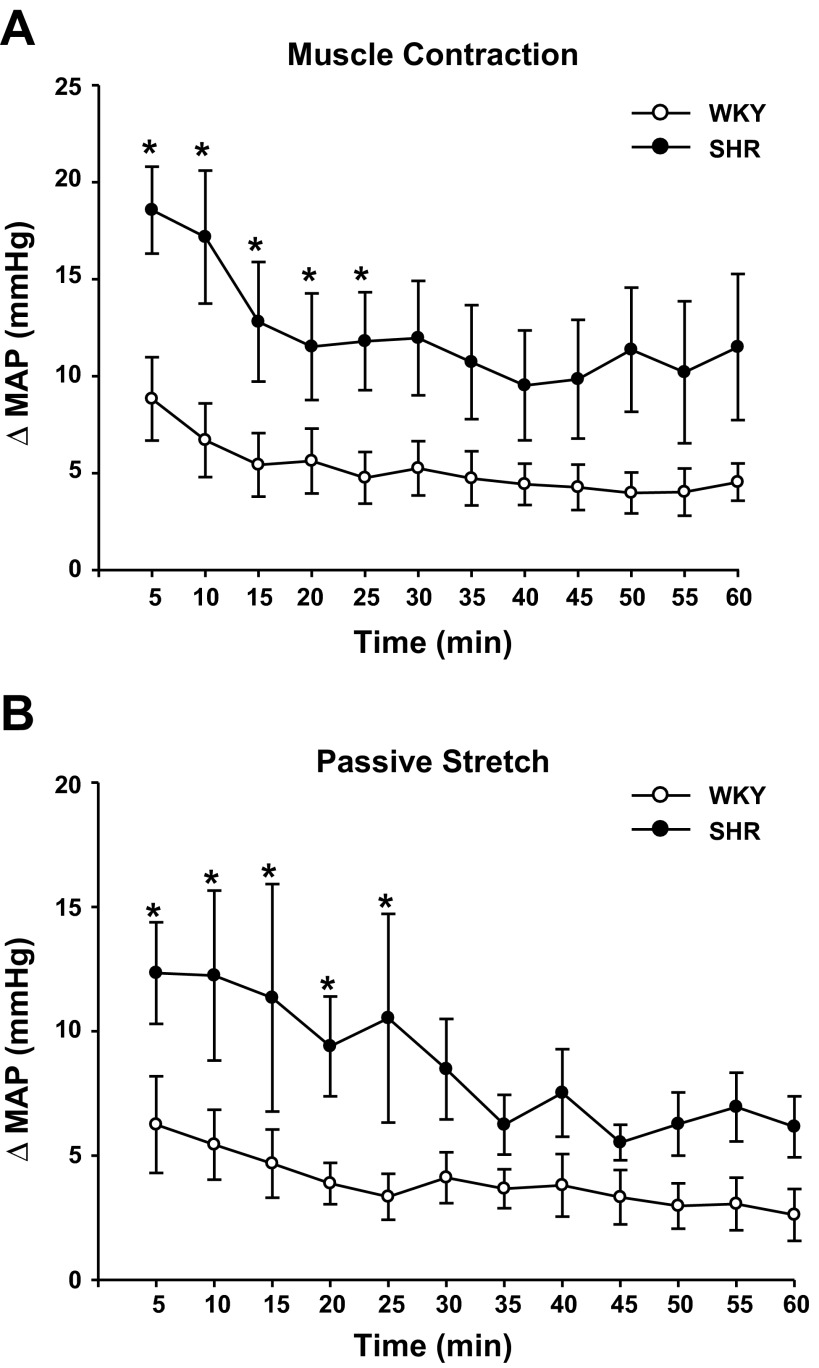
Congruent with previous reports (38), electrically induced hindlimb contraction elicited an exaggerated pressor response in SHR animals compared with WKY. As shown in Fig. 1A, SHR had a significantly greater increase in MAP during the first 25 min of the 1-h exercise protocol compared with WKY (P = 0.02). For example, the average change in MAP in response to contraction during the first 5 min of exercise was 19 ± 2 mmHg in SHR compared with 12 ± 3 mmHg in WKY (P < 0.05). The pressor response to contraction gradually declined over time in both WKY and SHR. The average change in MAP during the first 5 min of electrically stimulated hindlimb contraction was larger in WKY compared with the following 55 min of exercise (P < 0.001). In SHR, the average change in MAP during contractions developed during the first 5 and 10 min of exercise was significantly greater than the following 50 min of exercise (P < 0.001). The HR response to contraction was not significantly different between WKY and SHR at any point during the exercise protocol. For example, during the first 5 min of exercise the average change in HR with each contraction in WKY and SHR was 8 ± 3 and 11 ± 3 beats/min, respectively. In addition, electrically induced hindlimb contraction elicited an average peak tension development that was not different between WKY and SHR at any time point. The average peak tension developed in the first 5 min of exercise was 903 ± 127 g in SHR and 862 ± 111 g in WKY. However, as exercise proceeded, there was an overall decrement in peak tension development. At 30 min of exercise peak, tension development was reduced by 49% in SHR and 64% in WKY, while at 60 min of exercise peak tension was reduced by 80% in SHR and 86% in WKY. There was a significant reduction in peak tension development among 5, 10, 15, and 20 min of exercise compared with the last 25 min of exercise in WKY and SHR (P < 0.001). The decay in peak tension development was most likely due to muscle fatigue. Importantly, in both groups of animals, a pressor response was observed throughout the entire exercise protocol.
Fig. 1.
Blood pressure responses during 1 h of exercise pressor reflex (EPR) or mechanoreflex activation in Wistar-Kyoto (WKY) and spontaneously hypertensive (SHR). A: SHR (●; n = 6) exhibited a greater change in mean arterial pressure (MAP) during 1 h of the “stimulation/relaxation” muscle contraction protocol compared with normotensive WKY (○; n = 10). B: passive stretch of the hindlimb also elicited a significantly larger change in MAP in SHR (n = 11) compared with WKY (n = 10). *Significance from WKY (P < 0.05).
Physiological Response to Activation of the Mechanoreflex
In agreement with previous findings (13, 23), the pressor response to passive stretch of the hindlimb was greater in SHR compared with WKY throughout the 1-h protocol, significantly so during the first 25 min. (Fig. 1B). For example, the average change in MAP in the first 5 min of exercise was 7 ± 2 mmHg in WKY and 12 ± 2 mmHg in SHR (P = 0.01). The HR response to passive stretch was not significantly different in WKY compared with SHR. The average change in HR through the first 5 min of passive stretch was 3 ± 1 in WKY and 5 ± 1 in SHR. Tension was manually manipulated and remained consistent throughout the experiment. The average tension developed in the first 5 min was 1,298 ± 41 g in WKY and 1,343 ± 28 g in SHR, which was no different from the tension generated in the last 5 min (e.g., 60-min time point), which was 1,288 ± 25 g in WKY and 1,338 ± 36 g in SHR.
nNOS Expression in WKY and SHR
Immunohistochemical findings.
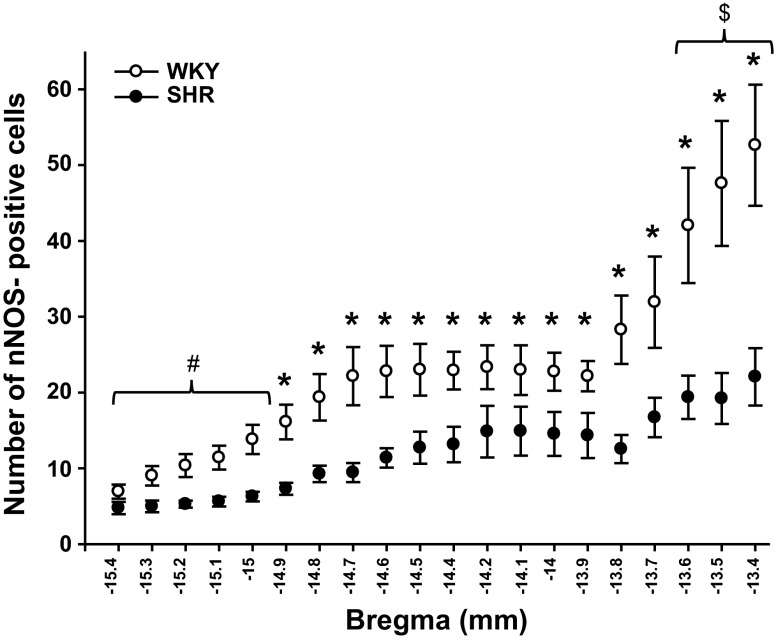
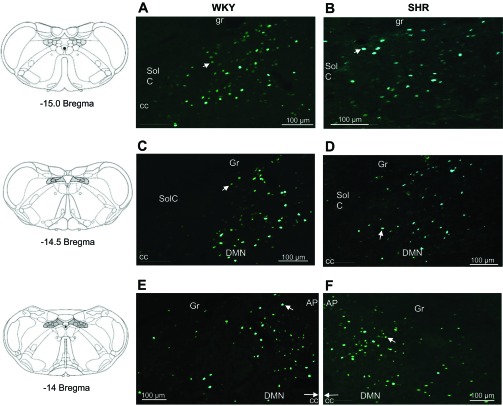
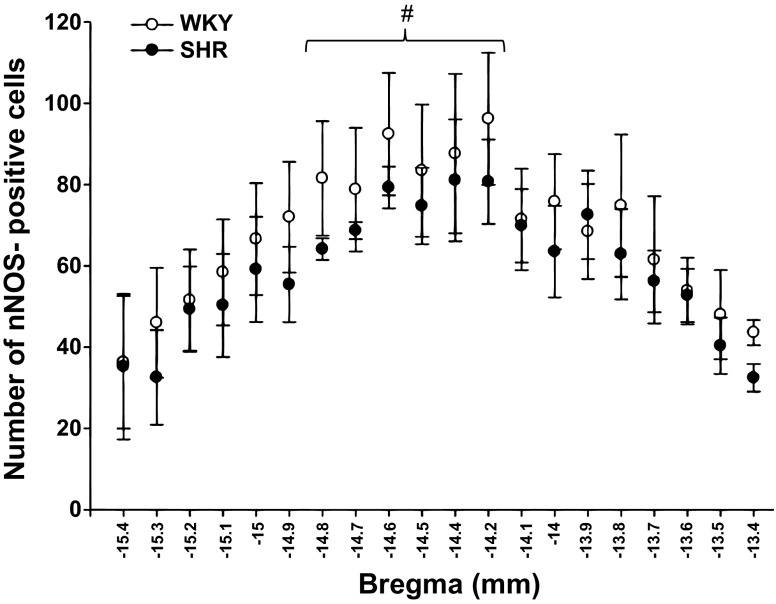
nNOS protein expression was observed throughout the NTS from −15.4 to −13.4 bregma in both WKY and SHR (Fig. 2). nNOS expression within WKY testing groups (i.e., EPR testing vs. mechanoreflex testing) were not different (P > 0.05). Likewise, nNOS expression within SHR testing groups were similar. This was expected as nNOS protein is constitutively expressed within the neuronal cells of the NTS in both WKY and SHR and is not affected by acute activation of skeletal muscle reflexes. As such, data within each group was pooled for analysis independent of testing procedure. In contrast, statistically significant differences between groups were present. Specifically, at −14.9 to −13.4 bregma, SHR animals had significantly fewer neurons expressing nNOS compared with WKY (P = 0.002; Fig. 3). In addition, nNOS protein expression was different between the separate coordinates of the NTS in WKY and SHR (P < 0.001). In both groups of animals, nNOS expression was significantly greater at −13.4, −13.5, and −13.6 bregma (the more rostral portions of the NTS) compared with all other coordinates. In the tissue sections from −13.9 to −14.8 bregma there were a greater number of neurons expressing nNOS compared with the more caudal portions of the NTS (−15.0 to −15.4 bregma).
Fig. 2.
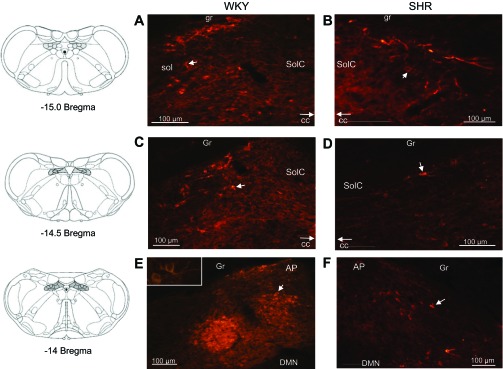
Photomicrographs (×10) of neuronal nitric oxide synthase (nNOS) protein expression within the nucleus tractus solitarius (NTS) in WKY and SHR. A,C, and E: nNOS expression within the NTS of a representative WKY animal at −15.0, −14.5, and −14.0 bregma, respectively. B, D, and F: nNOS expression in a representative SHR animal at −15.0, −14.5, and −14.0 bregma, respectively. Arrow demarcates a neuron positive for nNOS expression. Solid bar = 100 μm. E, inset: ×40. More nNOS was expressed within the NTS of WKY compared with SHR. Coronal brainstem schematics were modified from Paxinos and Watson (25). The following abbreviations were used to identify the areas surrounding the NTS regions of interest: gracile fasciculus (gr), solitary tract, (sol), commissural nucleus of the solitary tract (SolC), gracile nucleus (Gr), area postrema (AP), dorsal motor nucleus of the vagus (DMN), and central canal (CC).
Fig. 3.
Number of cells expressing nNOS within the NTS of WKY and SHR. The number of neurons positive for nNOS protein expression within the NTS was greater in WKY (○; n = 11) compared with SHR (●; n = 11). In both animal groups, nNOS expression was significantly greater at −13.4, −13.5, and −13.6 bregma compared with all other coordinates. Additionally, there were significantly fewer neurons expressing nNOS in the more caudal regions of the NTS (−13.9 to −14.8 bregma) *P < 0.05, significance from SHR. $P < 0.05, significance from all other coordinates in both groups. #P < 0.05, significance from coordinates from −14.9 to −13.4 bregma in both groups.
Western blot findings.
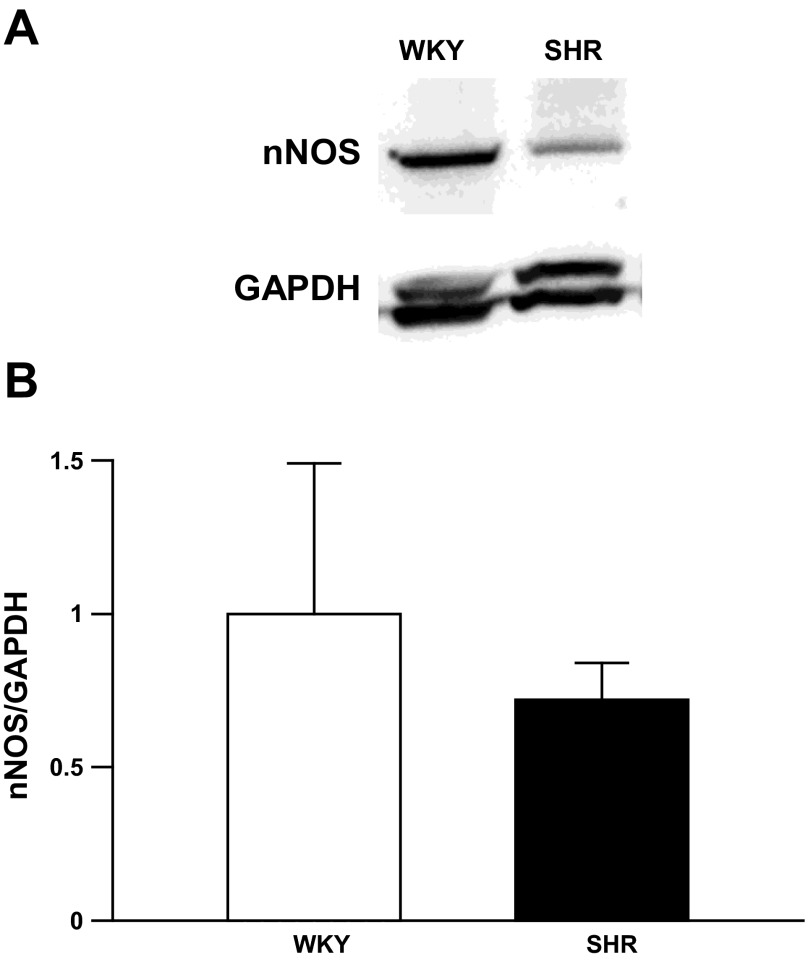
Analysis of immunoblots demonstrated that NTS nNOS protein levels appeared to be less in SHR compared with WKY (Fig. 4). However, the difference between groups did not reach statistical significance. It should be noted that the antibody used to assess GAPDH in our studies did not differentiate between the two isoforms of the protein known to be expressed in rats. Therefore, two GAPDH bands were detected during Western blot analysis.
Fig. 4.
Western blot analysis of nNOS protein expression in the NTS of WKY and SHR. A: immunoblot demonstrating nNOS and GAPDH protein expression in NTS tissue from 1 normotensive and 1 hypertensive rat pair. B: group nNOS protein expression from WKY (n = 3) and SHR (n = 3) normalized to GAPDH.
FOS Expression in Response to EPR Activation
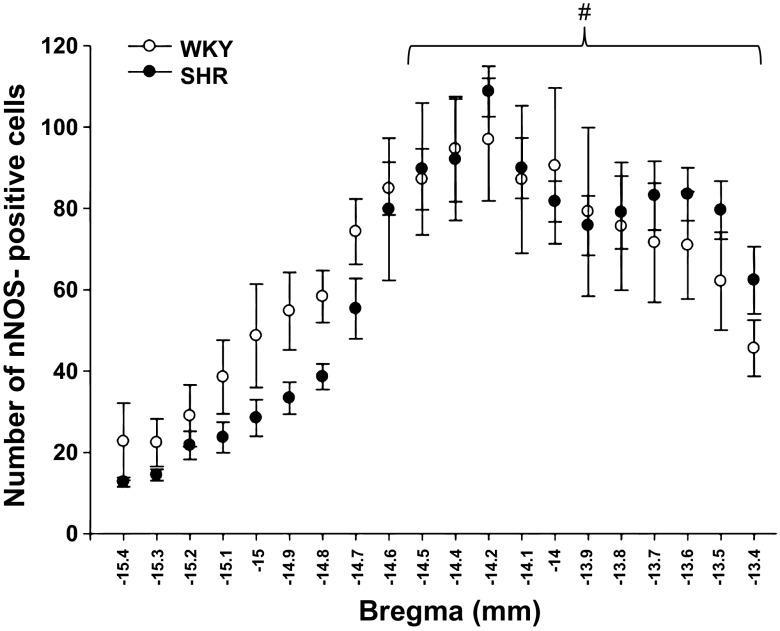
One hour of intermittent electrically induced static hindlimb muscle contraction generated FOS expression throughout the NTS in WKY and SHR animals (Fig. 5). A small amount of FOS expression was elicited in sham control animals that underwent surgical procedures only but to a far lesser extent than that observed in the experimental groups (Fig. 6). Specifically, at −14.5 bregma there was significantly less FOS expression in sham animals compared with the experimental group (28 ± 14 and 79 ± 8, respectively; P < 0.001). There was no difference in the number of cells expressing FOS protein within the NTS of WKY compared with SHR (Fig. 7). However, FOS expression was significantly different between NTS coordinates (P < 0.001). Specifically, there were fewer FOS-expressing neurons present at coordinates −15.4 and −15.3 bregma compared with coordinates from −14.8 to −14.2 bregma.
Fig. 5.
Photomicrographs (×10) of EPR-induced FOS protein expression within the NTS in WKY and SHR. A, C, and E: FOS expression in response to EPR activation within the NTS of a representative WKY animal at −15.0, −14.5, and −14.0 bregma, respectively. B, D, and F: FOS expression in a representative SHR animal at −15.0, −14.5, and −14.0 bregma, respectively. Arrow demarcates a neuron positive for FOS expression. Solid bar = 100 μm. Reflex induced FOS expression was not different within the NTS of WKY and SHR. Coronal brainstem schematics were modified from Paxinos and Watson (25).
Fig. 6.
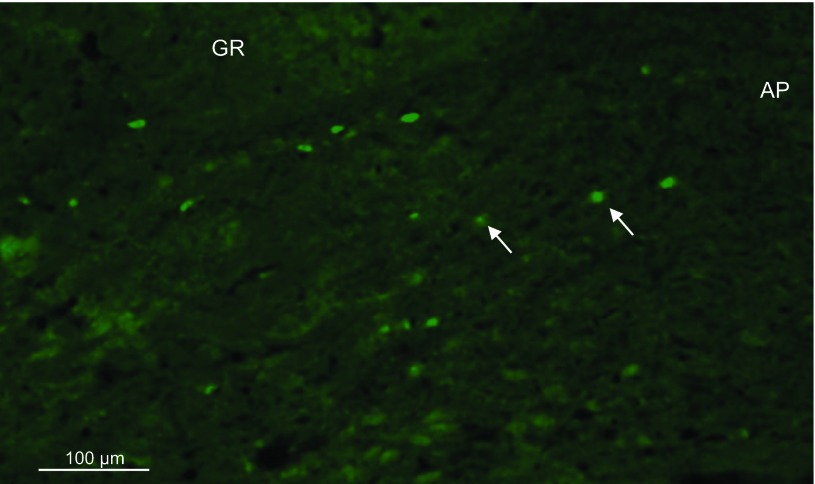
Photomicrograph (×10) of FOS protein expression within the NTS in a sham SHR animal. FOS protein expression at −14.0 bregma in a representative sham SHR animal. In sham animals, all surgical procedures were performed but the lumbar ventral roots were not electrically stimulated. FOS expression was significantly lower in sham animals compared with SHR animals in which the EPR was activated. Arrow demarcates a neuron positive for FOS expression. Solid bar = 100 μm.
Fig. 7.
Number of cells expressing FOS protein within the NTS after activation of the EPR in WKY and SHR. Intermittent stimulation of the EPR for 1 h induced FOS expression in NTS neurons in both WKY (○; n = 10) and SHR (●; n = 6). FOS expression throughout the NTS was not different between these groups of rats. #P < 0.001, significance from coordinates −15.4 to −15.3 bregma.
FOS Expression in Response to Mechanoreflex Activation
Intermittingly stretching hindlimb skeletal muscle for 1 h generated FOS expression throughout the NTS in WKY and SHR animals (Fig. 8). Within the NTS, FOS expression was not different between WKY and SHR. However, as with the response to muscle contraction, passive stretch induced a larger amount of FOS expression within the nuclei of the NTS from −14.5 to −13.4 bregma compared with more caudal coordinates of the NTS (P < 0.001). Specifically, the least amount of FOS expression was observed at −15.4 bregma and gradually increased to −15.1 bregma. The largest amount of FOS expression was observed from −14.5 to −14.1 bregma.
Fig. 8.
Number of cells expressing FOS protein within the NTS after activation of the mechanoreflex in WKY and SHR. Intermittent stimulation of the muscle mechanoreflex for 1 h induced FOS expression in NTS neurons in both WKY (○; n = 10) and SHR (●; n = 10). FOS expression throughout the NTS was not different between these groups of rats. #P < 0.001, significance from coordinates −15.4 to −15.2 bregma.
Colocalization of FOS and nNOS in the NTS
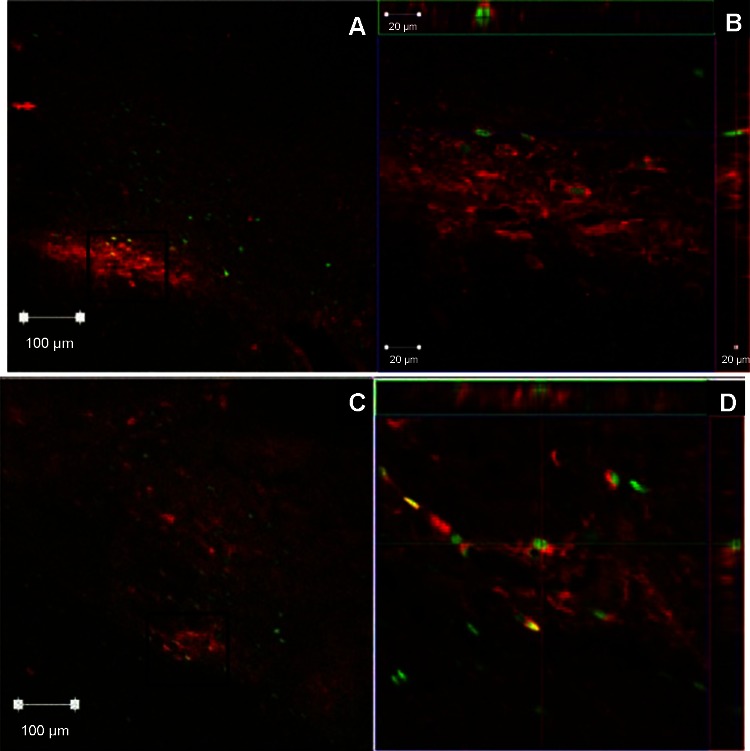
FOS and nNOS expression was observed in one representative WKY and one SHR using confocal microscopy to determine whether the two proteins were colocalized within the same neurons. Figure 9 demonstrates FOS and nNOS proteins were both expressed within the NTS of WKY and SHR. At ×10 magnification (Fig. 9, A and C), it is evident that many neurons in which FOS expression was induced are in the same area as neurons that constitutively expressed nNOS. At ×63 magnification (Fig. 9, B and D), it is apparent that a small number of neurons in the NTS that constitutively expressed nNOS protein also expressed FOS protein after 1 h of EPR activation as both proteins are located on the same x and y axis of the tissue section. The presence of both proteins along the same orthogonal axis (Fig. 9D) demonstrates that each protein is present within the same cellular structure. Therefore, the NO-producing protein nNOS was located in the same area as or within the same neurons that were excited by activation of skeletal muscle reflexes.
Fig. 9.
Colocalization of nNOS and FOS protein expression after EPR activation within the NTS of representative WKY and SHR animals. Within the NTS at −14.4 bregma, nNOS protein was colocalized with, or in the same area as, neurons expressing FOS after 1 h of intermittent EPR activation. A: in a representative WKY animal it is apparent that at ×10 magnification neurons expressing FOS and nNOS are located in the same area. Black box in A denotes the area represented in B. B: orthogonal view of the confocal microscopy images at ×63 magnification. It is clear there is colocalization of FOS and nNOS within the same NTS neuron. C: in a representative SHR animal it is also apparent that at ×10 magnification FOS and nNOS are located in the same area. Black box in C denotes the area represented in D. D: orthogonal view of the confocal microscopy images at ×63 magnification demonstrates colocalization of FOS and nNOS within the same NTS neuron in an SHR animal.
DISCUSSION
To date, the mechanisms underlying EPR dysfunction in hypertension remain relatively unknown. The findings of the present investigation address this gap in knowledge having identified a potential mechanism by which the central integration of EPR afferent signals may be altered in hypertension. The major new findings from the study were 1) throughout the NTS, nNOS protein expression, as assessed by immunohistochemical methods, was lower in SHR compared with WKY; and 2) in both WKY and SHR, regardless of the density of nNOS expression, the majority of nNOS protein within the NTS was within or in the same area as neurons excited by skeletal muscle reflexes. This latter finding suggests that nNOS maintains the potential to directly affect the function of NTS neurons excited by skeletal muscle reflex input. Collectively, given that NOS is important for NO production and NO normally buffers the pressor response to muscle reflex stimulation, these findings support the contention that EPR overactivity manifests in hypertension, in part, as a result of a reduction in nNOS protein expression within the NTS. Another new finding from this investigation was that prolonged (e.g., up to 25 min) intermittent activation of the EPR and mechanoreflex elicited exaggerated pressor responses in SHR compared with WKY similar to those demonstrated previously with more acute bouts of reflex stimulation (13, 23, 38). These findings suggest, for the first time, that the abnormally large pressor response to muscle reflex activation can be sustained over a relatively long period and should be taken into consideration when performing repetitious forms of exercise after the development of hypertension.
The three isoforms of NOS (i.e., nNOS, endothelial NOS, and inducible NOS) are known to be expressed within the NTS (1). As such, a reduction in each or all of these isoforms could potentially effect NO production and thus EPR activity in hypertension. As stated previously, increasing NO production within the NTS of normotensive cats via the dialysis of l-arginine has been shown to attenuate the pressor response to EPR activation (37). Importantly, this l-arginine-induced attenuation in EPR function was also demonstrated to be prevented by the administration of a nNOS inhibitor. These findings suggest that nNOS is important to the generation of NO within the NTS and EPR activity can be modulated via this pathway. Further, it has been recently demonstrated in normotensive rats that antagonizing NOS activity using the nonselective inhibitor NG-nitro-l-arginine methyl ester recapitulates the abnormal pressor response to mechanoreflex activation characteristic of hypertensive animals (12). This finding supports the concept that reductions in NO production within the NTS contribute to the generation of abnormal blood pressure control by skeletal muscle reflexes. For this reason, nNOS protein expression was targeted in the current study. Previous investigations have sought to quantify nNOS mRNA levels, protein expression, or activity within the brainstem of normotensive and hypertensive rats. However, these studies have yielded conflicting results and no investigation to date has measured nNOS expression throughout the entire NTS (3, 28, 29, 31). To this end, our results suggest that nNOS protein expression is lower throughout a large portion of the NTS in SHR (−14.8 to −13.4 bregma), specifically in coordinates concomitantly excited by skeletal muscle reflexes as observed via FOS expression. In contrast, at a more rostral coordinate of the NTS (−13.30 bregma), Ferrari and Fior-Chadi (3) determined that nNOS protein expression was increased in SHR from 15 days postnatal to 12 mo of age in the central NTS while, in the medial NTS, nNOS protein expression increased in SHR up to 4 mo of age but then declined to levels not significantly different from WKY from 4–12 mo of age. Interestingly, nNOS mRNA expression did not change throughout the lifespan. In our investigation, however, this coordinate of the NTS (−13.3 bregma) was not observed to express much FOS after EPR or mechanoreflex activation (data not shown). In fact, at this coordinate within the NTS FOS was not present in the same areas as neurons expressing nNOS. This suggests that NTS coordinates more caudal to −13.3 bregma are essential for the central processing of muscle reflex sensory information. Therefore, nNOS expression within these coordinates provides a better understanding of the possible effects of NO production (or lack thereof) on neurons excited by the EPR and mechanoreflex.
Although this study suggests that nNOS protein expression was lower within the NTS of SHR compared with WKY using immunohistochemical techniques corollary densitometric analysis of nNOS Western blots demonstrated that, while expression appeared lower in hypertensive animals, the differences between groups was not statistically significant. The reason for this discrepancy is not clear but may be due to the fact that the latter analysis included NTS tissue harvested from −13.4 to −15.4 bregma. This was necessary to obtain sufficient tissue samples for robust immunoblotting as well as to match the NTS area investigated immunohistochemically. Thus portions of the NTS not demonstrating differences in nNOS expression between WKY and SHR by immunohistochemical analysis (i.e., −15.0 to −15.4 bregma) may have led to an underestimation of the difference in nNOS protein levels between the two groups. Regardless, it is worthy to note that nNOS expression is not necessarily indicative of nNOS activity. Pontieri et al. (29) demonstrated that basal constitutive NOS activity is significantly depressed in SHR compared with WKY. They further determined that the reduction in NOS activity in SHR was not due to a lack of substrate but hypothesized that it was instead due to a reduction in nNOS protein expression or an uncoupling of nNOS protein. As demonstrated in this investigation, nNOS protein expression appears to be reduced in the NTS likely resulting in a reduction in nNOS activity. As such, this provides a plausible mechanism by which the pressor response to EPR stimulation is dysfunctional in hypertension.
As previously mentioned, the protein product FOS of the early response gene c-fos has been commonly used to label neurons activated under various conditions such as hypotension and exercise (8, 14, 16, 17, 33). For example, Li et al. (14) have previously used this technique to quantify the number of neurons excited by EPR activation in normotensive cats demonstrating FOS expression within the NTS at 0.6 mm caudal and 0.6 mm rostral to the calamus scriptorius. Expanding this approach to include hypertensive animals, the current investigation determined that there was no significant difference in EPR-induced FOS expression in SHR compared with WKY throughout the NTS. Similar results were obtained when activating neurons via stimulation of the muscle mechanoreflex. Collectively, these data demonstrate that selectively activating mechanically sensitive afferent fibers (i.e., mechanoreflex) as well as the combined activation of mechanically and metabolically sensitive afferent fibers (i.e., EPR) excites a similar number of neurons in the NTS of WKY and SHR. Speculatively, such findings suggest that skeletal muscle afferent input to the NTS is not different between the groups lending support to the hypothesis that alterations in the central integration of this afferent information is largely responsible for the abnormal pressor response observed during exercise in hypertension.
Study Limitations
Several limitations to this investigation are acknowledged. First, NO production was not quantified. As a result, it is not possible to discern whether the decrease in nNOS expression within the NTS of SHR translates into a reduction in NO availability. NO production was not quantified largely due to the difficulty in accurately assessing its production in vivo. This being said, the findings of the current investigation provide the impetus to pursue such studies in the future. Second, we were only able to obtain confocal images from one WKY and one SHR in our attempt to establish colocalization of FOS and nNOS within the same NTS neurons. As a result, extensive quantification of the percentage of FOS-positive cells that contained nNOS, and vice versa, was not possible. Additional studies designed to make such quantifications in NTS subregions known to receive afferent projections from skeletal muscle are warranted. A third limitation was that the arterial baroreflex remained intact during all experimental procedures. Afferent neurons from the baroreflex also terminate in the NTS. Therefore, it is likely that some of the neurons expressing FOS were excited by baroreflex stimulation as opposed to activation by skeletal muscle afferent fibers. To minimize this risk, we excluded neurons from the commissural NTS as baroreflex afferent neurons project primarily to caudal portions of the commissural and medial NTS whereas skeletal muscle afferents project chiefly to the medial and lateral nuclei throughout the caudal and rostral portions of the NTS (5, 14, 16). In addition, Li et al. (16) have previously compared EPR-induced FOS expression in barodenervated and barointact cats, demonstrating that the former produced only slightly less FOS than the latter. Fourth, in an attempt to match the average level of tension development generated during muscle contraction in previously published reports, tension developed during stretch maneuvers was considerably large. In addition to stimulating mechanically sensitive afferent fibers, the levels of tension generated during stretch may have also activated receptors responsive to noxious stimuli (i.e., nociceptors). As such, it is possible that the pressor responses elicited and the FOS expression induced in the NTS during stretch may have been due, in part, to the activation of afferent fibers responsive to pain. A fifth limitation was that expression of the endothelial and inducible isoforms of NOS was not assessed. It is possible that alterations in the expression of either of these isoforms of NOS could likewise affect EPR function in hypertension. Finally, other nuclei within the medulla important to the central processing of EPR afferent information, such as the rostral and caudal ventrolateral medulla, were not investigated and could prove to play an important role in the generation of EPR dysfunction in hypertension.
Summary
In conclusion, this investigation has demonstrated that the heightened pressor response to activation of the EPR, as well as its mechanical component, in hypertensive rats is not only present during acute reflex activation but can be maintained over a prolonged period of time. Importantly, nNOS protein expression appeared to be lower throughout the NTS in hypertensive compared with normotensive animals and likely contributes to the generation of the abnormal blood pressure response to physical activity. Further, in both SHR and WKY animals, nNOS was located within the same areas of the NTS or, in some cases, within the same neurons in the NTS excited by skeletal muscle reflexes. This is an important finding, as it suggests that NTS neurons receiving afferent reflex input may be directly influenced by nNOS activity. Given that NOS is requisite for the production of NO and NO normally modulates the reflex-induced increase in ABP in an inhibitory fashion, these findings support the hypothesis that muscle reflex overactivity is generated, at least in part, by a reduction in nNOS protein within the NTS. As the circulatory response to exercise is exaggerated in hypertension, the risk for the occurrence of a deleterious cardiovascular or cerebrovascular event during or immediately after a bout of exercise is increased. The findings of the current study aid in determining the mechanisms underlying this cardiovascular hyperexcitability and may lead to the development of effective treatments for reducing the risks inherent to exercise in this disease.
GRANTS
This research was supported by grants from the National Heart, Lung, and Blood Institute Grant HL-088422 (to S. A. Smith) and the Lawson and Rogers Lacy Research Fund in Cardiovascular Disease (to J. H. Mitchell).
DISCLOSURES
No conflicts of interest, financial or otherwise, are declared by the author(s).
AUTHOR CONTRIBUTIONS
Author contributions: M.N.M. and S.A.S. conception and design of research; M.N.M., J.J.S., and K.E.S. performed experiments; M.N.M., J.J.S., and K.E.S. analyzed data; M.N.M., M.M., and S.A.S. interpreted results of experiments; M.N.M. and R.M.D. prepared figures; M.N.M. drafted manuscript; M.N.M., M.M., and S.A.S. edited and revised manuscript; M.N.M., M.M., and S.A.S. approved final version of manuscript.
ACKNOWLEDGMENTS
We thank Dr. Mario Romero for intellectual and technical expertise, as well as Martha Romero and Julius Lamar, Jr. for invaluable technical assistance.
REFERENCES
- 1.Dawson T, Bredt D, Fotuhi M, Hwang P, Snyder S. Nitric oxide synthase and neuronal NADPH diaphorase are identified in brain and peripheral tissues. Proc Natl Acad Sci USA 88: 7797–7801, 1991 [DOI] [PMC free article] [PubMed] [Google Scholar]
- 2.Delaney EP, Greaney JL, Edwards DG, Rose WC, Fadel PJ, Farquhar WB. Exaggerated sympathetic and pressor responses to handgrip exercise in older hypertensive humans: role of the muscle metaboreflex. Am J Physiol Heart Circ Physiol 299: H1318–H1327, 2010 [DOI] [PMC free article] [PubMed] [Google Scholar]
- 3.Ferrari M, Fior-Chadi D. Differential expression of nNOS mRNA and protein in the nucleus tractus solitarii of young and aged Wistar-Kyoto and spontaneously hypertensive rats. J Hypertens 23: 1683–1690, 2005 [DOI] [PubMed] [Google Scholar]
- 4.Goodwin GM, McCloskey DI, Mitchell JH. Cardiovascular and respiratory responses to changes in central command during isometric exercise at constant muscle tension. J Physiol 226: 173–190, 1972 [DOI] [PMC free article] [PubMed] [Google Scholar]
- 5.Graham JC, Hoffman GE, Sved AF. c-Fos expression in brain in response to hypotension and hypertension in conscious rats. J Auton Nerv Syst 55: 92–104, 1995 [DOI] [PubMed] [Google Scholar]
- 6.Hoberg E, Schuler G, Kunze B, Obermoser A, Hauer K, Mautner H, Schlierf G, Kubler W. Silent myocardial ischemia as a potential link between lack of premonitoring sympotms and increased risk of cardiac arrest during physical stress. Am J Cardiol 65: 583–589, 1990 [DOI] [PubMed] [Google Scholar]
- 7.Iwamoto GA, Waldrop TG, Kaufman MP, Botterman BR, Rybicki KJ, Mitchell JH. Pressor reflex evoked by muscular contraction: contributions by neuraxis levels. J Appl Physiol 59: 459–467, 1985 [DOI] [PubMed] [Google Scholar]
- 8.Iwamoto GA, Wappel SM, Fox GM, Buetow KA, Waldrop TG. Identification of diencephalic and brainstem cardiorespiratory areas activated during exercise. Brain Res 726: 109–122, 1996 [PubMed] [Google Scholar]
- 9.Kahn JF. [The static exercise-induced arterial hypertension test]. Presse Med 20: 1067–1071, 1991 [PubMed] [Google Scholar]
- 10.Kaufman MP, Longhurst JC, Rybicki KJ, Wallach JH, Mitchell JH. Effects of static muscular contraction on impulse activity of groups III and IV afferents in cats. J Appl Physiol 55: 105–112, 1983 [DOI] [PubMed] [Google Scholar]
- 11.Kaufman MP, Rybicki KJ, Waldrop TG, Ordway GA. Effect of ischemia on responses of group III and IV afferents to contraction. J Appl Physiol 57: 644–650, 1984 [DOI] [PubMed] [Google Scholar]
- 12.Leal AK, Murphy MN, Iwamoto GA, Mitchell JH, Smith SA. A role for nitric oxide within the nucleus tractus solitarii in the development of muscle mechanoreflex dysfunction in hypertension. Exp Physiol 9712: 1292–1304, 2012 [DOI] [PMC free article] [PubMed] [Google Scholar]
- 13.Leal AK, Williams MA, Garry MG, Mitchell JH, Smith SA. Evidence for functional alterations in the skeletal muscle mechanoreflex and metaboreflex in hypertensive rats. Am J Physiol Heart Circ Physiol 295: H1429–H1438, 2008 [DOI] [PMC free article] [PubMed] [Google Scholar]
- 14.Li J, Hand GA, Potts JT, Wilson LB, Mitchell JH. c-Fos expression in the medulla induced by static muscle contraction in cats. Am J Physiol Heart Circ Physiol 272: H48–H56, 1997 [DOI] [PubMed] [Google Scholar]
- 15.Li J, Potts JT. NO formation in nucleus tractus solitarii attenuates pressor response evoked by skeletal muscle afferents. Am J Physiol Heart Circ Physiol 280: H2371–H2379, 2001 [DOI] [PubMed] [Google Scholar]
- 16.Li J, Potts JT, Mitchell JH. Effect of barodenervation on c-Fos expression in the medulla induced by static muscle contraction in cats. Am J Physiol Heart Circ Physiol 274: H901–H908, 1998 [DOI] [PubMed] [Google Scholar]
- 17.Li YW, Dampney RA. Expression of Fos-like protein in brain following sustained hypertension and hypotension in conscious rabbits. Neuroscience 61: 613–634, 1994 [DOI] [PubMed] [Google Scholar]
- 18.Mancia G, Mark A.(Editors). Arterial baroreflexes in humans. In: Handbook of Physiology. The Cardiovsacular System. Peripheral Circulation and Organ Blood Flow. Bethesda, MD: Am Physiol Soc, 1983, sect 2, vol III, p. 755–793 [Google Scholar]
- 19.McCloskey DI, Mitchell JH. Reflex cardiovascular and respiratory responses originating in exercising muscle. J Physiol 224: 173–186, 1972 [DOI] [PMC free article] [PubMed] [Google Scholar]
- 20.Mitchell JH. J. B. Wolffe memorial lecture. Neural control of the circulation during exercise. Med Sci Sports Exerc 22: 141–154, 1990 [PubMed] [Google Scholar]
- 21.Mittleman M, Maclure M, Tofler G, Sherwood J, Goldberg R, Muller J. Triggering of acute myocardial infarction by heavy physical exertion. N Engl J Med 329: 1677–1683, 1993 [DOI] [PubMed] [Google Scholar]
- 22.Mizuno M, Murphy MN, Mitchell JH, Smith SA. Antagonism of the TRPv1 receptor partially corrects muscle metaboreflex overactivity in spontaneously hypertensive rats. J Physiol 589: 6191–6204, 2011 [DOI] [PMC free article] [PubMed] [Google Scholar]
- 23.Mizuno M, Murphy MN, Mitchell JH, Smith SA. Skeletal muscle reflex-mediated changes in sympathetic nerve activity are abnormal in spontaneously hypertensive rats. Am J Physiol Heart Circ Physiol 300: H968–H977, 2011 [DOI] [PMC free article] [PubMed] [Google Scholar]
- 24.Mueller PJ, Foley CM, Heesch CM, Cunningham JT, Zheng H, Patel KP, Hasser EM. Increased nitric oxide synthase activity and expression in the hypothalamus of hindlimb unloaded rats. Brain Res 1115: 65–74, 2006 [DOI] [PubMed] [Google Scholar]
- 25.Paxinos G, Watson C. The Rat Brain in Stereotaxic Coordinates. London, UK: Elsevier, 2007 [DOI] [PubMed] [Google Scholar]
- 26.Person RJ. Somatic and vagal afferent convergence on solitary tract neurons in cat: electrophysiological characteristics. Neuroscience 30: 283–295, 1989 [DOI] [PubMed] [Google Scholar]
- 27.Pickering T. Pathophysiology of exercise hypertension. Herz 12: 119–124, 1987 [PubMed] [Google Scholar]
- 28.Plochocka-Zulinska D, Krukoff TL. Increased gene expression of neuronal nitric oxide synthase in brain of adult spontaneously hypertensive rats. Brain Res Mol Brain Res 48: 291–297, 1997 [DOI] [PubMed] [Google Scholar]
- 29.Pontieri V, Venezuela MK, Scavone C, Michelini LC. Role of endogenous nitric oxide in the nucleus tratus solitarii on baroreflex control of heart rate in spontaneously hypertensive rats. J Hypertens 16: 1993–1999, 1998 [DOI] [PubMed] [Google Scholar]
- 30.Potts JT, Lee SM, Anguelov PI. Tracing of projection neurons from the cervical dorsal horn to the medulla with the anterograde tracer biotinylated dextran amine. Auton Neurosci 98: 64–69, 2002 [DOI] [PubMed] [Google Scholar]
- 31.Qadri F, Arens T, Schwarz EC, Hauser W, Dendorfer A, Dominiak P. Brain nitric oxide synthase activity in spontaneously hypertensive rats during the development of hypertension. J Hypertens 21: 1687–1694, 2003 [DOI] [PubMed] [Google Scholar]
- 32.Rowell editor LB. Human Circulation: Regulation During Physical Stress. Oxford, UK: Oxford Univ Press, 1986, p. 213–256 [Google Scholar]
- 33.Ruggiero DA, Tong S, Anwar M, Gootman N, Gootman PM. Hypotension-induced expression of the c-fos gene in the medulla oblongata of piglets. Brain Res 706: 199–209, 1996 [DOI] [PubMed] [Google Scholar]
- 34.Sausen M, Delaney E, Stillabower M, Farquhar W. Enhanced metaboreflex sensitivity in hypertensive humans. Eur J Appl Physiol 105: 351–356, 2009 [DOI] [PubMed] [Google Scholar]
- 35.Sharp FR, Sagar SM, Hicks K, Lowenstein D, Hisanaga K. c-fos mRNA, Fos, and Fos-related antigen induction by hypertonic saline and stress. J Neurosci 11: 2321–2331, 1991 [DOI] [PMC free article] [PubMed] [Google Scholar]
- 36.Smith SA, Mitchell JH, Garry MG. Electrically induced static exercise elicits a pressor response in the decerebrate rat. J Physiol 537: 961–970, 2001 [DOI] [PMC free article] [PubMed] [Google Scholar]
- 37.Smith SA, Mitchell JH, Li J. Independent modification of baroreceptor and exercise pressor reflex function by nitric oxide in nucleus tractus solitarius. Am J Physiol Heart Circ Physiol 288: H2068–H2076, 2005 [DOI] [PubMed] [Google Scholar]
- 38.Smith SA, Williams MA, Leal AK, Mitchell JH, Garry MG. Exercise pressor reflex function is altered in spontaneously hypertensive rats. J Physiol 577: 1009–1020, 2006 [DOI] [PMC free article] [PubMed] [Google Scholar]
- 39.Stamler J, Singel D, Loscalzo J. Biochemistry of nitric oxide and its redox-activated forms. Science 258: 1898–1902, 1992 [DOI] [PubMed] [Google Scholar]
- 40.Toney GM, Mifflin SW. Time-dependent inhibition of hindlimb somatic afferent inputs to nucleus tractus solitarius. J Neurophysiol 72: 63–71, 1994 [DOI] [PubMed] [Google Scholar]
- 41.Wang S, Paton JF, Kasparov S. Differential sensitivity of excitatory and inhibitory synaptic transmission to modulation by nitric oxide in rat nucleus tractus solitarii. Exp Physiol 92: 371–382, 2007 [DOI] [PubMed] [Google Scholar]
- 42.Wilson LB, Andrew D, Craig AD. Activation of spinobulbar lamina I neurons by static muscle contraction. J Neurophysiol 87: 1641–1645, 2002 [DOI] [PubMed] [Google Scholar]
- 43.Zhang W, Carreno FR, Cunningham JT, Mifflin SW. Chronic sustained and intermittent hypoxia reduce function of ATP-sensitive potassium channels in nucleus of the solitary tract. Am J Physiol Regul Integr Comp Physiol 295: R1555–R1562, 2008 [DOI] [PMC free article] [PubMed] [Google Scholar]


