

Abstract
Humans have an amazing ability to quickly and efficiently recognize and interact with visual objects in their environment. The underlying neural processes supporting this ability have been mainly explored in the ventral visual stream. However, the dorsal stream has been proposed to play a critical role in guiding object-directed actions. This hypothesis is supported by recent neuroimaging studies that have identified object-selective and tool-related activity in human parietal cortex. In the present study, we sought to delineate tool-related information in the anterior portions of the human intraparietal sulcus (IPS) and relate it to recently identified motor-defined and topographic regions of interest (ROIs) using functional MRI in individual subjects. Consistent with previous reports, viewing pictures of tools compared with pictures of animals led to a higher blood oxygenation level-dependent (BOLD) response in the left anterior IPS. For every subject, this activation was located lateral, anterior, and inferior to topographic area IPS5 and lateral and inferior to a motor-defined human parietal grasp region (hPGR). In a separate experiment, subjects viewed pictures of tools, animals, graspable (non-tool) objects, and scrambled objects. An ROI-based time-course analysis showed that tools evoked a stronger BOLD response than animals throughout topographic regions of the left IPS. Additionally, graspable objects evoked stronger responses than animals, equal to responses to tools, in posterior regions and weaker responses than tools, equal to responses to animals, in anterior regions. Thus the left anterior tool-specific region may integrate visual information encoding graspable features of objects from more posterior portions of the IPS with experiential knowledge of object use and function to guide actions.
Keywords: posterior parietal cortex, tools, visuomotor, visual-motor transformation, functional magnetic resonance imaging
the primate visual system is grossly divided into ventral and dorsal pathways (Ungerleider and Mishkin 1982), traditionally associated with object recognition and spatial cognition, respectively. However, recent neurophysiological (e.g., Sereno and Maunsell 1998) and neuroimaging (e.g., Konen and Kastner 2008b) studies have identified object-selective neural representations in regions of the dorsal pathway. Goodale and Milner (1992) proposed that the two parallel pathways serve different behavioral goals, with the ventral stream being important for perception and recognition and the dorsal stream being important for action guidance. Consistent with this hypothesis, neuroimaging studies have shown that viewing pictures of tools, which have strong and specific action associations, activates a left-lateralized network of brain regions including the anterior intraparietal sulcus (IPS) (Chao and Martin 2000; Chouinard and Goodale 2012; Valyear et al. 2007). The same left-lateralized network has been associated with viewing, hearing, executing, planning, and pantomiming tool use (Lewis 2006). Additionally, damage to regions of this network leads to ideomotor apraxia, characterized by disrupted tool usage but spared recognition (Haaland et al. 2000; Johnson-Frey 2004). Finally, behavioral evidence suggests that simply viewing pictures of objects invokes motor representations of actions that those object afford (Grezes et al. 2003; Humphreys et al. 2004; Masson et al. 2011; Tucker and Ellis 1998).
An independent line of research has uncovered a series of regions in the human IPS that contain a topographic representation of visual space (Konen and Kastner 2008a; Schluppeck et al. 2005; Sereno et al. 2001; Silver et al. 2005; Swisher et al. 2007; for review, see Silver and Kastner 2009). These regions, referred to as IPS0 (i.e., V7) through IPS5, each contain a hemifield representation of contralateral space, are separated by reversals in the progression of polar angle representation, and form a hierarchy of high-level dorsal stream regions that extend throughout the IPS and can be identified in individual subjects. The functional properties of these areas have been explored with respect to motion processing (Konen and Kastner 2008a), eye movements (Konen and Kastner 2008a; Levy et al. 2007), reaching and grasping (Konen et al. 2013; Levy et al. 2007), object selectivity (Konen and Kastner 2008b), spatial attention (Lauritzen et al. 2009; Silver et al. 2005; Szczepanski et al. 2010), and short-term memory (Schluppeck et al. 2006; Sheremata et al. 2010). For example, Konen and Kastner (2008b) showed that the posterior regions IPS1 and IPS2 contain a high-level representation of basic object information that is comparable to that of the lateral occipital complex (LOC), a region of the ventral pathway that has been closely associated with object recognition (Grill-Spector et al. 2001). Both IPS1/2 and LOC show evidence of a size- and rotation-invariant representation of objects, a hallmark of an object recognition system subserving object constancy.
Tool-related activity is often reported in the left posterior parietal cortex, in the anterior IPS, and spreading into the superior and inferior parietal lobules (for review see Johnson-Frey 2004; Lewis 2006). This anatomic region is close to that described for IPS5 (Konen and Kastner 2008a), as well as a putative homolog of the macaque anterior intraparietal area (AIP), referred to here as the human parietal grasp region (hPGR) and elsewhere as human AIP (hAIP). This later region has been implicated in the control of overt grasping movements (Binkofski et al. 1998; Culham 2004; Culham et al. 2003; Frey et al. 2005). Previously, Valyear et al. (2007) showed that the tool-specific activity was consistently located posterior to hPGR, suggesting that this activity did not simply reflect a potential movement plan. Additionally, Konen et al. (2013) showed that hPGR is located anterior to IPS5, although there is some partial overlap with the most anterior topographic regions. However, it remains unclear as to whether IPS5 and the tool-specific area overlap, as suggested by the anatomic descriptions of Valyear et al. (2007) and Konen et al. (2103), or are distinct. Of note, a functionally equivalent tool region is not found in macaques, even after extensive training with tool usage (Peeters et al. 2009). Given the proposed functional correspondence between human IPS5 and macaque VIP (Konen and Kastner 2008a; Silver and Kastner 2009), tool-specific object responses in IPS5 might suggest that macaque VIP is an evolutionary precursor to the tool-specific region in human posterior parietal cortex.
In the current study, we explored the specificity of object information in and around the human IPS with respect to four stimulus categories: tools, animals, graspable (non-tool) objects, and scrambled objects. Specifically, we compared category-evoked activations in a set of topographic and functional regions of interest (ROIs) defined in individual subjects. This ROI-based approach allowed for group-level statistics without requiring spatial normalization (i.e., anatomic averaging) of different brains, which is especially problematic for higher order areas in parietal cortex that show large intersubject anatomic variability (Caspers et al. 2006; Konen and Kastner 2008a; Scheperjans et al. 2008). We provide evidence that the tool-specific activation in the left anterior IPS is located lateral, anterior, and inferior to IPS5 and lateral and inferior to hPGR. The three regions are mainly distinct, with some partial overlap. Additionally, we show that the activation bias for tools extends throughout the left IPS, including more posterior regions than those that have been previously reported. Finally, we demonstrate a transformation of object information along regions of the IPS, evidenced by a gradient of stronger responses to tools and graspable objects compared with animals in posterior regions and stronger responses to tools compared with animals and graspable objects in more anterior regions. In conjunction with previous results, these data suggest that posterior regions of the IPS (e.g., IPS0–IPS2) contain a representation of object features that are indicative of object graspability, which encompasses tools and non-tool objects, and that in anterior regions of the left IPS, this information is combined with experience-dependent knowledge of action associations, function, and potential goals.
MATERIALS AND METHODS
Subjects
Twelve human subjects (7 men, 24–36 yr of age) gave informed written consent for participation in this study. All subjects reported that they were right-handed, had normal or corrected-to-normal vision, and were in good health with no history of neurological disorders. Subjects participated in five or six scanning sessions, five for a series of functional localizers and one for the main experiment. One subject was not scanned in the tool-animal localizer study, and two were not scanned in the grasping localizer. All procedures were approved by the Institutional Review Panel of Princeton University.
Stimulus Presentation
Stimuli were presented using a Macintosh G4, G5, or Pro computer (Apple Computers, Cupertino, CA) running MATLAB (The MathWorks, Natick, MA) and the Psychophysics Toolbox (version 3; Brainard 1997; Pelli 1997). Visual stimuli were projected from a Powerlite 7250 liquid crystal display projector (Epson, Long Beach, CA; Allegra setup) or a Hyperion MRI Digital Projection System (Psychology Software Tools, Sharpsburg, PA; Skyra setup) onto a translucent screen located at the end of the scanner bore, which subjects viewed through a mirror attached to the head coil. The projection covered a circular region of 30° of visual angle (Allegra setup) or a rectangular region of 28 × 48° of visual angle (Skyra setup). For the movement experiments, auditory stimuli were delivered via MR-compatible hearing tubes. In all experiments, stimulus presentation was time-locked to functional MRI (fMRI) acquisition via a trigger from the scanner at the start of image acquisition.
Scanning Parameters
For all scan sessions except for the tool-animal localizer study, data were acquired with a Siemens 3T Allegra scanner (Siemens, Erlangen, Germany) using a standard head coil. For the tool-animal localizer study and three subjects' object category localizer study, data were acquired with a Siemens 3T Skyra scanner (Siemens) using a 16-channel phased-array head coil. Functional images were acquired with a gradient echo, echo planar sequence using an interleaved acquisition. The specific parameters for each scan session are outlined below.
Retinotopic mapping.
Twenty-five coronal (Allegra) or 31 axial (Skyra) slices covering occipital, posterior parietal, and temporal cortex were acquired [128 × 128 matrix, 256 × 256-mm2 field of view (FOV), 2 × 2-mm2 in-plane resolution, 2-mm slice thickness with 1-mm gap or 3-mm slice thickness, 2.5-s repetition time (TR), 40-ms echo time (TE), 75 or 90° flip angle (FA)]. Scanning at the Allegra used a partial Fourier factor of 7/8 to sample an asymmetric fraction of k space and reduce acquisition time. Scanning at the Skyra used a generalized autocalibrating partially parallel acquisition (GRAPPA) sequence with an acceleration factor of 2.
Memory-guided saccade task.
The scanning parameters were the same as for the retinotopic mapping, except we acquired axial slices covering parietal, frontal, and dorsal occipital cortex.
Object category localizer.
For the data collected at the Allegra scanner, the parameters were the same as for retinotopic mapping, except we acquired axial slices covering ventral temporal and occipital cortex. For the data collected at the Skyra scanner (3 subjects), the parameters were the same as for the tool-animal localizer (see below), except we acquired 45 axial slices with whole brain coverage (2.5-s TR, 76° FA).
Grasping localizer.
The scanning parameters were the same as for the memory-guided saccade task, except we acquired 20 axial slices (2-s TR, 75 or 90° FA). All data for the grasping localizer were collected at the Allegra scanner.
Tool-animal localizer.
Thirty-six axial slices covering the whole brain, apart from inferior frontal and the anterior temporal cortex, were acquired using a GRAPPA sequence with an acceleration factor of 2 (64 × 64 matrix, 192 × 192-mm2 FOV, 3 × 3-mm2 in-plane resolution, 3-mm slice thickness, no gap, 2-s TR, 30-ms TE, 71° FA). All data for the tool-animal localizer were collected at the Skyra scanner.
Main experiment.
The scanning parameters were the same as in the Tool-Animal Localizer, except that there were 34 axial slices and we did not use GRAPPA acquisition. All data for the main experiment were collected at the Allegra scanner.
For all experiments using an in-plane resolution of 2 mm2, an in-plane magnetic field map image (2 × 2-mm2 in-plane resolution, 2-mm slice thickness, same gap as functional scans, 0.5-s TR, 5.23- or 7.69-ms TE, 55° FA) was acquired to perform echo planar image undistortion (Jenkinson 2001; Jezzard and Balaban 1995). In each session, a high-resolution anatomic scan (magnetization-prepared rapid-acquisition gradient echo sequence, MPRAGE; Allegra: 256 × 256 matrix, 256 × 256-mm2 FOV, 1-mm isotropic resolution, 2.5-s TR, 4.38-ms TE, 8° FA; Skyra: 256 × 256 matrix, 240 × 240-mm2 FOV, 0.9375 × 0.9375-mm in-plane resolution, 0.9-mm slice thickness, 1.9-s TR, 2.1-ms TE, 9° FA, GRAPPA acceleration factor of 2) was acquired to facilitate alignment of functional data with the cortical surface. Two high-resolution structural scans (MPRAGE, same parameters as above) were acquired in a separate session, averaged, and used for cortical surface reconstruction in FreeSurfer.
Functional Localizers
For each subject, we defined a series of ROIs from independent data sets, each collected during a separate scanning session. Below, we briefly describe these procedures, the details of which are published elsewhere (see specific citations below). In all cases, functional ROIs were defined on each subject's cortical surface using AFNI/SUMA. This facilitates the alignment of functional ROIs across sessions and inherently limited our ROIs to the cortex. When projecting ROIs from surface space to volume space, we filtered out voxels for which a given ROI did not account for at least 50% of all the surface nodes intersecting that voxel. This procedure ensures a conservative assignment of each voxel to a single functional ROI by limiting the influence of voxels that sample multiple ROIs due to regional borders or complex cortical folding patterns.
Retinotopic mapping.
Standard retinotopic mapping was performed for each subject using a color and luminance varying flickering checkerboard stimulus (Arcaro et al. 2009; Swisher et al. 2007). The detailed description of the design, acquisition, and analysis is given elsewhere (Arcaro et al. 2009). Briefly, subjects performed 3–5 runs of polar angle mapping and 2 runs of eccentricity mapping, each comprising eight 40-s stimulus cycles. Polar angle and eccentricity representations were extracted from separate runs using standard phase encoding techniques (Bandettini et al. 1993; Engel et al. 1997; Sereno et al. 1995). Borders between adjacent visual areas were defined by reversals in polar angle representations at the horizontal and/or vertical meridians. For the current study, we only report the results for primary visual cortex (V1).
Memory-guided saccade task.
A memory-guided saccade task was used to localize topographically organized areas in posterior parietal cortex (Konen and Kastner 2008a; Schluppeck et al. 2005; Sereno et al. 2001; Silver et al. 2005; Swisher et al. 2007). This task incorporates covert shifts of attention, working memory, and saccadic eye movements in a traveling wave paradigm. The detailed description of the design, acquisition, and analysis is given elsewhere (Kastner et al. 2007; Konen and Kastner 2008a). Briefly, subjects had to remember and attend to the location of a peripheral cue over a delay period while maintaining central fixation. After the delay period, the subject had to execute a saccade to the remembered location and then immediately back to central fixation. The target cue was systematically moved on subsequent trials either clockwise or counterclockwise among eight equally spaced locations. Subjects performed 8 runs, each composed of eight 40 s cycles of the sequence of 8 target positions. Fourier analysis (Bandettini et al. 1993; Engel et al. 1997; Sereno et al. 1995) was used to identify voxels that were sensitive to the spatial position (i.e., polar angle) of a peripheral cue during the task.
Seven topographically organized areas were identified in the posterior parietal cortex (Konen and Kastner 2008a). Each contained a representation of the contralateral visual field and was separated from neighboring areas by reversals in the progression of polar angle representation. Anterior to visual area V7/IPS0, IPS1 and IPS2 were located in the posterior part of the IPS. IPS3 and IPS4 were located in the anterior-lateral branch of the IPS. IPS5 extended into the intersection between the IPS and the postcentral sulcus. SPL1 branched off the most superior areas of the IPS and extended into the superior parietal lobule.
Object category localizer.
We used a standard object category localizer to define the object-selective lateral occipital complex (LOC; Grill-Spector et al. 1998b; Malach et al. 1995). Briefly, grayscale pictures of objects (∼12 × 12°) from different categories were presented in 15-s blocks, each containing 20 stimuli (350-ms duration, 400-ms interstimulus interval). During stimulus presentation, subjects maintained central fixation and performed a one-back task indicating the repeated presentation of an object. Stimuli for each block were drawn from one of five categories: faces, houses, headless bodies, intact generic objects, and scrambled pictures of generic objects. For the current analysis, we only considered the response during the presentation of intact or scrambled objects. LOC was defined as a region near the lateral occipital cortex that showed significantly stronger activity during the presentation of intact compared with scrambled objects (P < 0.01). Subjects viewed 12 blocks per stimulus category over the course of 4 runs.
Grasping localizer.
To define a putative human homolog of macaque AIP, referred to here as hPGR and elsewhere as hAIP (see below for a discussion of our selection of nomenclature), subjects performed an overt grasping and reaching task (Binkofski et al. 1998; Cavina-Pratesi et al. 2010; Culham 2004; Culham et al. 2003; Frey et al. 2005). The details of the grasping and reaching task are described in Konen et al. (2013). Briefly, in a slow event-related design, subjects made reaching or grasping movements toward a grasping apparatus while they lay supine in the horizontal scanner bore. The type of movement was indicated by an auditory cue (500 Hz for grasping, 400 Hz for reaching, 75-ms duration). Subjects viewed the grasping through a mirror attached to the head coil. The hPGR has been reported to have similar properties and anatomic location for studies using a analogous design with (Frey et al. 2005) and without (Binkofski et al. 1998; Culham et al. 2003) a mirror (Culham et al. 2006). Additionally, although the use of a mirror greatly reduced the ecological validity of the task, it also reduced head motion due to the more relaxed subject positioning within the scanner. The grasping apparatus was positioned over the subject's hips, just outside of the scanner bore, such that subjects could make reaching or grasping movements with their right hand to either target block without moving their upper arm or shoulder. For grasping movements, subjects performed a precision grasp of a target block with their thumb and index finger. For reaching movements, subjects touched the middle of a target block with the knuckle of their index finger. All movements were performed in close loop, with the arm and hand visible to the subject. Each trial lasted 14 s, and over the course of 10 runs, subjects performed 40 trials of each movement type.
Following previous studies (Binkofski et al. 1998; Culham 2004; Culham et al. 2003; Frey et al. 2005), hPGR was defined as a region near the intersection of the IPS and the postcentral sulcus in the left hemisphere that showed stronger evoked responses during grasping compared with reaching movements (P < 0.05, uncorrected). To avoid including somatosensory cortex, we limited the anterior extent of this region by the depths of the postcentral sulcus.
In a cross-species comparison using fMRI, Nelissen and Vanduffel (2011) showed grasping-related activation in macaque AIP (in addition to other regions). Although these data support a functional homology between the human grasp-related region defined here and macaque AIP, establishing such a homology would require a comparison of functional response properties across a variety of tasks, as well as patterns of anatomic connectivity between these regions and more established homologous regions (e.g., primary sensory and motor regions), patterns of gene expression, and comparisons of cytoarchitecture. Thus we have chosen to use the nomenclature human parietal grasp region (hPGR) to emphasize the functional definition of this region and to avoid implying a direct correspondence with macaque AIP.
To maintain independence of the data across all ROIs for the analysis of the main experiment (see below), hPGR was limited to the region anterior to the topographic ROIs (i.e., IPS4/5). However, the full extent of this region is depicted in Fig. 2.
Fig. 2.

Statistical parametric maps from the analysis of the tool-animal localizer for 3 representative subjects (S6, S9, and S4). Greater responses to images of tools (orange) or animals (blue) are presented on inflated cortical surfaces for each subject (P < 0.01). Asterisks denote the significance peak of the contrast. Topographic regions of the IPS are outlined in black (IPS0–IPS5, posterior to anterior), and the human parietal grasp region (hPGR) is outlined in white. Although the extent of activation varied across subjects, there was a consistent tool-specific region located in the left anterior IPS, extending lateral, anterior, and inferior to IPS5 and lateral and inferior to hPGR. In addition, all subjects showed a response bias for tool images in more posterior topographic regions of the IPS (e.g., IPS0). No consistent response patterns were observed in the right hemisphere.
Tool-animal localizer.
To identify regions of left parietal and bilateral ventral-temporal cortex that showed preference for the visual presentation of tools or animals, we used a localizer similar to that used in previous studies (Chao and Martin 2000; Valyear et al. 2007). Subjects passively viewed pictures of either tools or animals in a block design (Fig. 1). Each block lasted 16 s and contained the presentation of 16 pictures (750-ms duration, 250-ms interstimulus interval) of either tools or animals. Fixation blocks without visually presented objects were included at the beginning and end of each run. Subjects performed 2 runs of the tool localizer, for a total of 16 blocks per stimulus category. The analysis of this data set and subsequent identification of tool- or animal-specific ROIs is outlined below.
Fig. 1.

Schematics of the experimental design for the tool-animal localizer and the main experiment. In the tool-animal localizer (A), subjects passively viewed images of tools (T; e.g., saw, scissors, pizza cutter) and animals (A; e.g., dog, giraffe, polar bear) presented in alternating 16-s blocks. The analysis of this data set is presented in Fig. 2 and used to define a tool-specific functional region of interest (ROI) in the left anterior intraparietal sulcus (IPS) referred to as tAIPS. In the main experiment (B), subjects performed a fixation dimming detection task while images of tools, animals, graspable (non-tool) objects (G; e.g., belt, wallet, candle), and scrambled objects (S) were presented in 16-s blocks, interleaved with fixation-only blocks. The response profile across the 4 stimulus categories was analyzed for a series of functionally defined ROIs, presented in Figs. 3–6. Images in both experiments were realistic photo objects.
Main experiment.
The main experiment (Fig. 1B) was a variant of the object category localizer. In a block design, subjects were presented pictures from one of four stimulus categories: tools, animals, graspable (non-tool) objects, and scrambled objects. Each block lasted 16 s, contained the presentation of 16 pictures (750-ms duration, 250-ms interstimulus interval) from one stimulus category, and was preceded by 16 s of fixation during which no pictures were presented. An additional 16-s fixation block occurred at the end of each run. Subjects were instructed to maintain fixation on a centrally presented spot (0.25°) while they covertly counted the number of times that the fixation spot dimmed, which could occur at anytime during stimulus or fixation blocks. Each run contained two stimulus blocks for each of the four stimulus categories. Across 12 runs, the order of the stimulus category presentation was counterbalanced such that each stimulus category preceded and followed every other category, including itself, an equal number of times. In total, subjects viewed 24 blocks of each stimulus category across the entire scanning session.
Preprocessing and Data Analysis
Data were analyzed by using AFNI (http://afni.nimh.nih.gov/afni/; Cox 1996), FSL (http://www.fmrib.ox.ac.uk/fsl/; Smith et al. 2004), FreeSurfer (http://surfer.nmr.mgh.harvard.edu; Dale et al. 1999; Fischl et al. 1999), SUMA (http://afni.nimh.nih.gov/afni/suma; Saad et al. 2004), MATLAB (The MathWorks, Natick, MA), and SPSS Statistics 19 (IBM, Armonk, NY).
For the tool-animal localizer and main experiment, functional scans were slice-time corrected to the first slice of every volume and motion corrected within and between runs. The in-session anatomic volume was aligned with the average motion-corrected functional volume of the same session. Subsequently, the out-of-session anatomic volume used for surface reconstruction was aligned with the in-session anatomic volume, and this transformation matrix was used to resample the functional data onto a cortical surface model and to provide alignment of surface-based ROIs from the localizer scans with the experimental data set. Functional images were smoothed with a 4-mm (main experiment) or 6-mm (tool-animal localizer) Gaussian kernel and normalized to percent signal change by dividing the voxelwise time series by its mean intensity in each run. The response during each experimental condition (i.e., stimulus category) was quantified in the framework of the general linear model (Friston et al. 1995). Square-wave regressors for each stimulus category were generated and convolved with a response model (BLOCK model in AFNI's 3dDeconvolve function) accounting for the shape and temporal delay of the hemodynamic response. Nuisance regressors were included to account for variance due to baseline drifts across runs, linear drifts within each run, and the six-parameter rigid-body head motion estimates.
For the tool-animal localizer, we directly contrasted the activity evoked by the presentation of tools compared with animals. Subsequently, we defined a region denoted tAIPS near the intersection of the left IPS and postcentral sulcus, distinct from IPS5 and hPGR, that showed stronger evoked activity during blocks of tool stimuli compared with animal stimuli (P < 0.01, uncorrected). Additionally, we defined a series of regions in occipital-temporal cortex that showed a consistent preference for tools or animals across all subjects (Chao et al. 1999). Tool-specific regions were identified bilaterally near the parahippocampal cortex (tPHC) and in the left middle temporal gyrus (tMT). Animal-specific regions were identified bilaterally near the fusiform gyrus (aFF). These occipital-temporal ROIs were defined independently of LOC. We also observed tool- and animal-specific regions near the lateral occipital cortex and extending toward the superior temporal sulcus (animals) or the IPS (tools) in some subjects, but the anatomic location of these regions was not as consistent across subjects, and thus they are not considered further.
For the main experiment, visually active voxels were defined by the contrast of stimulus blocks vs. fixation blocks (P < 0.05, uncorrected). A response profile for each functionally defined ROI was obtained from these visually active voxels and characterized with the following analyses.
The average time series was extracted from visually active voxels for each functionally defined ROI from the unsmoothed data after linear trend removal. Block-triggered averages of the BOLD time course were calculated for each of the four stimulus categories. The time course was normalized to the average of the two preceding time points and the first time point of each block. The mean response to each stimulus condition was calculated as the average evoked response across a 14-s (7 TRs) window starting 6 s (3 TRs) after block onset. Mean responses were compared in a series of two-way (ROI × stimulus category) repeated-measures ANOVA, with subject as a random factor. Given our a priori interest in changes in response properties across the topographic regions of the IPS, we included IPS0–IPS5 in one ANOVA. We were particularly interested in an interaction between ROI and stimulus category, indicating different response profiles across regions. Separate ANOVAs were used to analyze nontopographic parietal regions (hPGR and tAIPS), occipital-temporal regions (LOC, tPHC, aFF, and tMT), V1, and SPL1. In each case, a separate analysis was performed for each hemisphere. We limited our analysis of mean responses to the three intact stimulus categories, but the results were not qualitatively different when scrambled objects were included.
To more directly compare the differences between conditions, we calculated a d′ index:
where μ and σ2 are the blockwise mean and variance, respectively, of the evoked response for a given condition. This index has been used in previous neuroimaging (Pinsk et al. 2005) and neurophysiological studies (Afraz et al. 2006) to quantify neural responses differences across experimental conditions. This index scales the difference across two conditions (cond1 and cond2) by a measure of the overall variance and is positive when cond1 > cond2 and negative when cond2 > cond1, with larger values indicating greater separability. The distributions of d′ values calculated across subjects for each ROI were compared against zero using a one-sample t-test. Additionally, for the topographic regions of the IPS (IPS0–IPS5), a one-way (ROI) repeated-measures ANOVA with subject as a random factor was used to test for linear gradients in the response profile for each pair of stimulus category comparisons.
For all ANOVAs, violations of sphericity, as indicated by Maulchy's test, were corrected using the Greenhouse-Geisser correction. Post hoc pairwise comparisons were made using the Dunn-Šidák correction.
Talairach Coordinates
For the purpose of reporting standard coordinates of tAIPS, hPGR, and IPS5, we transformed each subject's anatomic volume into Talairach space using AFNI's @auto_tlrc function. The resulting transformation matrix was used to convert the coordinate for the center of mass, determined from the cortical surface projection of the appropriate functional contrast of each ROI, into Talairach space.
RESULTS
Tool Specificity in Parietal Cortex
To explore the relationship between tool-specificity and spatial topography in the human IPS, we first compared stimulus-evoked responses during the tool-animal localizer (Fig. 1A), in which subjects passively viewed pictures of tools and animals. Figure 2 shows the results of the contrast between the tool and animal conditions (P < 0.01) for three representative subjects. Regions of the IPS containing a topographic representation of visual space (i.e., IPS0–IPS5) are outlined in black. The hPGR (Binkofski et al. 1998; Culham 2004; Culham et al. 2003; Frey et al. 2005) is outlined in white. Consistent with previous reports (Chao and Martin 2000; Valyear et al. 2007), viewing pictures of tools evoked stronger activity than viewing pictures of animals in the left anterior parietal cortex. Although the extent of activation varied, this region was consistently located near the intersection of the IPS and the postcentral gyrus in all subjects. The Talairach coordinates of this contrast (Table 1) were located lateral, anterior, and inferior to IPS5 [Table 2; X, t(10) = −3.59, P = 0.005; Y, t(10) = 4.79, P = 0.0007; Z, t(10) = −2.76, P = 0.02] and lateral and inferior to hPGR [Table 3; X, t(8) = −2.39, P = 0.04; Y, t(8) = 2.22, P = 0.06; Z, t(8) = −3.55, P = 0.008], although there was partial overlap between all three areas in many subjects, especially at liberal thresholds. Specifically, about 50% of the voxels in IPS5 (Table 2) and hPGR (Table 3) showed stronger stimulus-evoked responses to pictures of tools compared with pictures of animals, but this only accounted for about 17% of the total tool-specific activation in the left anterior parietal cortex (Table 1).
Table 1.
Talairach coordinates, total volume, and percentage overlap with IPS5 and hPGR for the left anterior parietal tool-specific region
| Talairach Coordinates |
||||||
|---|---|---|---|---|---|---|
| Subject | x | y | z | Volume, mm3 | %Overlap with IPS5 | %Overlap with hPGR |
| S1 | −33 | −46 | 42 | 11,394 | 19 | 9 |
| S2 | −35 | −41 | 44 | 9,396 | 28 | |
| S3 | −43 | −37 | 35 | 7,884 | 7 | 30 |
| S4 | −45 | −43 | 49 | 3,699 | 7 | 5 |
| S5 | −41 | −33 | 35 | 4,023 | 1 | 19 |
| S6 | −42 | −33 | 35 | 6,885 | 38 | 11 |
| S7 | −32 | −33 | 36 | 12,177 | 6 | 22 |
| S8 | −39 | −28 | 37 | 10,692 | 13 | |
| S9 | −48 | −45 | 46 | 10,638 | 17 | 11 |
| S10 | ||||||
| S11 | −44 | −38 | 52 | 12,447 | 32 | 15 |
| S12 | −48 | −43 | 48 | 4,833 | 18 | 32 |
| Mean ± SE | −41 ± 1.7 | −38 ± 1.8 | 41 ± 2.0 | 8,552 ± 987 | 17 ± 4 | 17 ± 3 |
The tool-specific region was defined from the tool-animal localizer by the contrast of viewing tools and animals (P < 0.01). No value indicates subject did not participate in the grasping localizer (S2 and S8) or the tool-animal localizer (S10). IPS5, intraparietal sulcus area 5; hPGR, human parietal grasp region.
Table 2.
Talairach coordinates, total volume, and percentage of tool-specific voxels from the tool-animal localizer for IPS5
| Talairach Coordinates |
|||||
|---|---|---|---|---|---|
| Subject | x | y | z | Volume, mm3 | %Tool Specific |
| S1 | −36 | −49 | 49 | 2,403 | 91 |
| S2 | −39 | −44 | 52 | 3,051 | 88 |
| S3 | −28 | −49 | 40 | 2,079 | 26 |
| S4 | −32 | −49 | 56 | 4,536 | 6 |
| S5 | −31 | −51 | 51 | 1,971 | 1 |
| S6 | −21 | −57 | 53 | 3,591 | 74 |
| S7 | −35 | −44 | 38 | 1,971 | 40 |
| S8 | −23 | −51 | 45 | 2,187 | 65 |
| S9 | −30 | −52 | 42 | 3,564 | 51 |
| S10 | −35 | −35 | 49 | 1,296 | |
| S11 | −33 | −41 | 52 | 5,049 | 79 |
| S12 | −36 | −56 | 46 | 3,240 | 28 |
| Mean ± SE | −32 ± 1.6 | −48 ± 1.8 | 48 ± 1.6 | 2,912 ± 327 | 50 ± 10 |
The tool-specific activation was defined from the tool-animal localizer by the contrast of viewing tools and animals (P < 0.01). No value indicates subject did not participate in the tool-animal localizer (S10).
Table 3.
Talairach coordinates, total volume, and percentage of tool-specific voxels from the tool-animal localizer for hPGR
| Talairach Coordinates |
|||||
|---|---|---|---|---|---|
| Subject | x | y | z | Volume, mm3 | %Tool Specific |
| S1 | −41 | −40 | 59 | 2,295 | 46 |
| S2 | |||||
| S3 | −38 | −55 | 52 | 2,997 | 78 |
| S4 | −28 | −45 | 52 | 2,322 | 8 |
| S5 | −37 | −42 | 53 | 1,980 | 41 |
| S6 | −28 | −54 | 56 | 2,214 | 34 |
| S7 | −36 | −38 | 47 | 3,375 | 78 |
| S8 | |||||
| S9 | −39 | −59 | 51 | 1,620 | 70 |
| S10 | −36 | −34 | 48 | 1,377 | |
| S11 | −33 | −33 | 48 | 3,240 | 58 |
| S12 | −37 | −48 | 53 | 7,560 | 20 |
| Mean ± SE | −35 ± 1.4 | −45 ± 2.9 | 52 ± 1.2 | 1,771 ± 560 | 48 ± 8 |
The tool-specific activation was defined from the tool-animal localizer by the contrast of viewing tools and animals (P < 0.01). No value indicates subject did not participate in the grasping localizer (S2 and S8) or the tool-animal localizer (S10).
A corresponding tool-specific region in the right anterior parietal cortex was not reliably identifiable across individual subjects (Fig. 2). The laterality of tool specificity has been commonly reported (Lewis 2006) for viewing pictures of tools (Chao and Martin 2000; Martin et al. 1996; Peeters et al. 2009; Valyear et al. 2007), as well as pantomiming tool use and planning to use tools (Choi et al. 2001; Fridman et al. 2006; Johnson-Frey et al. 2005).
For each subject, we defined a tool-specific region near the intersection of the left IPS and the postcentral sulcus that showed stronger evoked activity during viewing of pictures of tools compared with pictures of animals (P < 0.01). This region, referred to as tAIPS, excluded regions of IPS5 and hPGR to maintain independence of the functional ROIs tested in the main experiment.
In addition to the anterior region displaying a bias for pictures of tools, there was also evidence of stronger tool-evoked responses compared with animal-evoked responses in more posterior regions of the IPS (e.g., IPS0 in the representative subjects shown in Fig. 2). This posterior tool bias, which has not been previously reported, was observed in all subjects. As with the anterior region, in the right hemisphere a posterior tool bias was not consistently observed across subjects (Fig. 2).
Tool Specificity in Occipital-Temporal Cortex
In occipital-temporal regions, alternating bands of tool- and animal-specific responses were observed in all subjects. Viewing pictures of tools evoked stronger activity than viewing pictures of animals in bilateral parahippocampal cortex (tPHC) and in the left middle temporal gyrus (tMT). The opposite pattern, stronger activation when viewing animals compared with tools, was observed in bilateral fusiform gyrus (aFF). The location of these regions is consistent with previous reports (Chao et al. 1999). ROIs for these regions were defined for each individual subject, independent of LOC, which was defined by the contrast of intact and scrambled objects during a separate object category localizer.
Comparison of Tools, Graspable Objects, Animals, and Scrambled Objects
In a second experiment, we extracted stimulus-evoked time courses of BOLD activity from topographic and functionally defined ROIs during the presentation of tools, animals, graspable (non-tool) objects, and scrambled objects. These data were independent of data used for defining each ROI, including the tool-animal localizer study discussed above. For this experiment, subjects performed a dimming detection task at fixation while pictures of each of the four categories were presented in 16-s blocks, interleaved by blocks with no stimulus presentation (Fig. 1B). Subjects were not instructed to imagine or prepare for any manual action based on the presented stimuli and, in fact, were specifically attending away from the presented stimuli while they engaged in the dimming detection task at fixation.
Group-averaged time courses for an example posterior (IPS1) and anterior (IPS5) ROI from the IPS, as well as the ventral stream area LOC and the early visual area V1, are shown in Fig. 3. We first describe some qualitative observations from these representative time course plots, which we quantify with more specific analyses and for additional regions below. First, viewing scrambled pictures evoked the lowest response in all regions, except V1, suggesting that neurons in each region were sensitive to form information inherent in the objects. Second, consistent with its putative role in perception and recognition (Grill-Spector et al. 1998a; Kourtzi and Kanwisher 2000, 2001), LOC showed only small differences in evoked response across the intact stimulus categories. Third, in general, viewing pictures of tools evoked the strongest activity throughout the topographic regions of the IPS. Fourth, and perhaps most interesting, the activity evoked by graspable (non-tool) objects was similar to that evoked by tools in the more posterior IPS1, whereas it was similar to that evoked by animals in the more anterior IPS5.
Fig. 3.

Group-averaged time courses for visually responsive voxels in some representative ROIs of the left (A) and right hemispheres (B). Primary visual cortex (V1) displayed the weakest response to images of tools and the strongest response to scrambled images, indicating its sensitivity to retinotopic image size. Lateral occipital complex (LOC) showed only slight differences in evoked response across the intact stimulus categories. In the IPS, viewing images of tools generally evoked the strongest activity. Additionally, the activity evoked by tools was similar to that evoked by graspable (non-tool) objects and greater than that evoked by animals in the more posterior IPS1, where it exceeded that evoked by both graspable objects and animals in the more anterior IPS5. Grasp, graspable objects; scramb, scrambled objects.
Below, we explore these differences by first quantifying and comparing the response profile of topographic (IPS0–IPS5, SPL1) and functionally defined regions (hPGR, tAIPS) in and around the IPS. Later, we discuss the response profile in ventral visual (LOC, tPHC, aFF, and tMT) and, briefly, early visual areas (V1).
Comparison of Tool and Non-Tool Responses in Parietal Cortex
To explore the potential differences in evoked response across stimulus category, we extracted the mean activation in each block from the peak response in a 14-s (7 TRs) window starting 6 s (3 TRs) after block onset (Fig. 4). Separately for topographic IPS (IPS0–IPS5) and nontopographic anterior parietal cortex (hPGR and tAIPS), mean stimulus-evoked responses were compared for the three intact stimulus groups in a two-way (ROI × stimulus category) repeated-measures ANOVA. No significant differences were observed in the evoked response of SPL1 across the three intact object categories, and this ROI is not considered further.
Fig. 4.
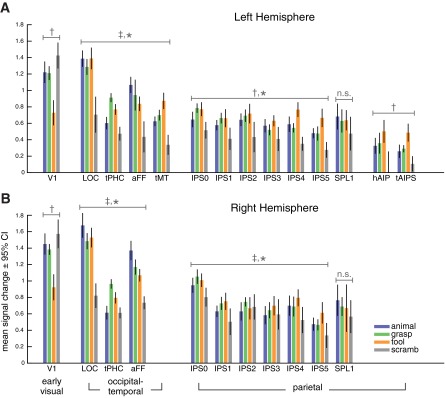
Mean signal change separated by stimulus category for each functionally defined ROI in the left (A) and right hemispheres (B). Tools evoked a stronger blood oxygen level-dependent (BOLD) response than graspable (non-tool) objects or animals in topographic regions of the IPS, with more consistent differences in the left hemisphere. A similar pattern was observed in the functionally defined regions hPGR and tAIPS in the left hemisphere. In occipital-temporal cortex, functionally defined ROIs showed response patterns consistent with their definitions from the tool-animal localizer. Tools evoked the lowest response in primary visual cortex, indicating that differences in higher order areas were not simply propagated from early visual cortex. No significant differences across intact stimulus categories were observed for superior parietal lobe (SPL1). †P < 0.001, significant main effect across the 3 intact stimulus categories (S). ‡P < 0.001, significant main effect across ROIs (R). *P < 0.001, significant interaction between stimulus category and ROI (R×S). aFF, animal-specific region near the fusiform gyrus; tMT, tool-specific region in the left middle temporal gyrus; tPHC, tool-specific region near the parahippocampal cortex; n.s., not significantly different.
The analysis of topographic ROIs in the left hemisphere revealed a significant main effect of stimulus category [F(1,2) = 9.07, P = 0.001] and a significant interaction between ROI and stimulus category [F(1,10) = 7.20, P < 0.001]. The complimentary analysis in the right hemisphere revealed a significant main effect of ROI [F(1,5) = 5.38, P < 0.001], a marginal effect of stimulus category [F(1,2) = 3.19, P = 0.061], and a significant interaction between ROI and stimulus category [F(1,10) = 3.75, P < 0.001].
Consistent with the qualitative analysis of the time courses presented above, visual inspection of Fig. 4 suggests that the effect of stimulus condition was driven by a general bias for pictures of tools compared with pictures of graspable objects or animals. Pairwise comparisons support this conjecture. In the left hemisphere, pictures of tools evoked significantly stronger responses than both pictures of graspable objects (P = 0.041) and pictures of animals (P = 0.002). In the right hemisphere, pictures of tools evoked marginally significantly stronger responses than pictures of animals (P = 0.066).
Of particular interest, the interaction between ROI and stimulus category indicates that the response profile for tools, graspable objects, and animals differed across IPS0–IPS5. Visual inspection of Fig. 4 suggests that this interaction stems from the fact that tools and graspable objects evoked stronger activity than animals in posterior IPS regions, whereas tools evoked stronger activity than graspable objects and animals in anterior IPS regions. This pattern is explored in more detail in direct pairwise comparisons between tools, animals, and graspable objects presented below.
As expected, the analysis of nontopographic ROIs in left anterior parietal cortex (hPGR and tAIPS) revealed a significant main effect of stimulus category [F(1,2) = 15.66, P < 0.001]. Post hoc analysis indicated that this effect was driven by a stronger activation in response to tools than to graspable objects (P = 0.003) and animals (P = 0.006). This analysis confirms the specificity of tAIPS for tools and not simply for inanimate objects (see also Valyear et al. 2007). We did not find a significant interaction between ROI and stimulus category [F(1,2) = 0.59, P = 0.57]. The grasping-related region hPGR showed a response profile analogous to that of tAIPS, both of which showed a response profile similar to that of the most anterior topographic regions, IPS4/5.
As discussed above, close inspection of the data in Fig. 4 suggests that although tools evoked consistently stronger responses than animals throughout the IPS, graspable objects evoked stronger responses than animals in posterior (e.g., IPS0/1) but not anterior regions (e.g., IPS4/5). To more closely quantify differences in evoked responses across stimulus condition, we calculated a d′ index (see materials and methods) for three pairwise comparisons: tools vs. animals, tools vs. graspable objects, and graspable objects vs. animals (Fig. 5). This index scales the differences between two conditions by the total variance of the evoked response and thus is a metric of the separability between two distributions, rather than simply their mean difference.
Fig. 5.

Pairwise comparisons of the differences between mean activation evoked by the 3 intact stimulus categories using a d′ index for parietal cortex ROIs. The d′ index is a measure of the separability of the distributions, across subjects, of evoked responses for 2 different stimulus categories. The comparison of tools and animals (A) confirmed the general tool bias in the topographic regions of the parietal cortex, as well as hPGR and tAIPS. The comparisons of tools and graspable objects (B) and graspable objects and animals (C) revealed a response profile gradient along the posterior-to-anterior extent of the topographic regions of the IPS, most clearly in the left hemisphere. Graspable objects evoked significantly stronger response than animals, but not tools, in posterior regions and significantly weaker responses than tools, but not animals, in anterior regions. *P < 0.05, significantly different from zero. †P < 0.003, significant linear trend across ROIs. CI, confidence interval.
Figure 5A shows the results for the comparison of stimulus-evoked activity for pictures of tools and animals in parietal cortex. Viewing pictures of tools evoked stronger responses in both anterior (IPS4/5, P < 0.01), as well as posterior regions (IPS1/2, P < 0.05) of the left IPS. IPS5, in particular, is located near the intersection of the IPS and the postcentral sulcus and may at least partially account for the previously reported tool bias in the anterior IPS (Chao and Martin 2000; Valyear et al. 2007). However, as noted from the analysis of the tool-animal localizer data presented above, the major region of cortex showing stronger activity in response to the presentation of tools compared with animals extended lateral, anterior, and inferior to IPS5 (Fig. 2 and Table 1).
Interestingly, although tool-specific responses are typically reported only in the left hemisphere (Lewis 2006), a similar pattern of results was observed for the right hemisphere ROIs. Right IPS1 and IPS3–IPS5 showed stronger responses to pictures of tools compared with pictures of animals (P < 0.05), albeit with more variability. Thus our ROI-based approach may be particularly sensitive to differences in stimulus-evoked response by the different stimulus categories.
The comparison of stimulus-evoked activity for pictures of tools and graspable objects (Fig. 5B) and for pictures of graspable objects and animals (Fig. 5C) revealed a response profile gradient along the posterior-to-anterior extent of the topographic regions of the IPS in the left hemisphere. For both comparisons, a one-way (ROI) repeated-measures ANOVA revealed a main effect of ROI [tools vs. graspable objects: F(1,5) = 8.84, P < 0.001; graspable objects vs. animals: F(1,5) = 9.58, P < 0.001] and a significant linear trend across IPS0–IPS5 [tools vs. graspable objects: F(1,1) = 24.16, P < 0.001; graspable objects vs. animals: F(1,1) = 26.76, P < 0.001]. Specifically, graspable objects evoked significantly stronger activity than animals, but not different than tools, in posterior regions (IPS0/1, P < 0.02) and significantly weaker activity than tools, but not different than animals, in more anterior regions (IPS3–IPS5, P < 0.02). The same gradient was also apparent in the right hemisphere, with significant differences observed between graspable objects and animals for posterior regions (IPS0–IPS2, P < 0.05) and between tools and graspable objects in the most extreme anterior regions (IPS5, P = 0.007). As with the left hemisphere, a one-way (ROI) repeated-measures ANOVA of the right hemisphere data revealed a main effect of ROI [tools vs. graspable objects: F(1,5) = 6.19, P < 0.001; graspable objects vs. animals: F(1,5) = 4.41, P = 0.002] and a significant linear trend across IPS0–IPS5 [tools vs. graspable objects: F(1,1) = 23.89, P < 0.001; graspable objects vs. animals: F(1,1) = 14.19, P = 0.003].
In the left hemisphere, this gradient, from a posterior bias for any graspable object to an anterior tool specificity, culminated in the tool-specific tAIPS. Expectedly, tAIPS showed a high degree of specificity for tools compared with both graspable objects and animals (P < 0.001). The grasping-related region hPGR showed a similar but slightly weaker response profile. In hPGR, pictures of tools evoked a stronger response than pictures of animals (P = 0.04), but neither of the other two comparisons were significant. A direct comparison of tool specificity in tAIPS and hPGR showed no significant difference for the comparison of tools and animals [t(8) = 1.32, P = 0.22, paired t-test] and a marginal trend toward a difference for the comparison of tools and graspable objects [t(8) = 2.03, P = 0.077, paired t-test]. Potentially weaker effects in hPGR are not surprising given that the subjects were performing a fixation-dimming task with no explicit motor requirement. Additionally, for this analysis, we included only the more anterior portions of hPGR that did not overlap with the topographic regions of the IPS (e.g., IPS5). This was done to maintain independence across all ROIs for this analysis. However, others have noted that hPGR, as defined here, contains an anterior subdivision that is only sensitive to somatosensory and motor components of a delayed grasping task, whereas a more posterior subdivision is additionally sensitive to the visual components of a task (Culham 2004; Singhal et al. 2006). It is possible that the visually responsive subdivision corresponds to the portions of the topographic regions (e.g., IPS4/5) that overlap with hPGR (Fig. 2; Konen et al. 2013).
Comparison of Tool and Non-Tool Responses in Occipital-Temporal Cortex
To compare the response profile of parietal ROIs in the dorsal and ventral visual streams, we performed complimentary analyses for a series of ROIs defined in occipital-temporal cortex: LOC, tPHC, aFF, and tMT (see above). All regions were defined bilaterally except tMT, which was only defined in the left hemisphere. In both hemispheres, a two-way (ROI × stimulus category) repeated-measures ANOVA of the mean stimulus-evoked response to the three intact stimulus categories (Fig. 4) revealed a significant main effect of ROI [left: F(1,3) = 12.89, P < 0.001; right: F(1,2) = 16.11, P < 0.001] and a significant interaction between ROI and stimulus category [left: F(1,6) = 20.32, P < 0.001; right: F(1,4) = 19.65, P < 0.001]. This is not surprising given that these ROIs were functionally defined on the basis of differential patterns of response to pictures of tools and animals in the independent tool-animal localizer. We quantified differences in evoked response across the three pairwise intact stimulus conditions more closely using the d′ index (Fig. 6).
Fig. 6.

Pairwise comparisons of the differences between mean activation evoked by the 3 intact stimulus categories using a d′ index for early visual and occipital-temporal cortex ROIs. Conventions are the same as in Fig. 5. In occipital-temporal cortex, the comparison of tools and animals (A) confirmed the specificity of the functionally defined ROIs from the tool-animal localizer. LOC showed only slight differences across stimulus category in the left hemisphere and a bias for animals in the right hemisphere. Primary visual cortex displayed the weakest response to images of tools, consistent with its sensitivity to retinotopic image size. *P < 0.05, significantly different from zero.
Unlike the occipital-temporal ROIs discussed below, LOC was not specifically selected on the basis of its response profile during the tool-animal localizer, and we did not expect to see any differences in stimulus-evoked activity across the three intact stimulus categories. However, we did observe some differences. In the left hemisphere, LOC showed no significant differences across stimulus categories, with a trend toward weaker responses to pictures of graspable objects compared with pictures of tools (P = 0.088) or animals (P = 0.053). In the right hemisphere, LOC showed a preference for pictures of animals compared with pictures of tools (P = 0.03) or graspable objects (P = 0.02).
The remaining occipital-temporal ROIs were defined on the basis of their response profile during the tool-animal localizer, and the results from the main experiment confirmed their expected specificity (Fig. 5). In the bilateral tool-specific region tPHC, pictures of tools evoked stronger activity than pictures of animals (P < 0.005). Additionally, pictures of graspable objects evoked stronger activity than both pictures of tools (P < 0.005) and pictures of animals (P < 0.001). In the bilateral animal-specific region aFF, pictures of animals evoked stronger activity than pictures of either tools (P = 0.001) or graspable objects (P = 0.01), with no differences between tools and graspable objects (P = 0.16). Finally, in the tool-specific region tMT in the left hemisphere, pictures of tools evoked stronger responses than pictures of animals (P < 0.001) or graspable objects (P = 0.002). Additionally, pictures of graspable objects evoked stronger responses than pictures of animals (P = 0.03). Overall, these results are consistent with the tool-animal localizer and demonstrate that the tool-specific region in the middle temporal gyrus (Chao and Martin 2000) is specific for tools, and not simply inanimate objects (see also Valyear et al. 2007).
Comparison of Tool and Non-Tool Responses in Primary Visual Cortex
In V1, a one-way (stimulus category) repeated-measures ANOVA revealed a main effect of stimulus category [left: F(1,2) = 37.47, P < 0.001; right: F(1,1.34) = 42.64, P < 0.001]. Viewing pictures of tools evoked the weakest response in both hemispheres (P < 0.001; Figs. 3, 4, and 6). This is likely due to the fact that, given their typically elongated shape, the tool pictures covered a smaller amount of retinotopic space. Importantly, however, this indicates that the stronger tool-evoked responses observed in parietal and occipital-temporal cortices were not simply propagated from early visual areas.
DISCUSSION
We compared stimulus-evoked response profiles in early, ventral, and dorsal visual regions for four stimulus categories: tools, animals, graspable (non-tool) objects, and scrambled objects. We were particularly interested in the response profile in regions of the IPS that contain a topographic representation of visual space (IPS0–IPS5), as well as the human parietal grasp region, hPGR. A comparison of stimulus-evoked responses to the presentation of tools and animals in an independent localizer revealed a bias for tools in the anterior portion of the left parietal cortex, near the junction of the IPS and the postcentral gyrus. This region, which has been reported by previous studies using similar contrasts (Chao and Martin 2000; Valyear et al. 2007), was consistently located lateral, anterior, and inferior to IPS5 and lateral and inferior to hPGR, with some partial overlap of all three regions. Subsequent ROI-based time course analysis showed stronger tool-evoked activity throughout most regions of the IPS, especially in the left hemisphere. Of particular interest, whereas the response to tools was equally distributed across topographic regions of the IPS (IPS0–IPS5), the response evoked by the presentation of graspable objects was similar to that evoked by tools and stronger than that evoked by animals in posterior regions, whereas it was weaker than that evoked by tools and similar to that evoked by animals in anterior regions. This pattern of results indicates that the posterior IPS may encode basic visual features common to any graspable object (of which tools form a subset) and that anterior regions integrate this information with experience-dependent knowledge of action associations, affordances, and goals, which are uniquely linked to tools.
In our study, a tool-specific region was localized in the left anterior IPS, near the junction of the IPS and the postcentral sulcus. The general location of this tool-specific region is consistent with previous reports using similar localizers (Chao and Martin 2000; Valyear et al. 2007). One hypothesis is that this activation represents specific motor plans associated with the tools. Indeed, behavioral studies support the idea that viewing an object automatically invokes motor representations afforded by that object (Grezes et al. 2003; Humphreys et al. 2004; Masson et al. 2011; Tucker and Ellis 1998). However, Valyear et al. (2007) demonstrated that the tool-specific activation was distinct from a region of the anterior IPS specifically linked to overt grasping movements, referred to here as hPGR. Additionally, they noted that other graspable (non-tool) objects did not evoke the same strong response in this tool-specific region (see also Creem-Regehr and Lee 2005). We replicated both of these findings in the present study, although the relative location of hPGR and the tool-specific region in our study and the study by Valyear et al. (2007) differ. Whereas they report that tools (relative to animals) evoke stronger responses in a region posterior to hPGR, we found this region to be lateral and inferior (and, if anything, anterior) to hPGR. Although these differences may partially stem from different tasks and image analysis methods, the two studies are not completely inconsistent. We also observed tool-specific responses in regions posterior to hPGR, including IPS5, extending throughout the IPS.
The distinction between parietal regions associated with viewing grasping objects and viewing tools is also consistent with cross-species comparisons of humans and monkeys. Whereas so-called homologous regions for grasping have been reported in the anterior IPS of monkeys (AIP; Gallese et al. 1994; Murata et al. 2000; Nelissen and Vanduffel 2011) and humans (hPGR; Binkofski et al. 1998; Culham 2004; Culham et al. 2003; Frey et al. 2005), a region in the left rostral inferior parietal lobule of humans is uniquely recruited when viewing tool usage compared with hand actions (Peeters et al. 2009).
Rather than represent specific movement preparation, the tool-related activity may reflect experience-dependent knowledge of actions associated with tools. Lesions of the left posterior parietal cortex can lead to a form of apraxia known as ideomotor apraxia (Buxbaum et al. 2005a, 2005b; Johnson-Frey 2004). Ideomotor apraxics maintain the ability to grasp and manipulate objects but fail to grasp tools in a manner that is consistent with their function (Buxbaum et al. 2003; Goldenberg and Hagmann 1998; Sirigu et al. 1995). This indicates a dissociation between the neural mechanisms that support grasping an object (i.e., sensorimotor transformations) and those that support using an object (Binkofski and Buxbaum 2012; Johnson-Frey 2004). Interestingly, these patients may be able to recognize and name tools and describe their function but fail to demonstrate (i.e., pantomime) appropriate usage (Daprati and Sirigu 2006; Johnson-Frey 2004). On the basis of a quantitative analysis of lesion sites and behavioral deficits, Goldenberg and Spatt (2009) concluded that left posterior parietal cortex is necessary for understanding general principles of tool usage and mechanical interactions between objects, rather than prototypical uses or specific grips or movements associated with tools. Consistent with the patient literature, our data suggest that object information in the posterior IPS supports generic object grasping, whereas object information in the anterior IPS supports object manipulation.
In addition to highlighting the distinction between grasp-related hPGR and the left parietal tool-specific region, our data address the relationship between both of these areas and the topographic regions of the IPS. In particular, IPS5 is located just posterior to hPGR (see also Konen et al. 2013) and posterior, medial, and superior to the tool-specific region. However, there is some partial overlap between all of these regions, and they may act as a coordinated network to guide sophisticated object interactions. Previous reports indicate a functional correspondence between human IPS5 and area VIP in monkeys (Konen and Kastner 2008a; Silver and Kastner 2009). Both areas contain a coregistered, multimodal (tactile and visual) spatial representation for locations near the face (Duhamel et al. 1998; Sereno and Huang 2006), a preference for smooth-pursuit eye movements compared with saccades (Konen and Kastner 2008a; Schlack et al. 2003), selectivity for motion inducing optic flow patterns (Konen and Kastner 2008a; Schaafsma et al. 1997), and a consistent posterior anatomic location relative to grasp-related regions (Fig. 2; Grefkes and Fink 2005; Konen et al. 2013). Interestingly, the tool specificity that we observed in IPS5 may suggest that neural processes in macaque VIP provided an evolutionary foundation for the tool-specific circuit in humans. This idea is consistent with evidence from monkey physiology (Iriki et al. 1996), human psychophysics (Maravita et al. 2002), and human neuropsychology (Berti and Frassinetti 2000) showing that tool usage dynamically modifies the brain's internal “body schema,” a representation of posture and positioning in space that is hypothesized to be located in posterior parietal cortex. Tools extend the internal body schema to include the spatial regions around or reachable by the tool, which suggests an integration of the tool as an effector for actions (Graziano and Botvinick 2002; Maravita and Iriki 2004).
Regardless of the exact nature of the object-related representation in the anterior IPS, it is likely that this representation combines experience-dependent knowledge with visual input from more posterior regions of the dorsal pathway and from the ventral visual pathway. In monkeys, AIP has connections with posterior parietal areas such as lateral (LIP) and caudal intraparietal (CIP) areas, as well as inferior temporal areas such as TEO and TE (Borra et al. 2008; Nakamura et al. 2001). In addition to the object selectivity displayed by neurons in the ventral visual stream (Logothetis and Sheinberg 1996; Tanaka 1996), neurons in LIP display object-selective responses (Janssen et al. 2008; Sereno and Maunsell 1998) and neurons in area CIP show selectivity for three-dimensional (3D) object features such as surface orientation (Shikata et al. 1996; Taira et al. 2000; Tsutsui et al. 2001, 2002). Object information in posterior parietal regions may account for the spared ability of some patients with occipital-temporal lesions to adjust their hand appropriately when reaching to grasp objects (Dijkerman et al. 2004; Goodale et al. 1991; Karnath et al. 2009).
On the basis of its recruitment in surface orientation discrimination tasks, a region in the posterior IPS of humans has been proposed to be functionally homologous to macaque CIP (Shikata et al. 2001, 2003, 2008; Taira et al. 2001). Given our results, along with the previously observed similarity in topographic organization of human IPS0/1 and macaque CIP (Arcaro et al. 2011), the posterior topographic regions of the IPS (e.g., IPS0/1) may be functionally homologous to area CIP in the monkey. Additionally, on the basis of similarities across a variety of functional response properties, including object-selective responses (Janssen et al. 2008; Konen and Kastner 2008b; Sereno and Maunsell 1998), human IPS1/2 may be functionally homologous to macaque LIP (Silver and Kastner 2009). Konen and Kastner (2008b) reported a representation of basic object information for 2D and 3D objects, and line drawings of objects and tools in IPS1/2, similar to that in observed LOC. Both regions demonstrated characteristics of a high-level object recognition system; object selectivity, quantified with an adaptation paradigm, was both size and viewpoint invariant. Consistent with our results, Konen and Kastner (2008b) did not find any differences in the selectivity profile for line drawings of tools and generic objects in the posterior IPS.
Our results suggest a functional distinction between the representation of visual object-related information in the posterior and anterior portions of the IPS. The observed differences are consistent with a transformation of object information necessary to support object-directed actions (Goodale and Milner 1992). However, given the current evidence, it is unclear how much the anterior (and posterior) object representations are visual, motor, or a combination of both. Future studies are needed to more clearly define the features represented at each stage of the dorsal stream hierarchy and to uncover the specifics of the visual-motor transformation that takes place to guide object-directed behavior. Interestingly, our results indicate that this visual-motor transition occurs in the IPS of both hemispheres. Given the strongly lateralized network for categorizing and interacting with tools (Lewis 2006), it will be interesting for future studies to determine the contribution of each hemisphere to such tasks.
GRANTS
This work was supported by National Institutes of Health Grants 2R01 MH64043 and 1R01 EY017699 (to S. Kastner), National Science Foundation Grant BCS-1025149 (to S. Kastner), a National Research Service Award (to R. E. Mruczek), and funding from the Henry Luce Foundation (I. von Loga).
DISCLOSURES
No conflicts of interest, financial or otherwise, are declared by the authors.
AUTHOR CONTRIBUTIONS
R.E.M., I.S.v.L., and S.K. conception and design of research; R.E.M. and I.S.v.L. performed experiments; R.E.M. and I.S.v.L. analyzed data; R.E.M., I.S.v.L., and S.K. interpreted results of experiments; R.E.M. and I.S.v.L. prepared figures; R.E.M. and I.S.v.L. drafted manuscript; R.E.M., I.S.v.L., and S.K. edited and revised manuscript; R.E.M., I.S.v.L., and S.K. approved final version of manuscript.
REFERENCES
- Afraz SR, Kiani R, Esteky H. Microstimulation of inferotemporal cortex influences face categorization. Nature 442: 692–695, 2006 [DOI] [PubMed] [Google Scholar]
- Arcaro MJ, McMains SA, Singer BD, Kastner S. Retinotopic organization of human ventral visual cortex. J Neurosci 29: 10638–10652, 2009 [DOI] [PMC free article] [PubMed] [Google Scholar]
- Arcaro MJ, Pinsk MA, Li X, Kastner S. Visuotopic organization of macaque posterior parietal cortex: a functional magnetic resonance imaging study. J Neurosci 31: 2064–2078, 2011 [DOI] [PMC free article] [PubMed] [Google Scholar]
- Bandettini PA, Jesmanowicz A, Wong EC, Hyde JS. Processing strategies for time-course data sets in functional MRI of the human brain. Magn Reson Med 30: 161–173, 1993 [DOI] [PubMed] [Google Scholar]
- Berti A, Frassinetti F. When far becomes near: remapping of space by tool use. J Cogn Neurosci 12: 415–420, 2000 [DOI] [PubMed] [Google Scholar]
- Binkofski F, Buxbaum LJ. Two action systems in the human brain. Brain Lang. In press [DOI] [PMC free article] [PubMed] [Google Scholar]
- Binkofski F, Dohle C, Posse S, Stephan KM, Hefter H, Seitz RJ, Freund HJ. Human anterior intraparietal area subserves prehension: a combined lesion and functional MRI activation study. Neurology 50: 1253–1259, 1998 [DOI] [PubMed] [Google Scholar]
- Borra E, Belmalih A, Calzavara R, Gerbella M, Murata A, Rozzi S, Luppino G. Cortical connections of the macaque anterior intraparietal (AIP) area. Cereb Cortex 18: 1094–1111, 2008 [DOI] [PubMed] [Google Scholar]
- Brainard DH. The Psychophysics Toolbox. Spat Vis 10: 433–436, 1997 [PubMed] [Google Scholar]
- Buxbaum LJ, Johnson-Frey SH, Bartlett-Williams M. Deficient internal models for planning hand-object interactions in apraxia. Neuropsychologia 43: 917–929, 2005a [DOI] [PubMed] [Google Scholar]
- Buxbaum LJ, Kyle KM, Menon R. On beyond mirror neurons: internal representations subserving imitation and recognition of skilled object-related actions in humans. Brain Res Cogn Brain Res 25: 226–239, 2005b [DOI] [PubMed] [Google Scholar]
- Buxbaum LJ, Sirigu A, Schwartz MF, Klatzky R. Cognitive representations of hand posture in ideomotor apraxia. Neuropsychologia 41: 1091–1113, 2003 [DOI] [PubMed] [Google Scholar]
- Caspers S, Geyer S, Schleicher A, Mohlberg H, Amunts K, Zilles K. The human inferior parietal cortex: cytoarchitectonic parcellation and interindividual variability. Neuroimage 33: 430–448, 2006 [DOI] [PubMed] [Google Scholar]
- Cavina-Pratesi C, Monaco S, Fattori P, Galletti C, McAdam TD, Quinlan DJ, Goodale MA, Culham JC. Functional magnetic resonance imaging reveals the neural substrates of arm transport and grip formation in reach-to-grasp actions in humans. J Neurosci 30: 10306–10323, 2010 [DOI] [PMC free article] [PubMed] [Google Scholar]
- Chao LL, Haxby JV, Martin A. Attribute-based neural substrates in temporal cortex for perceiving and knowing about objects. Nat Neurosci 2: 913–919, 1999 [DOI] [PubMed] [Google Scholar]
- Chao LL, Martin A. Representation of manipulable man-made objects in the dorsal stream. Neuroimage 12: 478–484, 2000 [DOI] [PubMed] [Google Scholar]
- Choi SH, Na DL, Kang E, Lee KM, Lee SW, Na DG. Functional magnetic resonance imaging during pantomiming tool-use gestures. Exp Brain Res 139: 311–317, 2001 [DOI] [PubMed] [Google Scholar]
- Chouinard PA, Goodale MA. FMRI-adaptation to highly-rendered color photographs of animals and manipulable artifacts during a classification task. Neuroimage 59: 2941–2951, 2012 [DOI] [PubMed] [Google Scholar]
- Cox RW. AFNI: software for analysis and visualization of functional magnetic resonance neuroimages. Comput Biomed Res 29: 162–173, 1996 [DOI] [PubMed] [Google Scholar]
- Creem-Regehr SH, Lee JN. Neural representations of graspable objects: are tools special? Brain Res Cogn Brain Res 22: 457–469, 2005 [DOI] [PubMed] [Google Scholar]
- Culham JC. Human brain imaging reveals a parietal area specialized for grasping. In: Functional Neuroimaging of Visual Cognition: Attention and Performance XX, edited by Kanwisher N, Duncan J. Oxford: Oxford University Press, 2004, p. 417–438 [Google Scholar]
- Culham JC, Cavina-Pratesi C, Singhal A. The role of parietal cortex in visuomotor control: what have we learned from neuroimaging? Neuropsychologia 44: 2668–2684, 2006 [DOI] [PubMed] [Google Scholar]
- Culham JC, Danckert SL, DeSouza JF, Gati JS, Menon RS, Goodale MA. Visually guided grasping produces fMRI activation in dorsal but not ventral stream brain areas. Exp Brain Res 153: 180–189, 2003 [DOI] [PubMed] [Google Scholar]
- Dale AM, Fischl B, Sereno MI. Cortical surface-based analysis. I. Segmentation and surface reconstruction. Neuroimage 9: 179–194, 1999 [DOI] [PubMed] [Google Scholar]
- Daprati E, Sirigu A. How we interact with objects: learning from brain lesions. Trends Cogn Sci 10: 265–270, 2006 [DOI] [PubMed] [Google Scholar]
- Dijkerman HC, Le S, Demonet JF, Milner AD. Visuomotor performance in a patient with visual agnosia due to an early lesion. Brain Res Cogn Brain Res 20: 12–25, 2004 [DOI] [PubMed] [Google Scholar]
- Duhamel JR, Colby CL, Goldberg ME. Ventral intraparietal area of the macaque: congruent visual and somatic response properties. J Neurophysiol 79: 126–136, 1998 [DOI] [PubMed] [Google Scholar]
- Engel SA, Glover GH, Wandell BA. Retinotopic organization in human visual cortex and the spatial precision of functional MRI. Cereb Cortex 7: 181–192, 1997 [DOI] [PubMed] [Google Scholar]
- Fischl B, Sereno MI, Dale AM. Cortical surface-based analysis. II: Inflation, flattening, and a surface-based coordinate system. Neuroimage 9: 195–207, 1999 [DOI] [PubMed] [Google Scholar]
- Frey SH, Vinton D, Norlund R, Grafton ST. Cortical topography of human anterior intraparietal cortex active during visually guided grasping. Brain Res Cogn Brain Res 23: 397–405, 2005 [DOI] [PubMed] [Google Scholar]
- Fridman EA, Immisch I, Hanakawa T, Bohlhalter S, Waldvogel D, Kansaku K, Wheaton L, Wu T, Hallett M. The role of the dorsal stream for gesture production. Neuroimage 29: 417–428, 2006 [DOI] [PubMed] [Google Scholar]
- Friston KJ, Holmes AP, Poline JB, Grasby PJ, Williams SC, Frackowiak RS, Turner R. Analysis of fMRI time-series revisited. Neuroimage 2: 45–53, 1995 [DOI] [PubMed] [Google Scholar]
- Gallese V, Murata A, Kaseda M, Niki N, Sakata H. Deficit of hand preshaping after muscimol injection in monkey parietal cortex. Neuroreport 5: 1525–1529, 1994 [DOI] [PubMed] [Google Scholar]
- Goldenberg G, Hagmann S. Tool use and mechanical problem solving in apraxia. Neuropsychologia 36: 581–589, 1998 [DOI] [PubMed] [Google Scholar]
- Goldenberg G, Spatt J. The neural basis of tool use. Brain 132: 1645–1655, 2009 [DOI] [PubMed] [Google Scholar]
- Goodale MA, Milner AD. Separate visual pathways for perception and action. Trends Neurosci 15: 20–25, 1992 [DOI] [PubMed] [Google Scholar]
- Goodale MA, Milner AD, Jakobson LS, Carey DP. A neurological dissociation between perceiving objects and grasping them. Nature 349: 154–156, 1991 [DOI] [PubMed] [Google Scholar]
- Graziano MSA, Botvinick MM. How the brain represents the body: insights from neurophysiology and psychology. In: Common Mechanisms in Perception and Action: Attention and Performance XIX, edited by Prinz W, Hommel B. Oxford: Oxford University Press, 2002, p. 136–157 [Google Scholar]
- Grefkes C, Fink GR. The functional organization of the intraparietal sulcus in humans and monkeys. J Anat 207: 3–17, 2005 [DOI] [PMC free article] [PubMed] [Google Scholar]
- Grezes J, Tucker M, Armony J, Ellis R, Passingham RE. Objects automatically potentiate action: an fMRI study of implicit processing. Eur J Neurosci 17: 2735–2740, 2003 [DOI] [PubMed] [Google Scholar]
- Grill-Spector K, Kourtzi Z, Kanwisher N. The lateral occipital complex and its role in object recognition. Vision Res 41: 1409–1422, 2001 [DOI] [PubMed] [Google Scholar]
- Grill-Spector K, Kushnir T, Edelman S, Itzchak Y, Malach R. Cue-invariant activation in object-related areas of the human occipital lobe. Neuron 21: 191–202, 1998a [DOI] [PubMed] [Google Scholar]
- Grill-Spector K, Kushnir T, Hendler T, Edelman S, Itzchak Y, Malach R. A sequence of object-processing stages revealed by fMRI in the human occipital lobe. Hum Brain Mapp 6: 316–328, 1998b [DOI] [PMC free article] [PubMed] [Google Scholar]
- Haaland KY, Harrington DL, Knight RT. Neural representations of skilled movement. Brain 123: 2306–2313, 2000 [DOI] [PubMed] [Google Scholar]
- Humphreys GK, Riddoch MJ, Forti S, Ackroyd K. Action influences spatial perception: neuropsychological evidence. Vis Cogn 11: 401–427, 2004 [Google Scholar]
- Iriki A, Tanaka M, Iwamura Y. Coding of modified body schema during tool use by macaque postcentral neurones. Neuroreport 7: 2325–2330, 1996 [DOI] [PubMed] [Google Scholar]
- Janssen P, Srivastava S, Ombelet S, Orban GA. Coding of shape and position in macaque lateral intraparietal area. J Neurosci 28: 6679–6690, 2008 [DOI] [PMC free article] [PubMed] [Google Scholar]
- Jenkinson M. Improved unwarping of EPI volumes using regularised B0 maps. In: Seventh Annual Meeting of the Organization for Human Brain Mapping, Brighton, UK, 2001 [Google Scholar]
- Jezzard P, Balaban RS. Correction for geometric distortion in echo planar images from B0 field variations. Magn Reson Med 34: 65–73, 1995 [DOI] [PubMed] [Google Scholar]
- Johnson-Frey SH. The neural bases of complex tool use in humans. Trends Cogn Sci 8: 71–78, 2004 [DOI] [PubMed] [Google Scholar]
- Johnson-Frey SH, Newman-Norlund R, Grafton ST. A distributed left hemisphere network active during planning of everyday tool use skills. Cereb Cortex 15: 681–695, 2005 [DOI] [PMC free article] [PubMed] [Google Scholar]
- Karnath HO, Ruter J, Mandler A, Himmelbach M. The anatomy of object recognition–visual form agnosia caused by medial occipitotemporal stroke. J Neurosci 29: 5854–5862, 2009 [DOI] [PMC free article] [PubMed] [Google Scholar]
- Kastner S, DeSimone K, Konen CS, Szczepanski SM, Weiner KS, Schneider KA. Topographic maps in human frontal cortex revealed in memory-guided saccade and spatial working-memory tasks. J Neurophysiol 97: 3494–3507, 2007 [DOI] [PubMed] [Google Scholar]
- Konen CS, Kastner S. Representation of eye movements and stimulus motion in topographically organized areas of human posterior parietal cortex. J Neurosci 28: 8361–8375, 2008a [DOI] [PMC free article] [PubMed] [Google Scholar]
- Konen CS, Kastner S. Two hierarchically organized neural systems for object information in human visual cortex. Nat Neurosci 11: 224–231, 2008b [DOI] [PubMed] [Google Scholar]
- Konen CS, Mruczek REB, Montoya JL, Kastner S. Functional organization of human posterior parietal cortex: grasping- and reaching-related activations relative to topographically organized cortex. J Neurophysiol (March 20, 2013). doi: 10.1152/jn.00657.2012 [DOI] [PMC free article] [PubMed] [Google Scholar]
- Kourtzi Z, Kanwisher N. Cortical regions involved in perceiving object shape. J Neurosci 20: 3310–3318, 2000 [DOI] [PMC free article] [PubMed] [Google Scholar]
- Kourtzi Z, Kanwisher N. Representation of perceived object shape by the human lateral occipital complex. Science 293: 1506–1509, 2001 [DOI] [PubMed] [Google Scholar]
- Lauritzen TZ, D'Esposito M, Heeger DJ, Silver MA. Top-down flow of visual spatial attention signals from parietal to occipital cortex. J Vis 9: 18 11–14, 2009 [DOI] [PMC free article] [PubMed] [Google Scholar]
- Levy I, Schluppeck D, Heeger DJ, Glimcher PW. Specificity of human cortical areas for reaches and saccades. J Neurosci 27: 4687–4696, 2007 [DOI] [PMC free article] [PubMed] [Google Scholar]
- Lewis JW. Cortical networks related to human use of tools. Neuroscientist 12: 211–231, 2006 [DOI] [PubMed] [Google Scholar]
- Logothetis NK, Sheinberg DL. Visual object recognition. Annu Rev Neurosci 19: 577–621, 1996 [DOI] [PubMed] [Google Scholar]
- Malach R, Reppas JB, Benson RR, Kwong KK, Jiang H, Kennedy WA, Ledden PJ, Brady TJ, Rosen BR, Tootell RB. Object-related activity revealed by functional magnetic resonance imaging in human occipital cortex. Proc Natl Acad Sci USA 92: 8135–8139, 1995 [DOI] [PMC free article] [PubMed] [Google Scholar]
- Maravita A, Iriki A. Tools for the body (schema). Trends Cogn Sci 8: 79–86, 2004 [DOI] [PubMed] [Google Scholar]
- Maravita A, Spence C, Kennett S, Driver J. Tool-use changes multimodal spatial interactions between vision and touch in normal humans. Cognition 83: B25–B34, 2002 [DOI] [PubMed] [Google Scholar]
- Martin A, Wiggs CL, Ungerleider LG, Haxby JV. Neural correlates of category-specific knowledge. Nature 379: 649–652, 1996 [DOI] [PubMed] [Google Scholar]
- Masson ME, Bub DN, Breuer AT. Priming of reach and grasp actions by handled objects. J Exp Psychol Hum Percept Perform 37: 1470–1484, 2011 [DOI] [PubMed] [Google Scholar]
- Murata A, Gallese V, Luppino G, Kaseda M, Sakata H. Selectivity for the shape, size, and orientation of objects for grasping in neurons of monkey parietal area AIP. J Neurophysiol 83: 2580–2601, 2000 [DOI] [PubMed] [Google Scholar]
- Nakamura H, Kuroda T, Wakita M, Kusunoki M, Kato A, Mikami A, Sakata H, Itoh K. From three-dimensional space vision to prehensile hand movements: the lateral intraparietal area links the area V3A and the anterior intraparietal area in macaques. J Neurosci 21: 8174–8187, 2001 [DOI] [PMC free article] [PubMed] [Google Scholar]
- Nelissen K, Vanduffel W. Grasping-related functional magnetic resonance imaging brain responses in the macaque monkey. J Neurosci 31: 8220–8229, 2011 [DOI] [PMC free article] [PubMed] [Google Scholar]
- Peeters R, Simone L, Nelissen K, Fabbri-Destro M, Vanduffel W, Rizzolatti G, Orban GA. The representation of tool use in humans and monkeys: common and uniquely human features. J Neurosci 29: 11523–11539, 2009 [DOI] [PMC free article] [PubMed] [Google Scholar]
- Pelli DG. The VideoToolbox software for visual psychophysics: transforming numbers into movies. Spat Vis 10: 437–442, 1997 [PubMed] [Google Scholar]
- Pinsk MA, DeSimone K, Moore T, Gross CG, Kastner S. Representations of faces and body parts in macaque temporal cortex: a functional MRI study. Proc Natl Acad Sci USA 102: 6996–7001, 2005 [DOI] [PMC free article] [PubMed] [Google Scholar]
- Saad ZS, Reynolds RC, Argall B, Japee S, Cox RW. SUMA: an interface for surface-based intra- and inter-subject analysis with AFNI. In: IEEE International Symposium on Biomedical Imaging: From Nano to Macro Arlington, VA: IEEE, 2004, p. 1510–1513 [Google Scholar]
- Schaafsma SJ, Duysens J, Gielen CC. Responses in ventral intraparietal area of awake macaque monkey to optic flow patterns corresponding to rotation of planes in depth can be explained by translation and expansion effects. Vis Neurosci 14: 633–646, 1997 [DOI] [PubMed] [Google Scholar]
- Scheperjans F, Eickhoff SB, Homke L, Mohlberg H, Hermann K, Amunts K, Zilles K. Probabilistic maps, morphometry, and variability of cytoarchitectonic areas in the human superior parietal cortex. Cereb Cortex 18: 2141–2157, 2008 [DOI] [PMC free article] [PubMed] [Google Scholar]
- Schlack A, Hoffmann KP, Bremmer F. Selectivity of macaque ventral intraparietal area (area VIP) for smooth pursuit eye movements. J Physiol 551: 551–561, 2003 [DOI] [PMC free article] [PubMed] [Google Scholar]
- Schluppeck D, Curtis CE, Glimcher PW, Heeger DJ. Sustained activity in topographic areas of human posterior parietal cortex during memory-guided saccades. J Neurosci 26: 5098–5108, 2006 [DOI] [PMC free article] [PubMed] [Google Scholar]
- Schluppeck D, Glimcher P, Heeger DJ. Topographic organization for delayed saccades in human posterior parietal cortex. J Neurophysiol 94: 1372–1384, 2005 [DOI] [PMC free article] [PubMed] [Google Scholar]
- Sereno AB, Maunsell JH. Shape selectivity in primate lateral intraparietal cortex. Nature 395: 500–503, 1998 [DOI] [PubMed] [Google Scholar]
- Sereno MI, Dale AM, Reppas JB, Kwong KK, Belliveau JW, Brady TJ, Rosen BR, Tootell RB. Borders of multiple visual areas in humans revealed by functional magnetic resonance imaging. Science 268: 889–893, 1995 [DOI] [PubMed] [Google Scholar]
- Sereno MI, Huang RS. A human parietal face area contains aligned head-centered visual and tactile maps. Nat Neurosci 9: 1337–1343, 2006 [DOI] [PubMed] [Google Scholar]
- Sereno MI, Pitzalis S, Martinez A. Mapping of contralateral space in retinotopic coordinates by a parietal cortical area in humans. Science 294: 1350–1354, 2001 [DOI] [PubMed] [Google Scholar]
- Sheremata SL, Bettencourt KC, Somers DC. Hemispheric asymmetry in visuotopic posterior parietal cortex emerges with visual short-term memory load. J Neurosci 30: 12581–12588, 2010 [DOI] [PMC free article] [PubMed] [Google Scholar]
- Shikata E, Hamzei F, Glauche V, Knab R, Dettmers C, Weiller C, Buchel C. Surface orientation discrimination activates caudal and anterior intraparietal sulcus in humans: an event-related fMRI study. J Neurophysiol 85: 1309–1314, 2001 [DOI] [PubMed] [Google Scholar]
- Shikata E, Hamzei F, Glauche V, Koch M, Weiller C, Binkofski F, Buchel C. Functional properties and interaction of the anterior and posterior intraparietal areas in humans. Eur J Neurosci 17: 1105–1110, 2003 [DOI] [PubMed] [Google Scholar]
- Shikata E, McNamara A, Sprenger A, Hamzei F, Glauche V, Buchel C, Binkofski F. Localization of human intraparietal areas AIP, CIP, and LIP using surface orientation and saccadic eye movement tasks. Hum Brain Mapp 29: 411–421, 2008 [DOI] [PMC free article] [PubMed] [Google Scholar]
- Shikata E, Tanaka Y, Nakamura H, Taira M, Sakata H. Selectivity of the parietal visual neurones in 3D orientation of surface of stereoscopic stimuli. Neuroreport 7: 2389–2394, 1996 [DOI] [PubMed] [Google Scholar]
- Silver MA, Kastner S. Topographic maps in human frontal and parietal cortex. Trends Cogn Sci 13: 488–495, 2009 [DOI] [PMC free article] [PubMed] [Google Scholar]
- Silver MA, Ress D, Heeger DJ. Topographic maps of visual spatial attention in human parietal cortex. J Neurophysiol 94: 1358–1371, 2005 [DOI] [PMC free article] [PubMed] [Google Scholar]
- Singhal A, Kaufman L, Valyear KF, Culham A. fMRI reactivation of the human lateral occipital complex during delayed actions to remembered objects. Vis Cogn 14: 122–125, 2006 [Google Scholar]
- Sirigu A, Cohen L, Duhamel JR, Pillon B, Dubois B, Agid Y. A selective impairment of hand posture for object utilization in apraxia. Cortex 31: 41–55, 1995 [DOI] [PubMed] [Google Scholar]
- Smith SM, Jenkinson M, Woolrich MW, Beckmann CF, Behrens TE, Johansen-Berg H, Bannister PR, De Luca M, Drobnjak I, Flitney DE, Niazy RK, Saunders J, Vickers J, Zhang Y, De Stefano N, Brady JM, Matthews PM. Advances in functional and structural MR image analysis and implementation as FSL. Neuroimage 23, Suppl 1: S208–219, 2004 [DOI] [PubMed] [Google Scholar]
- Swisher JD, Halko MA, Merabet LB, McMains SA, Somers DC. Visual topography of human intraparietal sulcus. J Neurosci 27: 5326–5337, 2007 [DOI] [PMC free article] [PubMed] [Google Scholar]
- Szczepanski SM, Konen CS, Kastner S. Mechanisms of spatial attention control in frontal and parietal cortex. J Neurosci 30: 148–160, 2010 [DOI] [PMC free article] [PubMed] [Google Scholar]
- Taira M, Nose I, Inoue K, Tsutsui K. Cortical areas related to attention to 3D surface structures based on shading: an fMRI study. Neuroimage 14: 959–966, 2001 [DOI] [PubMed] [Google Scholar]
- Taira M, Tsutsui KI, Jiang M, Yara K, Sakata H. Parietal neurons represent surface orientation from the gradient of binocular disparity. J Neurophysiol 83: 3140–3146, 2000 [DOI] [PubMed] [Google Scholar]
- Tanaka K. Inferotemporal cortex and object vision. Annu Rev Neurosci 19: 109–139, 1996 [DOI] [PubMed] [Google Scholar]
- Tsutsui K, Jiang M, Yara K, Sakata H, Taira M. Integration of perspective and disparity cues in surface-orientation-selective neurons of area CIP. J Neurophysiol 86: 2856–2867, 2001 [DOI] [PubMed] [Google Scholar]
- Tsutsui K, Sakata H, Naganuma T, Taira M. Neural correlates for perception of 3D surface orientation from texture gradient. Science 298: 409–412, 2002 [DOI] [PubMed] [Google Scholar]
- Tucker M, Ellis R. On the relations between seen objects and components of potential actions. J Exp Psychol Hum Percept Perform 24: 830–846, 1998 [DOI] [PubMed] [Google Scholar]
- Ungerleider LG, Mishkin M. Two cortical visual systems. In: Analysis of Visual Behavior, edited by Ingle DJ, Goodale MA, Mansfield RJ. Cambridge, MA: MIT Press, 1982, p. 549–586 [Google Scholar]
- Valyear KF, Cavina-Pratesi C, Stiglick AJ, Culham JC. Does tool-related fMRI activity within the intraparietal sulcus reflect the plan to grasp? Neuroimage 36, Suppl 2: T94–T108, 2007 [DOI] [PubMed] [Google Scholar]