

Abstract
The purpose of this study was to determine whether brisk walking improves multiorgan (liver, muscle, adipose tissue) insulin sensitivity in older women. Ten nonobese older women (age: 66.7 ± 1.5 yr, mean ± SE) completed two 2-stage hyperinsulinemic-euglycemic clamp procedures [insulin infusion rate stage 1: 10 mU/m2 body surface area (BSA) per min; stage 2: 50 mU/m2 BSA per min] in conjunction with stable isotope-labeled glucose and palmitate tracer infusions: one in the morning after a single, ∼1-h bout of brisk treadmill walking, the other after an equivalent period of rest in the late afternoon of the preceding day. We found that basal glucose rate of appearance (Ra) into plasma was not different after rest and after exercise (17.3 ± 0.8 and 17.1 ± 0.4 μmol/kg fat-free mass per min, respectively). The insulin-mediated decrease in glucose Ra during stage 1 of the clamp was also not different after rest and exercise (82.2% ± 3.4% and 77.7% ± 2.1%, respectively), but glucose rate of disappearance (Rd) during stage 2 of the clamp was significantly greater (P < 0.05) after exercise than rest (88.0 ± 5.9 and 78.4 ± 6.5 μmol/kg fat-free mass per min, respectively). There were no differences in palmitate Ra during basal conditions or insulin infusion after exercise and after rest. Therefore, we conclude that a single bout of brisk walking for ∼1 h improves muscle insulin sensitivity but has no effect on liver and adipose tissue insulin sensitivity in older women.
Keywords: insulin sensitivity, exercise, older adults
insulin resistance is an important risk factor for type 2 diabetes mellitus and cardiovascular disease (17, 34). Aerobic exercise has very potent insulin-sensitizing effects (4, 21) and regular physical activity is the cornerstone for maintaining insulin sensitivity and metabolic health. The beneficial effect of exercise on insulin sensitivity is transient and lasts for only a couple of days after an exercise session in young and middle-aged adults; thereafter it returns to baseline values even in highly trained athletes (2, 5, 10, 25, 29, 30, 32). Improved insulin sensitivity occurs in many tissues [muscle, liver, adipose tissue (9, 11, 19, 20, 27, 35)] after exercise but skeletal muscle insulin sensitivity is the most comprehensively studied feature and is mediated by a transient increase in insulin-mediated translocation of GLUT4 to the cell surface (18, 21, 23). The cellular signaling pathways mediating this response are not yet fully understood but lie downstream from and do not involve the classic, proximal insulin signaling cascade including IRS1, PI3K, and Akt (21, 23). On the other hand, it is well-established that GLUT4 translocation is directly related to the degree of glycogen breakdown (21, 23). Consequently, exercise intensity and volume modulate the magnitude of the improvement in insulin sensitivity in muscle (3, 11, 12, 28), and it has been suggested that a threshold for an exercise-induced insulin-sensitizing effect equivalent to approximately 1 h of moderate intensity exercise may exist in young and middle-aged adults (28). The American College of Sports Medicine and the United States Department of Health and Human Services recommend a minimum of 150 min (but ideally 300 min) of moderate-intensity exercise a week for adults (i.e., 30–60 min of exercise on ≥5 days a week) (14, 39). Whether this is adequate for older adults is not known. Although older adults retain the ability to improve insulin sensitivity through exercise (8, 11, 13, 22, 24, 27, 38), studies in older adults to date have focused solely on high-intensity and/or high-volume exercise (8, 11, 13, 15, 22, 24, 27, 36, 38), and some investigators report no improvement even after intense exercise training (15, 36).
The purpose of this study was to determine whether a single session of brisk walking improves insulin sensitivity in older adults. The two-stage hyperinsulinemic-euglycemic clamp procedure in conjunction with stable isotope-labeled glucose and palmitate tracer infusions was used to evaluate insulin sensitivity in the liver, muscle, and adipose tissue. A low-dose insulin infusion was used to evaluate the ability of insulin to suppress the endogenous rates of appearance (Ra) of glucose (an index of hepatic glucose production) and palmitate (an index of adipose tissue lipolytic rate) in plasma; both endogenous glucose production and adipose tissue lipolysis are exquisitely sensitive to insulin and are nearly completely suppressed at plasma insulin concentrations in the postprandial range (16, 33). A “high-dose” insulin infusion resulting in postprandial plasma insulin concentrations was used to evaluate the ability of insulin to stimulate glucose rate of disappearance (Rd) from plasma (an index of muscle glucose uptake) (7, 33).
MATERIALS AND METHODS
Subjects and Screening Evaluations
Ten healthy, nonobese older women (66.7 ± 1.5 yr, mean ± SE, age range 60–73 yr) participated in this study (Table 1), which was approved by the Institutional Review Board of Washington University School of Medicine in St. Louis, MO. Written informed consent was obtained from all subjects before participation in the study. None of the subjects smoked and all were weight stable (±1 kg) and sedentary (<20 min of exercise no more than 3 times/wk) for at least 3 mo before entering the study. All subjects completed a comprehensive medical examination, including a detailed history and physical examination, a resting electrocardiogram, standard blood tests, and an oral glucose tolerance test. Blood tests included complete metabolic panel, complete blood count, blood lipids, and thyroid-stimulating hormone. Standard cut-offs that are used in our hospital and associated clinics for above/below normal values were used to include or exclude subjects. During the oral glucose tolerance test, a 75-g glucose drink (Azer Scientific, Morgantown, VA) was consumed within 3 min, and blood samples to measure plasma glucose concentration were obtained immediately before and 2 h after consumption of the drink; subjects were seated in a chair for the duration of the glucose tolerance test. Subjects with diabetes, impaired fasting glucose, or impaired glucose tolerance based on American Diabetes Association criteria (1) were excluded from the study. None of the subjects had evidence of illness, or were taking medications known to affect carbohydrate or lipid metabolism. Body composition was determined by using dual-energy X-ray absorptiometry (Hologic QDR 1000/w; Hologic, Waltham, MA).
Table 1.
Subjects' body composition, aerobic fitness, and basal (overnight fasted) metabolic variables at screening
| Parameter | Value |
|---|---|
| Body weight, kg | 68.2 ± 2.6 |
| Body mass index, kg/m2 | 24.9 ± 0.9 |
| Fat-free mass, kg | 41.8 ± 1.1 |
| Body fat, % | 38.6 ± 1.3 |
| V̇o2peak, ml·kg body wt−1·min−1 | 22.2 ± 1.1 |
| Glucose, mg/dl | 86.6 ± 1.4 |
| Triglycerides, mg/dl | 81 ± 12 |
| Total cholesterol, mg/dl | 188 ± 11 |
| HDL-cholesterol, mg/dl | 61 ± 6 |
| LDL-cholesterol, mg/dl | 111 ± 9 |
Data are means ± SE. V̇o2peak, peak oxygen consumption; HDL, high-density lipoprotein; LDL, low-density lipoprotein.
Peak oxygen consumption (V̇o2peak) was evaluated during a graded exercise test on a treadmill. Heart rhythm and rate were continuously monitored (Marquette MAX-1, Sandy, UT), and expired air was analyzed by using a metabolic cart (ParvoMedics TrueOne 2400, Sandy, UT). Subjects walked at a constant speed, and the inclination of the treadmill was increased by 3% every 2 min until volitional exhaustion and two of the following criteria were achieved: respiratory exchange ratio ≥ 1.15; heart rate greater than the age-predicted maximum [220- age (yr)]; or plateau in V̇o2.
Exercise Protocol and Metabolic Testing
All subjects completed two 2-stage hyperinsulinemic-euglycemic clamp procedures separated by 2–5 wk at the Washington University School of Medicine Clinical Research Unit. One of the clamp procedures was performed after subjects completed a single bout of treadmill exercise in the afternoon before the day of the clamp procedure. The other clamp procedure was performed after an equivalent period of rest. The sequence of the clamp procedures was randomized: five women completed the postexercise clamp first and the other five completed the postexercise clamp second. All subjects were instructed by our Clinical Research Unit dieticians to abstain from alcohol and caffeine and to consume a weight-maintaining diet that is consistent with the current public health guidelines and contained at least 150 g of carbohydrate per day for at least 3 days before each trial. In between trials they were instructed to maintain their usual diet and physical activity habits.
For each clamp procedure, subjects were admitted to the Clinical Research Unit in the afternoon. Starting at ∼1630, they completed the exercise (or rested in a chair) as described below. At 1900, they consumed a standard meal containing 12 kcal/kg adjusted body wt (i.e., ∼800 kcal), 55% of total energy as carbohydrates (i.e., 6.6 kcal/kg or ∼110 g of carbohydrates), 30% as fat, and 15% as protein. Adjusted body weight was calculated as ideal body weight [the midpoint of the medium frame of the Metropolitan Life Insurance Company Table (28a)] + 0.25 × (actual body weight − ideal body weight). Subjects then fasted, except for water, until the completion of the clamp procedure the next day.
Exercise protocol.
The afternoon exercise session consisted of a bout of moderate-intensity (60% V̇o2peak) walking on a treadmill. During the exercise, expired air was analyzed periodically by using a metabolic cart (ParvoMedics TrueOne 2400) to ensure the appropriate exercise intensity was achieved. The duration of exercise was variable and terminated when subjects achieved a total energy expenditure of 3.5 kcal/kg body wt, based on the volume of the oxygen consumed. We based the duration of the exercise bout on the total amount of energy expended rather than a fixed time period to minimize differences in energy and substrate use between subjects.
Hyperinsulinemic-euglycemic clamp procedure.
At 0600, a catheter was inserted into a forearm vein for stable isotope-labeled tracer (purchased from Cambridge Isotope Laboratories, Andover, MA) infusions. A second catheter was inserted into a contralateral hand vein for blood sampling. The hand was heated to 55°C by using a thermostatically controlled box to obtain arterialized blood samples. At 0700, a bolus of [6,6-2H2]glucose (18 μmol/kg), dissolved in 0.9% NaCl solution, was administered through the catheter in the forearm vein, followed by a constant infusion of [6,6-2H2]glucose (0.22 μmol·kg−1·min−1) dissolved in 0.9% NaCl solution. At 0830, a constant infusion of [2,2-2H2]palmitate (0.03 μmol·kg−1·min−1), dissolved in a 25% human albumin solution, was started. At 1000, a hyperinsulinemic-euglycemic clamp procedure was initiated. During stage 1 of the clamp (3.0–5.5 h from the start of the glucose tracer infusion), insulin was infused at 10 mU/m2 body surface area (BSA) per minute (following a two-step priming dose of 40 mU/m2 BSA per minute for 5 min and 20 mU/m2 BSA per minute for 5 min, respectively). At 1230, stage 2 of the clamp procedure (5.5–9.0 h) was initiated by a two-step priming dose of insulin (200 mU/m2 BSA per minute for 5 min and 100 mU/m2 BSA per minute for 5 min), followed by constant infusion at 50 mU/m2 BSA per minute. Euglycemia was maintained at a plasma glucose concentration of ∼100 mg/dl by variable-rate infusion of 20% dextrose (enriched with [6,6-2H2]glucose) (7). The [6,6-2H2]glucose and [2,2-2H2]palmitate infusion rates were reduced by 50% of basal infusion rates during the first stage of the clamp to account for the insulin-mediated suppression of glucose and palmitate Ra (7).
Sample Collection and Analysis
Blood samples were obtained before the tracer administration to determine plasma insulin, glucagon, glucose, and free fatty acid (FFA) concentrations, and background tracer-to-tracee ratio (TTR) of glucose and palmitate, and every 10 min during the last 30 min of the basal period and each stage of the clamp procedure to determine glucose and fatty acid kinetics and plasma glucose, glucagon, insulin and FFA concentrations. Blood samples to monitor blood glucose concentration were collected every 10 min throughout the insulin infusion. Blood samples were collected in chilled tubes containing heparin to determine plasma glucose and insulin concentrations. The remaining samples were collected in chilled tubes containing EDTA. Plasma was separated by centrifugation within 30 min of collection and stored at −80°C until final analyses were performed.
Plasma glucose concentration was determined by using an automated glucose analyzer (YSI 2300 STAT plus; Yellow Springs Instrument, Yellow Springs, OH). Plasma insulin concentration was measured by using an automated chemoluminescent immunoanalyzer (IMMULITE, Siemens Healthcare Diagnostic, Los Angeles, CA). Plasma glucagon concentration was measured by using a radioimmunoassay (EMD Millipore, Billerica, MA). Plasma FFA concentrations were quantified by gas chromatography (Hewlett-Packard 5890-II, Palo Alto, CA) after adding heptadecanoic acid to plasma as an internal standard (31). Plasma glucose and palmitate TTR were determined by using gas chromatography/mass spectroscopy (MSD 5973 system with capillary column; Hewlett-Packard) (31).
Calculations
Isotopic steady states were achieved during the final 30 min of the basal period and stages 1 and 2 of the clamp procedure (Table 2), and Steele's equation for steady-state conditions was used to calculate substrate kinetics (37). During isotopic and metabolic steady-state conditions, total glucose rate of appearance (Ra) in plasma equals total glucose rate of disappearance (Rd) from plasma; accordingly, glucose Rd during the basal period and stages 1 and 2 of the clamp procedure was calculated as the sum of unlabeled glucose Ra (calculated by dividing the glucose tracer infusion rate by the average plasma glucose TTR during the last 30 min of the basal period and stages 1 and 2 of the clamp procedure) and the glucose tracer infusion rate. Endogenous glucose Ra was calculated by subtracting the glucose infusion rate (labeled and unlabeled) from total glucose Rd. Palmitate Ra into plasma was calculated by dividing the palmitate tracer infusion rate by the average plasma palmitate TTR during the final 30 min of the basal and stage 1 of the clamp procedure.
Table 2.
Plasma glucose tracer-to-tracee ratios during basal conditions and stages 1 and 2 of the hyperinsulinemic-euglycemic clamp procedure
| Sample | Rest | Exercise |
|---|---|---|
| Basal | ||
| 1 | 0.021 ± 0.0014 | 0.020 ± 0.0007 |
| 2 | 0.020 ± 0.0013 | 0.021 ± 0.0007 |
| 3 | 0.021 ± 0.0013 | 0.021 ± 0.0007 |
| 4 | 0.021 ± 0.0014 | 0.020 ± 0.0007 |
| Stage 1 | ||
| 1 | 0.027 ± 0.0009 | 0.026 ± 0.0007 |
| 2 | 0.027 ± 0.0007 | 0.026 ± 0.0007 |
| 3 | 0.027 ± 0.0012 | 0.026 ± 0.0006 |
| 4 | 0.027 ± 0.0010 | 0.026 ± 0.0009 |
| Stage 2 | ||
| 1 | 0.025 ± 0.0009 | 0.025 ± 0.0008 |
| 2 | 0.025 ± 0.0011 | 0.025 ± 0.0006 |
| 3 | 0.026 ± 0.0010 | 0.025 ± 0.0007 |
| 4 | 0.026 ± 0.0009 | 0.026 ± 0.0010 |
Data are means ± SE. Four blood samples each (1–4) were collected during the last 30 min of the basal period and each stage of the clamp procedure. See text for details.
Statistical Analysis
Data are reported as means ± SE. Paired Student's t-test was used to compare basal plasma glucose, insulin, and FFA concentrations after exercise and rest. Repeated-measures analysis of variance with subject condition (exercise vs. rest) and clamp period (basal vs. stage 1 or 2 of the clamp) was used to evaluate the effect of exercise on plasma glucagon concentration and glucose and palmitate kinetics. A P value of ≤0.05 was considered statistically significant.
RESULTS
By design, all subjects performed the same amount of work in relationship to total body weight during the exercise session (i.e., 3.5 kcal/kg body wt), which lasted on average 54 ± 2 min. The absolute amount of work performed ranged from 193 to 275 kcal, and subjects burned 139 ± 17 kcal (∼2.1 kcal/kg) as carbohydrates (i.e., ∼35 g carbohydrates) and 92 ± 11 kcal (∼1.4 kcal/kg) as fat (i.e., ∼10 g lipids).
Basal plasma glucose concentration after exercise was marginally, but statistically significantly, lower than after rest (87.6 ± 1.3 vs. 90.7 ± 1.6 mg/dl, P = 0.019). Basal plasma insulin (6.3 ± 1.5 vs. 7.2 ± 1.8 mU/l, P = 0.20), glucagon (58 ± 4 vs. 59 ± 3 pg/ml, P = 0.72), and FFA (0.53 ± 0.06 vs. 0.48 ± 0.05 mM, P = 0.40) concentrations were not significantly different after exercise and rest. There were no differences in basal glucose Ra (696 ± 22 vs. 707 ± 38 μmol/min, P = 0.74) or basal palmitate Ra (71.6 ± 6.4 vs. 68.0 ± 4.8 μmol/min, P = 0.53) after exercise and after rest (Figs. 1 and 2).
Fig. 1.
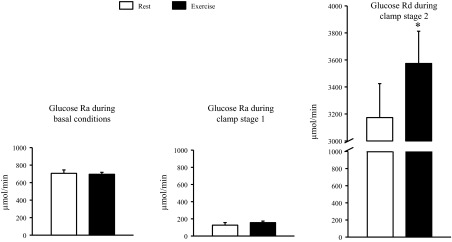
Glucose rates of appearance (Ra) in and disappearance (Rd) from plasma during basal conditions and during the hyperinsulinemic-euglycemic clamp procedures after rest and after exercise. Data are means ± SE. Left: glucose Ra during basal conditions. Middle: glucose Ra during stage 1 of the hyperinsulinemic-euglycemic procedure [insulin infusion rate: 10 mU/m2 body surface area (BSA) per min]. Right: glucose Rd during stage 2 of the hyperinsulinemic-euglycemic clamp procedure (insulin infusion rate: 50 mU/m2 BSA per min). *Value significantly different from corresponding value after rest (P = 0.038).
Fig. 2.

Palmitate rate of appearance (Ra) in plasma during basal conditions and stage 1 of the hyperinsulinemic-euglycemic clamp procedure (insulin infusion rate: 10 mU/m2 BSA per min) after rest and after exercise. Data are means ± SE.
During the hyperinsulinemic-euglycemic clamp procedure, plasma insulin concentration increased to 19.8 ± 2.6 and 20.0 ± 2.4 mU/l (P = 0.84) during stage 1 and to 75.7 ± 5.3 and 76.7 ± 4.7 mU/l (P = 0.76) during stage 2 after exercise and rest, respectively. Plasma glucagon concentration decreased to 39 ± 1 and 39 ± 3 pg/ml during stage 1 and to 30 ± 1 and 34 ± 3 pg/ml during stage 2 after exercise and rest, respectively (significant effect of insulin infusion, P < 0.01 but no significant effect of trial or trial × insulin infusion interaction). Euglycemia was successfully maintained, and the average plasma glucose concentration was similar after exercise and rest (stage 1: 101.3 ± 0.9 vs. 99.7 ± 1.1 mg/dl, respectively; stage 2: 102.7 ± 1.4 vs. 102.3 ± 0.8 mg/dl, respectively).
Low-dose insulin infusion caused a significant decrease (by ∼80%; P < 0.001) in glucose Ra, and the insulin-mediated suppression of glucose Ra was not different after rest and exercise (Fig. 1). High-dose insulin infusion nearly completely suppressed endogenous glucose Ra (to 5 ± 3% and 6 ± 4% of basal values after exercise and rest, respectively) and increased glucose Rd by ∼3-fold above basal values; the insulin-stimulated glucose Rd was ∼20% greater after exercise than rest (2,864 ± 242 vs. 2,452 ± 266 μmol/min above basal values, respectively, P = 0.037) (Fig. 1). The same was true when glucose Rd was adjusted for small individual differences in plasma insulin concentrations during the clamp: the glucose Rd-to-plasma insulin concentration ratio was 18 ± 7% greater after exercise than rest (P = 0.05).
Low-dose insulin infusion significantly suppressed palmitate Ra (by ∼75%; P < 0.001), and the insulin-mediated decrease was not different after exercise and rest (Fig. 2).
DISCUSSION
The insulin-sensitizing effect of aerobic exercise has been known for several decades and affects many tissues (muscle, liver, adipose tissue), but skeletal muscle insulin sensitivity is the most comprehensively studied feature (21, 23). It is now clear that the exercise-induced improvement in insulin sensitivity is transient and lasts for only ∼48 h after an exercise session (2, 5, 10, 25, 29, 30, 32); the magnitude of the effect, in muscle, appears to be directly related to exercise volume and/or intensity (3, 11, 12, 28). In this study we evaluated the effect of a brisk evening treadmill walk on multiorgan insulin sensitivity on the day after the exercise by using the two-stage hyperinsulinemic-euglycemic clamp procedure in conjunction with stable isotope-labeled glucose and palmitate tracer infusions in nonobese, 60- to 75-yr-old women. The walk, which was consistent with current public health recommendations for physical activity in terms of intensity and duration, improved insulin-stimulated glucose disposal but had no effect on insulin-stimulated suppression of glucose and palmitate Ra into plasma. These results demonstrate that brisk walking has a beneficial effect on muscle insulin sensitivity but does not improve hepatic or adipose tissue insulin sensitivity in older women.
Several studies have evaluated the effect of exercise on skeletal muscle insulin sensitivity by using the gold-standard hyperinsulinemic-euglycemic clamp or a hyperglycemic clamp procedure in older adults, but the results are inconclusive. Most studies report improved insulin-mediated muscle glucose disposal after the last session of exercise training (11, 13, 22, 26, 27, 38); but some did not (11, 15). The discrepancy in results is likely due to a combination of the timing of the metabolic measurements in relation to the exercise, exercise intensity and statistical power. All of the studies that report a significant improvement on insulin-mediated glucose disposal focused on high-intensity (i.e., ≥70% V̇o2peak or ≥80% maximal heart rate) exercise (11, 13, 22, 26, 27, 38), and in three of these studies, insulin-mediated glucose disposal was evaluated within 48 h after the last exercise session (13, 26, 27) by using either the hyperinsulinemic-euglycemic clamp technique (insulin infusion rate: 40 mU/m2 BSA per min) (27) or the hyperglycemic clamp technique (13, 26); in the other three studies (11, 22, 38) measurements were made several days after the exercise session by using the hyperinsulinemic-euglycemic clamp procedure (insulin infusion rate ranging from 40–200 mU/m2 BSA per min), and the reported differences were statistically significant but only very small (∼10%). Goulet et al. (15) and DiPietro et al. (11) failed to show a significant effect of ∼1 h of running or cycling (∼65% V̇o2peak) on insulin-mediated glucose disposal (evaluated by using the hyperinsulinemic-euglycemic clamp procedure; insulin infusion rate of 40 mU/m2 BSA per min) when measurements were made 72–120 h (3–5 days) after the exercise session when the insulin-sensitizing effect of exercise has most likely nearly vanished (5, 25, 30). The results from our study demonstrate that even a ∼1-h-long brisk walk can significantly improve skeletal muscle insulin sensitivity for at least up to ∼20 h in older adults. Regular walking may therefore be sufficient and should be recommended to help preserve muscle insulin sensitivity in older adults.
We found no effect of exercise on hepatic and adipose tissue insulin sensitivity. To our knowledge, only one study to date has evaluated adipose tissue insulin sensitivity after exercise in older adults. From this study, it was reported that insulin-stimulated suppression of adipose tissue lipolysis was increased after high-intensity aerobic exercise (80% V̇o2peak) but not after moderate-intensity exercise (50–65% V̇o2peak) (11). Thus the lack of change in adipose tissue insulin sensitivity in our study is likely due to the moderate intensity of exercise performed, and more strenuous exercise may be needed to improve adipose tissue insulin sensitivity in older adults. Three studies have evaluated the effect of exercise on hepatic insulin sensitivity in older adults, and two report an increase in hepatic insulin sensitivity (19, 27) whereas the other (11) found no difference in hepatic insulin sensitivity between the exercise and control groups. One of the two studies that demonstrate a beneficial effect of exercise on hepatic insulin sensitivity (19) included obese older men and women with impaired glucose tolerance who were studied before and after 7 days of daily exercise for 1 h at 65% V̇o2peak; the other (27) included overweight and obese diabetic men and women who were studied before and after 7 days of daily exercise for 1 h at 80–85% maximum heart rate (∼70% V̇o2peak). We and DiPietro et al. (11), on the other hand, studied nonobese, nondiabetic older adults. It is therefore possible that the failure of exercise to improve hepatic insulin sensitivity in our study was due to the already near-maximal suppression of hepatic glucose production without exercise in rather insulin-sensitive subjects. However, we cannot rule out the possibility that repeated bouts of exercise and/or higher-intensity exercise are necessary to improve hepatic insulin sensitivity.
In summary, we have demonstrated that a single session of brisk walking that is consistent with public health recommendations improves skeletal muscle insulin sensitivity in older women when measured within ∼ 24 h after completion of the exercise. Based on these results, regular brisk walking may be recommended to maintain metabolic health in older adults.
GRANTS
This publication was made possible by National Institutes of Health Grants K99-AG-031297, DK-056341 (Nutrition and Obesity Research Center), RR-024992 (Washington Univ. School of Medicine Clinical Translational Science Award), and RR-00954 (Biomedical Mass Spectrometry Resource).
DISCLOSURES
No conflicts of interest, financial or otherwise, are declared by the author(s).
AUTHOR CONTRIBUTIONS
Author contributions: X.W. and B.M. conception and design of research; X.W. and B.M. performed experiments; X.W., B.W.P., G.I.S., and B.M. analyzed data; X.W. and B.M. interpreted results of experiments; X.W. and B.M. prepared figures; X.W. and B.M. drafted manuscript; X.W., B.W.P., G.I.S., J.K., D.N.R., S.A.S., and B.M. edited and revised manuscript; X.W., B.W.P., J.K., D.N.R., S.A.S., and B.M. approved final version of manuscript.
ACKNOWLEDGMENTS
We thank J. Shew, F. Custodio, and Dr. A. Okunade for technical assistance, R. Burrows and H. Jeffery for study coordination, the staff of the Clinical Research Unit for help in performing the studies, and the study subjects for participation.
REFERENCES
- 1. American Diabetes Association Diagnosis and classification of diabetes mellitus. Diabetes Care 28: S37–S42, 2005 [DOI] [PubMed] [Google Scholar]
- 2. Annuzzi G, Riccardi G, Capaldo B, Kaijser L. Increased insulin-stimulated glucose uptake by exercised human muscles one day after prolonged physical exercise. Eur J Clin Invest 21: 6–12, 1991 [DOI] [PubMed] [Google Scholar]
- 3. Black LE, Swan PD, Alvar BA. Effects of intensity and volume on insulin sensitivity during acute bouts of resistance training. J Strength Cond Res 24: 1109–1116, 2010 [DOI] [PubMed] [Google Scholar]
- 4. Borghouts LB, Keizer HA. Exercise and insulin sensitivity: a review. Int J Sports Med 21: 1–12, 2000 [DOI] [PubMed] [Google Scholar]
- 5. Burstein R, Polychronakos C, Toews CJ, MacDougall JD, Guyda HJ, Posner BI. Acute reversal of the enhanced insulin action in trained athletes. Association with insulin receptor changes. Diabetes 34: 756–760, 1985 [DOI] [PubMed] [Google Scholar]
- 7. Conte C, Fabbrini E, Kars M, Mittendorfer B, Patterson BW, Klein S. Multiorgan insulin sensitivity in lean and obese subjects. Diabetes Care 35: 1316–1321, 2012 [DOI] [PMC free article] [PubMed] [Google Scholar]
- 8. Cox JH, Cortright RN, Dohm GL, Houmard JA. Effect of aging on response to exercise training in humans: skeletal muscle GLUT-4 and insulin sensitivity. J Appl Physiol 86: 2019–2025, 1999 [DOI] [PubMed] [Google Scholar]
- 9. DeFronzo RA, Sherwin RS, Kraemer N. Effect of physical training on insulin action in obesity. Diabetes 36: 1379–1385, 1987 [DOI] [PubMed] [Google Scholar]
- 10. Devlin JT, Hirshman M, Horton ED, Horton ES. Enhanced peripheral and splanchnic insulin sensitivity in NIDDM men after single bout of exercise. Diabetes 36: 434–439, 1987 [DOI] [PubMed] [Google Scholar]
- 11. DiPietro L, Dziura J, Yeckel CW, Neufer PD. Exercise and improved insulin sensitivity in older women: evidence of the enduring benefits of higher intensity training. J Appl Physiol 100: 142–149, 2006 [DOI] [PubMed] [Google Scholar]
- 12. Dube JJ, Allison KF, Rousson V, Goodpaster BH, Amati F. Exercise dose and insulin sensitivity: relevance for diabetes prevention. Med Sci Sports Exerc 44: 793–799, 2012 [DOI] [PMC free article] [PubMed] [Google Scholar]
- 13. Evans EM, Racette SB, Peterson LR, Villareal DT, Greiwe JS, Holloszy JO. Aerobic power and insulin action improve in response to endurance exercise training in healthy 77–87 yr olds. J Appl Physiol 98: 40–45, 2005 [DOI] [PubMed] [Google Scholar]
- 14. Garber CE, Blissmer B, Deschenes MR, Franklin BA, Lamonte MJ, Lee IM, Nieman DC, Swain DP. American College of Sports Medicine position stand. Quantity and quality of exercise for developing and maintaining cardiorespiratory, musculoskeletal, and neuromotor fitness in apparently healthy adults: guidance for prescribing exercise. Med Sci Sports Exerc 43: 1334–1359, 2011 [DOI] [PubMed] [Google Scholar]
- 15. Goulet ED, Melancon MO, Aubertin-Leheudre M, Dionne IJ. Aerobic training improves insulin sensitivity 72–120 h after the last exercise session in younger but not in older women. Eur J Appl Physiol 95: 146–152, 2005 [DOI] [PubMed] [Google Scholar]
- 16. Groop LC, Bonadonna RC, DelPrato S, Ratheiser K, Zyck K, Ferrannini E, DeFronzo RA. Glucose and free fatty acid metabolism in non-insulin-dependent diabetes mellitus. Evidence for multiple sites of insulin resistance. J Clin Invest 84: 205–213, 1989 [DOI] [PMC free article] [PubMed] [Google Scholar]
- 17. Grundy SM. Metabolic syndrome: connecting and reconciling cardiovascular and diabetes worlds. J Am Coll Cardiol 47: 1093–1100, 2006 [DOI] [PubMed] [Google Scholar]
- 18. Hansen PA, Nolte LA, Chen MM, Holloszy JO. Increased GLUT-4 translocation mediates enhanced insulin sensitivity of muscle glucose transport after exercise. J Appl Physiol 85: 1218–1222, 1998 [DOI] [PubMed] [Google Scholar]
- 19. Haus JM, Solomon TP, Marchetti CM, Edmison JM, Gonzalez F, Kirwan JP. Free fatty acid-induced hepatic insulin resistance is attenuated following lifestyle intervention in obese individuals with impaired glucose tolerance. J Clin Endocrinol Metab 95: 323–327, 2010 [DOI] [PMC free article] [PubMed] [Google Scholar]
- 20. Hickner RC, Racette SB, Binder EF, Fisher JS, Kohrt WM. Suppression of whole body and regional lipolysis by insulin: effects of obesity and exercise. J Clin Endocrinol Metab 84: 3886–3895, 1999 [DOI] [PubMed] [Google Scholar]
- 21. Holloszy JO. Exercise-induced increase in muscle insulin sensitivity. J Appl Physiol 99: 338–343, 2005 [DOI] [PubMed] [Google Scholar]
- 22. Hughes VA, Fiatarone MA, Fielding RA, Kahn BB, Ferrara CM, Shepherd P, Fisher EC, Wolfe RR, Elahi D, Evans WJ. Exercise increases muscle GLUT-4 levels and insulin action in subjects with impaired glucose tolerance. Am J Physiol Endocrinol Metab 264: E855–E862, 1993 [DOI] [PubMed] [Google Scholar]
- 23. Jensen TE, Richter EA. Regulation of glucose and glycogen metabolism during and after exercise. J Physiol 590: 1069–1076, 2012 [DOI] [PMC free article] [PubMed] [Google Scholar]
- 24. Kahn SE, Larson VG, Beard JC, Cain KC, Fellingham GW, Schwartz RS, Veith RC, Stratton JR, Cerqueira MD, Abrass IB. Effect of exercise on insulin action, glucose tolerance, and insulin secretion in aging. Am J Physiol Endocrinol Metab 258: E937–E943, 1990 [DOI] [PubMed] [Google Scholar]
- 25. King DS, Baldus PJ, Sharp RL, Kesl LD, Feltmeyer TL, Riddle MS. Time course for exercise-induced alterations in insulin action and glucose tolerance in middle-aged people. J Appl Physiol 78: 17–22, 1995 [DOI] [PubMed] [Google Scholar]
- 26. Kirwan JP, Kohrt WM, Wojta DM, Bourey RE, Holloszy JO. Endurance exercise training reduces glucose-stimulated insulin levels in 60- to 70-year-old men and women. J Gerontol 48: M84–M90, 1993 [DOI] [PubMed] [Google Scholar]
- 27. Kirwan JP, Solomon TP, Wojta DM, Staten MA, Holloszy JO. Effects of 7 days of exercise training on insulin sensitivity and responsiveness in type 2 diabetes mellitus. Am J Physiol Endocrinol Metab 297: E151–E156, 2009 [DOI] [PMC free article] [PubMed] [Google Scholar]
- 28. Magkos F, Tsekouras Y, Kavouras SA, Mittendorfer B, Sidossis LS. Improved insulin sensitivity after a single bout of exercise is curvilinearly related to exercise energy expenditure. Clin Sci (Lond) 114: 59–64, 2008 [DOI] [PubMed] [Google Scholar]
- 28a. Metropolitan Life Insurance Company 1983 Metropolitan height and weight tables. Stat Bull 64: 2–9, 1983 [Google Scholar]
- 29. Mikines KJ, Sonne B, Farrell PA, Tronier B, Galbo H. Effect of physical exercise on sensitivity and responsiveness to insulin in humans. Am J Physiol Endocrinol Metab 254: E248–E259, 1988 [DOI] [PubMed] [Google Scholar]
- 30. Mikines KJ, Sonne B, Tronier B, Galbo H. Effects of acute exercise and detraining on insulin action in trained men. J Appl Physiol 66: 704–711, 1989 [DOI] [PubMed] [Google Scholar]
- 31. Patterson BW, Zhao G, Elias N, Hachey DL, Klein S. Validation of a new procedure to determine plasma fatty acid concentration and isotopic enrichment. J Lipid Res 40: 2118–2124, 1999 [PubMed] [Google Scholar]
- 32. Perseghin G, Price TB, Petersen KF, Roden M, Cline GW, Gerow K, Rothman DL, Shulman GI. Increased glucose transport-phosphorylation and muscle glycogen synthesis after exercise training in insulin-resistant subjects. N Engl J Med 335: 1357–1362, 1996 [DOI] [PubMed] [Google Scholar]
- 33. Prager R, Wallace P, Olefsky JM. In vivo kinetics of insulin action on peripheral glucose disposal and hepatic glucose output in normal and obese subjects. J Clin Invest 78: 472–481, 1986 [DOI] [PMC free article] [PubMed] [Google Scholar]
- 34. Reaven G. Insulin resistance and coronary heart disease in nondiabetic individuals. Arterioscler Thromb Vasc Biol 32: 1754–1759, 2012 [DOI] [PubMed] [Google Scholar]
- 35. Shojaee-Moradie F, Baynes KC, Pentecost C, Bell JD, Thomas EL, Jackson NC, Stolinski M, Whyte M, Lovell D, Bowes SB, Gibney J, Jones RH, Umpleby AM. Exercise training reduces fatty acid availability and improves the insulin sensitivity of glucose metabolism. Diabetologia 50: 404–413, 2007 [DOI] [PubMed] [Google Scholar]
- 36. Short KR, Vittone JL, Bigelow ML, Proctor DN, Rizza RA, Coenen-Schimke JM, Nair KS. Impact of aerobic exercise training on age-related changes in insulin sensitivity and muscle oxidative capacity. Diabetes 52: 1888–1896, 2003 [DOI] [PubMed] [Google Scholar]
- 37. Steele R, Wall JS, De Bodo RC, Altszuler N. Measurement of size and turnover rate of body glucose pool by the isotope dilution method. Am J Physiol 187: 15–24, 1956 [DOI] [PubMed] [Google Scholar]
- 38. Tonino RP. Effect of physical training on the insulin resistance of aging. Am J Physiol Endocrinol Metab 256: E352–E356, 1989 [DOI] [PubMed] [Google Scholar]
- 39. US Department of Health and Human Services 2008 Physical activity guidelines for Americans. Washington, DC: USDHHS, 2008. [http://www.health.gov/paguidelines/pdf/paguide.pdf] [Google Scholar]