

Abstract
Background:
Isolation and structure elucidation of flavan-3-ol constituents from the leaves of Ficus spragueana and their cytotoxic activity.
Materials and Methods:
Different open silica gel column chromatographic techniques with different solvent systems were used for the separation of the constituents of the ethyl acetate-soluble fraction of the alcoholic extract of Ficus spragueana leaves. The structures of these compounds were assigned on the basis of spectroscopic analyses and comparison with literature data. MTT colorimetric assay method (Viability assay) was used for the evaluation of cytotoxic activity of compound 1 against human breast cancer (MCF-7) and human liver cancer (HepG2) cell lines.
Results:
The isolation of one flavan-3-ol dimer and was identified as (-)-afzelechin-(4α→8)-epicatechin 1, and two flavan-3-ol monomers and were identified as (-)-epiafzelechin 2 and (-)-epicatechin 3. Compound 1 was relatively inactive against human breast cancer (MCF-7) cell line at the tested concentrations as compared with the standard. However, at a concentration (50 ΅g) it was found to give inhibition upon the proliferation of examined human liver (HepG2) tumor cell line.
Conclusions:
Compound 1 is a new flavan-3-ol dimer and it showed a potent cytotoxic activity against human liver (HepG2) tumor cell line.
Keywords: Ficus spragueana, Moraceae, Flavan-3-ol dimer, Cytotoxic activity
INTRODUCTION
Ficus is an important genus of the family Moraceae, comprises about 755 fig tree species worldwide and widely used in folk medicines.[1,2] It shows interesting spectra of biological activities, such as anti-oxidant,[3] anti-microbial[4] and anti-diabetic[5] activities. Phytochemical investigations have shown that genus Ficus is mainly rich in phenolics,[6–10] sterols and triterpenoids,[11,12] alkaloids[13] and flavonoidal alkaloids.[14] Surprisingly no intensive research work has been reported on Ficus spragueana Mildbr. and Burret species. We report here the isolation and structure elucidation of a new flavan-3-ol dimer; (-)-afzelechin-(4α→8)-epicatechin 1 together with two known flavan-3-ols; (-)-epiafzelechin 2 and (-)-epicatechin 3 [Figure 1], from the ethyl acetate fraction of the alcoholic extract of Ficus spragueana leaves. The present work also describes the cytotoxicity evaluation of compound 1 against human breast cancer (MCF7) and human liver cancer (HepG2) cell lines.
Figure 1.
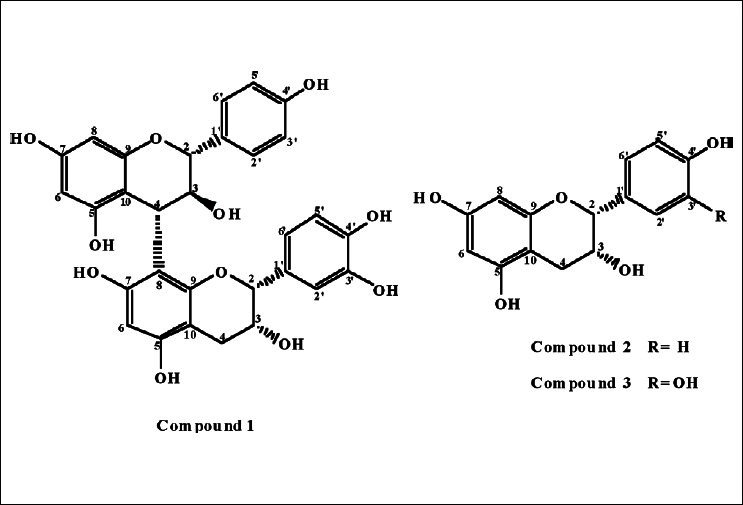
Structure of isolated compounds 1–3
MATERIAL AND METHODS
General: Melting points were obtained on a Stuart SMP3 apparatus. Optical rotations were performed with ATAGO P 100 (Japan). UV spectra were determined with Pye Unicam spp. 1750 spectrophotometer. The 1H- and 13C NMR measurements were obtained with a Jeol JNM ECA 270 and 500 spectrometer operating at 500 and 270 MHz (for 1H) and at 125 and 67.5 MHz (for 13C) in CD3OD or DMSO-d6 solution, and chemical shifts were expressed in δ (ppm) with reference to TMS, and coupling constant (J) in Hertz. 13C multiplicities were determined by the DEPT pulse sequence (135°). COSY, HMBC, and HMQC NMR experiments were carried out using a Jeol JNM ECA-500 high field spectrometer. FABMS were taken on a VGZAB-HF reversed geometry mass spectrometer (BE configuration, where “B” is a magnetic sector and “E” is an electrostatic analyzer) (VG Analytical, Inc.). EIMS was carried on 502 mass spectrometer having a direct inlet system and operating at 70 eV. (samples inserted between 180–240°C), or on a VG Micromass 165 spectrometer at 18, 35 or 70 eV. with inlet temperature between 180–240°C. Si gel (Si gel 60, Merck) and Sephadex LH-20 (Pharmacia Biotech, Sweden) were used for open column chromatography. TLC was carried out on precoated silica gel 60 F 254 (Merck) plates. Developed chromatograms were visualized by spraying with 1% vanillin-sulphuric acid, vanillin-hydrochloric acid or anisaldehyde-sulphuric acid reagents followed by heating at 100°C for five min, or spraying the developed plates with ferric chloride reagent.
Plant material
Ficus spragueana leaves were collected from Orman garden, Giza, Egypt in March 2007, and were kindly identified by Dr. M. El-Gepaly, Professor of Plant Taxonomy, Faculty of Science, Cairo University, Egypt. A voucher specimen has been deposited in the Pharmacognosy Department, Faculty of Pharmacy, Al-Azhar University, Cairo, Egypt.
Material and reagents used for cell culture and cytotoxicity assays
The cytotoxicity assays was carried out at the fungi research center, Al-Azhar university, Cairo, Egypt. The following material and reagents were used for cell culture and cytotoxicity assays. Breast MCF-7 and Liver (HepG2) cell lines were purchased from the American Type Culture Collection (ATCC). Dulbecco′s Modified Eagle Medium (DMEM), Roswell Park Memorial Institute (RPMI) 1640 medium, 10 % Fetal Bovine serum (FBS), all were from BioWhittaker® Lonza, Belgium. Microplate reader (TECAN, Inc.). Flat-bottom microtiter plates, 96 well were from Falcon, NJ, USA. 3-(4, 5-dimethylthiazol-2-yl)-2,5-diphenyl tetrazolium bromide (MTT) for viability assay were from Sigma (St. Louis, Mo., USA). All other chemicals used were of analytical reagent grade.
Extraction and isolation
The air dried powdered leaves of Ficus spragueana (2kg) were subjected to exhaustive extraction by cold percolation with 70% MeOH (7L x 3), 3 days each. The combined methanolic extracts were concentrated under vacuum at 40&076;C to dryness (300g). The concentrated methanolic extract was suspended in distilled water (500 ml) and defatted with petroleum ether. The defatted crude extract was partitioned successively with ethyl acetate and n-butanol to give 70 and 99 g, respectively. The EtOAc fraction (70g) was applied to Si gel column and eluted with chloroform-methanol (100:0 → 80:20) to give four fractions of A (600mg), B (300mg) C (1.75g) and D (830mg). Fraction C (1.75g) was rechromatographed over Si gel column eluted with chloroform-methanol (95:5) to give two fractions of C1 (900mg) and C2 (550mg). Fraction C1 (900mg) was rechromatographed over Si gel column eluted with chloroform-methanol (95:5) to give compound 2 (300mg) and compound 3 (600mg). Fraction D (830mg) was rechromatographed over Si gel column eluted with chloroform-methanol (90:10) to give two fractions of D1 (250mg) and D2 (400mg). Fraction D2 was further purified over Si gel column eluted with chloroform-methanol (93:7) to give compound 1 (300mg). All isolated compounds 1–3 were further purified by gel filtration using Sephadex LH-20, eluted with methanol.
Methods and techniques for cytotoxicity evaluation using viability assay
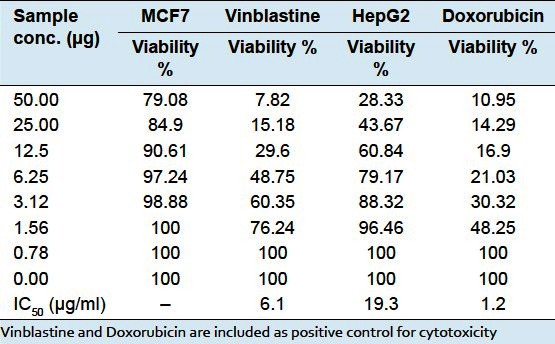
Breast (MCF-7) and Liver (HepG2) cell lines were propagated in Dulbecco′s Modified Eagle Medium (DMEM) containing 10% heat-inactivated Fetal Bovine Serum (FBS).[15,16] All cell lines were cultivated in an incubator at 37&776;C in humidified air containing 5% CO2 and were subcultured two times a week. For routine cytotoxicity assays, all cell lines were adapted to one single medium RBMI 1640 medium supplemented with 10% FBS, 2 mM L-glutamine, penicillin (100 unites/1ml), and streptomycin (100mg/1ml). For the micro assay, the growth medium was supplemented with 10 mM HPES (1-[2-hydroxy ethyl] piprazine-4-ethane sulfonic acid) buffer pH 7.3 and incubated at 37&776;C in CO2 incubator. Cell toxicity was monitored by determining the effect of the test samples on cell morphology and cell viability. Cellular viability in the presence and absence of experimental reagents was determined using the standard MTT (3-[4, 5-dimethyl thiazole-2-yl]-2, 5-diphenyl tetrazolium bromide) colorimetric assay. The assay is based on reduction of MTT by the mitochondrial dehydrogenase of viable cells to give a blue formazan product that can be measured spectrophotometrically. In brief, exponentially growing cells were seeded in 96-well, flat-bottomed microtiter plate (Falcon, NJ, USA) at a cell concentration of 1×10⁴ cells per well in 100μl of growth medium using a multichannel pipette. Fresh medium containing different concentrations of the test sample were added in triplicate after 24h of seeding. The microtiter plates were incubated at 37°C in a humidified incubator with 5% CO2 for a period of 48h. Negative control cells were incubated without test samples and with or without DMSO. Cells treated with Vinblastine or Doxorubicin served as a positive control. Cell survival was evaluated by adding 10mL of 5mg/ml MTT in 0.1 mM, pH 7.4 phosphate buffered saline to each well, and reincubating plates in 5% CO2 /air for 4 hrs at 37&776;C. Plates were then centrifuged at 1500 x g for 5 minutes to precipitate cells and the reduced product of MTT (blue formazan). An aliquot of 100mL of the supernatant was removed, and DMSO (100mL) was added to dissolve precipitated, reduced blue formazan. The plate was mixed on a micro shaker for 10 minutes, and the absorbance of the plates were measured on Microplate reader (TECAN, Inc.), using a test wavelength of 490 nm. Treated samples were compared with the cell control in the absence of the tested samples. The cell cytotoxic effect of each tested samples was calculated [Table 1]. Percentage cell viability was calculated as the mean absorbance of control cells/mean absorbance of treated cells. Dose-response curves were prepared and the IC50 value was determined [Table 1].
Table 1.
Viability Breast MCF7 and Liver HepG2 cell lines treated with compound 1 and its IC50 values
RESULTS
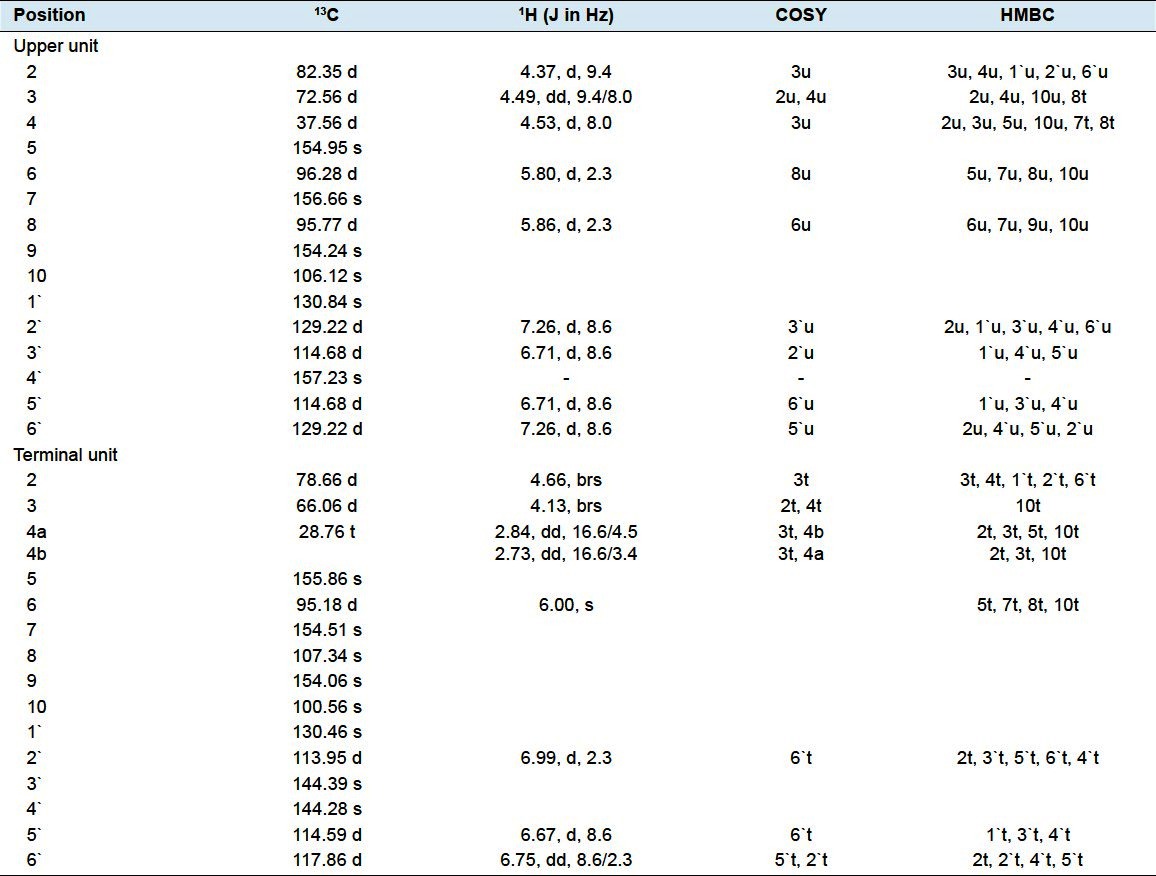
Compound 1. A brown amorphous powder [MeOH]; mp 250–255°C; [α] 25 D-28.5° (c 1.0, MeOH); UV λmax (MeOH) nm: 210, 282; 1H and 13C NMR data (500 MHz for 1H and 125 for 13C, CD3OD), are shown in Table 2; FAB mass spectrum: m/z 563 [M+H]+.
Table 2.
NMR spectroscopic data (500 MHz, CD3OD) for compound 1
Results of cytotoxicity evaluation of compound 1
Compound 2. A bright yellow needles [MeOH]; mp 238–240°C; [α] 25 D-51.0° (c 1.0, MeOH); UV λmax (MeOH) nm: 220, 281; 1H NMR (270 MHz, DMSO-d6) δ 7.15 (2H, d, J=8.0 Hz, H-2′, 6′), 6.64, (2H, d, J=8.0 Hz, H-3′, 5′), 5.81, (1H, br s, H-8), 5.64 (1H, br s, H-6), 4.59 (1H, br s, H-2), 3.93 (1H, m, H-3), 2.57 (1H, dd, J=16.0, 4.2 Hz, H-4α), 2.41 (1H, dd, J=16.0, 3.3 Hz, H-4β), OH signals: 9.18, 9.03, 8.81, 4.71; 13C NMR (125 MHz, DMSO-d6) δ 157.06 (C-7, 4′), 156.79 (C-5), 156.29 (C-9), 130.52 (C-1′), 128.77 (C-2′, 6′), 114.95, (C-3′, 5′), 98.96 (C-10), 95.67 (C-6), 94.66 (C-8), 78.55 (C-2), 65.35 (C-3), 28.72 (C-4); EI mass spectrum: m/z (rel. int.) 274 (47.71), 240 (12.52), 166 (10.00), 152 (11.10), 131 (4.21), 139 (100.0), 136 (34.94), 107 (75.51), 97 (20.04), 77 (34.12), 69 (37.13), 51 (42.42), 39 (56.94).
Compound 3. A bright yellow needles [MeOH]; mp 240–242°C; [α] 25 D-59.0° (c 1.0, MeOH); UV λmax (MeOH) nm: 218, 280; 1H NMR (270 MHz, DMSO-d6) δ 6.79 (1H, br s, H-2′), 6.59, (2H, br s, H-5′, 6′), 5.80, (1H, br s, H-8), 5.65 (1H, br s, H-6), 4.60 (1H, br s, H-2), 3.92 (1H, m, H-3), 2.58 (1H, dd, J=16.0, 4.2 Hz, H-4α), 2.42 (1H, dd, J=16.0, 3.3 Hz, H-4β), OH signals: 9.02, 8.74, 8.66, 4.70; 13C NMR (125 MHz, DMSO-d6) δ 156.64 (C-7), 156.33 (C-5), 155.89 (C-9), 144.60 (C-4′), 144.54 (C-3′), 130.74 (C-1′), 118.10 (C-6′), 114.99 (C-5′), 114.90 (C-2′), 98.63 (C-10), 95.20 (C-6), 94.22 (C-8), 78.17 (C-2), 65.03 (C-3), 28.33 (C-4); EI mass spectrum: m/z (rel. int.) 290 (55.26), 272 (100.0), 255 (16.24), 165 (6.60), 163 (27.65), 152 (81.20), 147 (2.32), 139 (96.17), 127 (18.58), 123 (98.78), 110 (27.32), 97 (20.04), 77 (42.57), 69 (61.49), 51 (71.05), 39 (85.84).
DISCUSSION
Repeated chromatography of the ethyl acetate fraction of Ficus spragueana leaves on silica gel columns with solvent systems chloroform-methanol of different concentrations and Sephadex LH-20 using methanol yielded one new and two known flavan-3-ol derivatives 1–3. The structure of the new compound 1 have been elucidated by spectroscopic means including 1D NMR (1H, 13C and DEPT), 2D NMR (COSY, HMQC and HMBC experiments), UV and FABMS. Identification of known compounds 2 and 3 were performed by comparison of their spectroscopic data with those reported for the same compounds in the literature.[17–20]
Structure elucidation: Compound 1, was obtained as a brown amorphous powder. It gave a typical reddish coloration characteristic of phenolics with vanillin-sulphuric acid, vanillin-hydrochloric acid and anisaldehyde-sulphuric acid reagents.[21,22] UV spectrum of compound 1 recorded in methanol showed absorption maxima at 210 and 282 characteristic for flavan-3-ols.[18,19] The molecular formula of 1 was inferred to be C30H26O11 from its molecular ion at m/z 563 [M+H]+in positive ion mode FABMS, and the 13C NMR spectral data Table 2, which revealed that 1 is a dimeric flavan-3-ol. The presence of two flavanyl units was also indicated by 13C resonances at δ 78.66 (C-2t), 72.56 (C-3u), 66.06 (C-3t), 82.35 (C-2u), and 37.56 (C-4u), arising from flavanyl heterocyclic rings (rings C and F). These signals provide a distinct key entry point into the two-dimensional spectra.[23] The presence of a B-type dimeric proanthocyanidin was evident from that, the 1H NMR showed a loss of peaks equivalent to two hydrogens at 2.85–2.75 ppm corresponding to the two C-4 hydrogens on the C ring. A new peak integrating to one hydrogen was found at 4.53 ppm. HMBC correlation to C-2 and C-3 of the C-ring, along with HMQC data allowed for the identification of this peak as the C-4 hydrogen on the C-ring. These signals and the absence of H-8 of D-ring in the terminal flavan unit indicated that this compound is a flavan dimer of proanthocyanidin B series. In the HMQC spectrum, H2 -4t at δ 2.84 and 2.73 correlated with C-4t at δ 28.76, indicating that the signal at δ 37.56 was attributable to C-4u, which was directly correlated with the H-4u at δ 4.53. In the 1H- 1H COSY spectrum, the protons at δ 2.73 and δ 4.53 correlated with the protons at δ 4.13 and δ 4.49, respectively. Therefore, the signals at δ 4.13 and δ 4.49 were from H-3t and H-3u, respectively. Thus, HMQC analysis revealed that the chemical shifts of C-3t and C-3u were δ 66.06 and δ 72.56, respectively. In the 1H NMR spectrum Table 2, the one set of meta-coupled protons at δ 5.80 (1H, d, J=2.3 Hz) and 5.86 (1H, d, J=2.3 Hz), was assigned to the H-6 and H-8 protons of the A-ring of the upper unit, respectively. Furthermore HMBC spectrum showed correlations between the signal at δ 5.86 and the signals at δ 156.66 (C-7u) and δ 154.24 (C-9u), permitting assignment of the signal to H-8u. The signal at δ 5.80 was assigned to H-6u, owing to correlations with the signals at δ 156.66 (C-7u) and δ 155.86 (C-5u). The presence of a proton linked to the C-6 of terminal unit, indicated that the C4→C8 interflavanoid linkage was the only linkage in compound 1. Although the 1H NMR spectrum (in CD3OD) showed some duplication of signals, this was rectified by measurement at an elevated temperature. Duplication of the 1H signals described above coincided with the 4→8 linkage in 1 between the upper and lower unit, rather than the less hindered 4→6 linkage. The ABMX system at δ 2.73–4.66 was ascribed to the F-ring protons of the terminal unit. Furthermore, one AA′BB′ coupling system [δ 7.26 (2H, d, J=8.6 Hz, H-2′, 6′), δ 6.71 (2H, d, J=8.6 Hz, H-3′, 5′)] of B-ring of the upper unit and one ABX coupling system [δ 6.99 (1H, d, J=2.3 Hz, H-2′), δ 6.67 (1H, d, J=8.6 Hz, H-5′), δ 6.75 (1H, dd, J=8.6, 2.3 Hz, H-6′)] of E-ring of the terminal unit were observed. These findings indicated that 1 was an B-type proanthocyanidin consisting of one 5,7,4′-trihydroxy flavan-3-ol unit (upper) and one 5,7,3′,4′-tetrahydroxy flavan-3-ol unit (terminal). The 13C NMR spectrum displayed 28 signals but it was obvious that two signals at δ 129.22 and 114.68 had intensities suggesting that they represent two carbons each. Based on information from DEPT editing the carbons were grouped into 14 quaternary, 10 aryl and 5 aliphatic methine and one methylene carbons. In the 13C spectrum, the most downfield signals from δ 144.28 to δ 157.23 were due to the phenolic carbons 5, 7 and 4′ of each unit and 3′ of the terminal unit, as well as the C-9 of each unit. The signals from δ 95.18 to δ 107.34 were ascribed to the carbons 6, 8 and 10. Finally, the remaining signals, from δ 113.95 to δ 130.84, were attributed to the carbons 1′, 2′, 5′ and 6′ of each unit and 3′ of the upper unit. In the HMBC spectrum, the proton at δ 4.37 was attributed to H-2u because it was correlated with the C-3u and two other signals at δ 129.22 and δ 130.84 which were assigned to the C-2′u/C-6′u and C-1′u, respectively. Similarly, the proton at δ 4.66 was attributed to H-2t because it was correlated with the C-3t and three other signals at δ 113.95, δ 117.86 and δ 130.46 which were assigned to the C-2′t, C-6′t and C-1′t, respectively. These finding confirmed that, afzelechin is the upper unit while epicatechin is the terminal one. The HMBC NMR sequence allowed us to distinguish cross-peaks between the proton H-6t and the close carbons C-5t and C-7t, indicating that the position of the interflavanoid linkage is not C4→C6. Moreover, we also observed correlations between the proton H-4u and the carbons C-7t, C-8t and C-9t confirming the C4→C8 interflavanoid linkage. The upper flavan-3-ol had a 2,3-trans configuration (C ring) as suggested by the coupling constant of the aliphatic proton at δ 4.37 (1H, d, J=9.4 Hz, H-2u). In contrast, the H-2 and H-3 of the F ring appear as broad singlets indicative of a relative 2,3-cis-configuration for the terminal unit. Also the observation of the corresponding carbon chemical shifts of the flavan C-2u and C-2t carbons signalled at δ 82.35 and 78.66 were consistent with the relative 2,3-trans and 2,3-cis stereochemistry for the upper and terminal units, respectively.[18,20,24] Consequently, compound 1 was characterized as (-)-afzelechin-(4α→8)-epicatechin.
Cytotoxicity evaluation of compound 1: Cytotoxicity was assessed in human breast cancer (MCF-7) and human liver cancer (HepG2) cell lines using the viability assay.[15] Table 1 shows the viability of the tested cell lines and the IC50 values of compound 1 in each of the cell lines tested. Compound 1 was relatively inactive against human breast cancer (MCF-7) cell line at the tested concentrations as compared with the standard. However, at a concentration (50 μg) it was found to give inhibition upon the proliferation of examined human liver (HepG2) tumor cell line with much higher potency.
Footnotes
Source of Support: Nil
Conflict of Interest: None declared.
REFERENCES
- 1.Van Noort S, Gardiner AJ, Tolley KA. New records of Ficus (Moraceae) species emphasize the conservation significance of inselbergs in Mozambique. South Afr J Bot. 2007;73:642–9. [Google Scholar]
- 2.Ripu MK, Rainer WB. Ficus (Fig) species in Nepal: a review of diversity and indigenous uses. Lyonia. 2006;11:85–97. [Google Scholar]
- 3.Abdel-Hameed ES. Total phenolic contents and free radical scavenging activity of certain Egyptian Ficus species leaf samples. Food Chem. 2009;114:1271–7. [Google Scholar]
- 4.Kuetea V, Nanab F, Ngamenic B, Mbavengd AT, Keumedjio F, Ngadjuib BT. Antimicrobial activity of the crude extract, fractions and compounds from stem bark of Ficus ovata (Moraceae) J Ethnopharmacol. 2009;124:556–61. doi: 10.1016/j.jep.2009.05.003. [DOI] [PubMed] [Google Scholar]
- 5.Pandita R, Phadkeb A, Jagtapa A. Antidiabetic effect of Ficus religiosa extract in streptozotocin-induced diabetic rats. J Ethnopharmacol. 2010;128:462–6. doi: 10.1016/j.jep.2010.01.025. [DOI] [PubMed] [Google Scholar]
- 6.Savova ST, Ribarova F, Gerova M. (+)-Catechin and (-)-epicatechin in Bulgarian fruits. J Food Compos Anal. 2005;18:691–8. [Google Scholar]
- 7.Veberic R, Colaric M, Stampar F. Phenolic acids and flavonoids of fig fruit (Ficus carica L.) in the Northern Mediterranean region. Food Chem. 2008;106:153–7. [Google Scholar]
- 8.Kuo YH, Li YC. Three new compounds, ficusone, ficuspirolide and ficusolide from the heartwood of Ficus microcarpa. Chem Pharm Bull. 1999;47:299–301. doi: 10.1248/cpb.48.1862. [DOI] [PubMed] [Google Scholar]
- 9.Li YC, Kuo YH. Two New Isoflavones from the Bark of Ficus microcarpa. J Nat Prod. 1997;60:292–3. [Google Scholar]
- 10.Li YC, Kuo YH. A monoterpenoids and two simple phenols from heartwood of Ficus microcarpa. Phytochemistry. 1998;49:2417–9. [Google Scholar]
- 11.Chiang YM, Chang JY, Kuo CC, Chang CY, Kuo YH. Cytotoxic triterpenes from the aerial roots of Ficus microcarpa. Phytochemistry. 2005;66:495–501. doi: 10.1016/j.phytochem.2004.12.026. [DOI] [PubMed] [Google Scholar]
- 12.Rubnov S, Kashman Y, Rabinowitz R, Schlesinger M, Mechoulam R. Suppressors of Cancer Cell Proliferation from Fig (Ficus carica) Resin: Isolation and Structure Elucidation. J Nat Prod. 2001:993–6. doi: 10.1021/np000592z. [DOI] [PubMed] [Google Scholar]
- 13.Baumgartner B, Erdelmeier CAJ, Wright AD, Rali T, Sticher O. An antimicrobial alkaloid from Ficus septic. Phytochemistry. 1990;29:3327–30. [Google Scholar]
- 14.Johns SR, Russel JH. Ficine, a novel flavonoidal alkaloid from Ficus panfoniana. Tetrahedron Lett. 1965;21:1987–91. doi: 10.1016/s0040-4039(01)83898-3. [DOI] [PubMed] [Google Scholar]
- 15.Mosmann T. Rapid colorimetric assay for cellular growth and survival: application to proliferation and cytotoxicity assays. J. Immunol. Methods. 1983;65:55–63. doi: 10.1016/0022-1759(83)90303-4. [DOI] [PubMed] [Google Scholar]
- 16.Francis D, Rita L. Rapid colorimetric assay for cell growth and survival: modifications to the tetrazolium dye procedure giving improved sensitivity and reliability. J Immunol Methods. 1986;89:271–7. doi: 10.1016/0022-1759(86)90368-6. [DOI] [PubMed] [Google Scholar]
- 17.Agrawal PK. Carbon-13 NMR of Flavonoids. New York: Elsevier Oxford; 1989. [Google Scholar]
- 18.Harborne JB. The Flavonoids, Advances in Research Since 1986. New York: Chapman and Hall; 1994. [Google Scholar]
- 19.Mabry TJ, Markham KR, Thomas MB. The Systematic Identification of Flavonoids. New York: Springer-Verlag; 1970. [Google Scholar]
- 20.Davis AL, Cai Y, Davies AP, Lewis JR. 1 H- and 13 C-NMR assignments of some green tea polyphenols. Magn Reson Chem. 1996;34:887–90. [Google Scholar]
- 21.Jacques D, Haslam E, Bedford GR, Greatbanks D. Plant proanthocyanidins Part II. Proanthocyanidin-A2 and its derivatives. J Chem Soc. 1974;I:2663–71. [Google Scholar]
- 22.Morimoto S, Nonaka G, Nishioka I. Tannins and related compounds, LIX. Aesculitanins, novel proanthocyanidins with doubly bonded structures from Aesculus hippocastanum L. Chem Pharm Bull. 1987;35:4717–29. [Google Scholar]
- 23.Bruyne TD, Pieters LA, Dommisse RA, Kolodziej H, Wray V, Domke T, et al. Unambiguous assignments for free dimeric proanthocyanidin phenols from 2D NMR. Phytochemistry. 1996;43:265–72. [Google Scholar]
- 24.Bae YS, Burger JF, Steynberg JP, Ferreira D, Hemingway RW. Flavan and procyanidin glycosides from the bark of Blackjack Oak. Phytochmistry. 1994;3:473–8. doi: 10.1016/s0031-9422(00)94785-x. [DOI] [PubMed] [Google Scholar]