Abstract
Background:
Prostate cancer mortality has been decreasing in several high income countries and previous studies analysed the trends mostly according to geographical criteria. We aimed to identify patterns in the time trends of prostate cancer mortality across countries using a model-based approach.
Methods:
Model-based clustering was used to identify patterns of variation in prostate cancer mortality (1980–2010) across 37 European, five non-European high-income countries and four leading emerging economies. We characterised the patterns observed regarding the geographical distribution and gross national income of the countries, as well as the trends observed in mortality/incidence ratios.
Results:
We identified three clusters of countries with similar variation in prostate cancer mortality: pattern 1 (‘no mortality decline'), characterised by a continued increase throughout the whole period; patterns 2 (‘later mortality decline') and 3 (‘earlier mortality decline') depict mortality declines, starting in the late and early 1990s, respectively. These clusters are also homogeneous regarding the variation in the prostate cancer mortality/incidence ratios, while are heterogeneous with reference to the geographical region of the countries and distribution of the gross national income.
Conclusion:
We provide a general model for the description and interpretation of the trends in prostate cancer mortality worldwide, based on three main patterns.
Keywords: cluster analysis, mortality trends, prostatic neoplasm
Worldwide, prostate cancer is the second most frequent cancer and the sixth leading cause of oncological death among men. In 2008, it accounted for approximately 250 thousand deaths (Ferlay et al, 2010) and 10.9 million of disability adjusted life years (Soerjomataram et al, 2012).
Over the past two decades, the mortality rates have been declining in several high income countries (Bray et al, 2010; Bosetti et al, 2011). This has been explained in terms of improved early detection and treatment (Collin et al, 2008), although the effectiveness of prostate-specific antigen (PSA) screening (Andriole et al, 2012; Schröder et al, 2012) and radical prostatectomy remain open to discussion (Bill-Axelson et al, 2011; Wilt et al, 2012). Nevertheless, radiotherapy as primary treatment improves overall survival (Warde et al, 2011), immediate postoperative radiotherapy improves 5-year biochemical progression-free survival (Wiegel et al, 2009) and hormone therapy is associated to longer time to disease progression in metastatic disease and longer overall survival when associated with radiotherapy in locally advanced disease (Bolla et al, 2002).
Previous studies grouped the countries mostly following geographical criteria (Hsing and Devesa, 2001; Oliver et al, 2001; Center et al, 2012) or according to trends after the introduction of widespread PSA testing (Bouchardy et al, 2008). Model-based clustering may allow a more meaningful grouping of the different settings with no a priori constraints, according to the mortality rates at onset of the observation period, as well as the magnitude and shape of its variation.
We aimed to identify patterns in the time trends of prostate cancer mortality across countries using a model-based approach and characterised the patterns observed regarding the geographical distribution and gross national income (GNI) of the countries, as well as the trends observed in mortality/incidence ratios.
Materials and methods
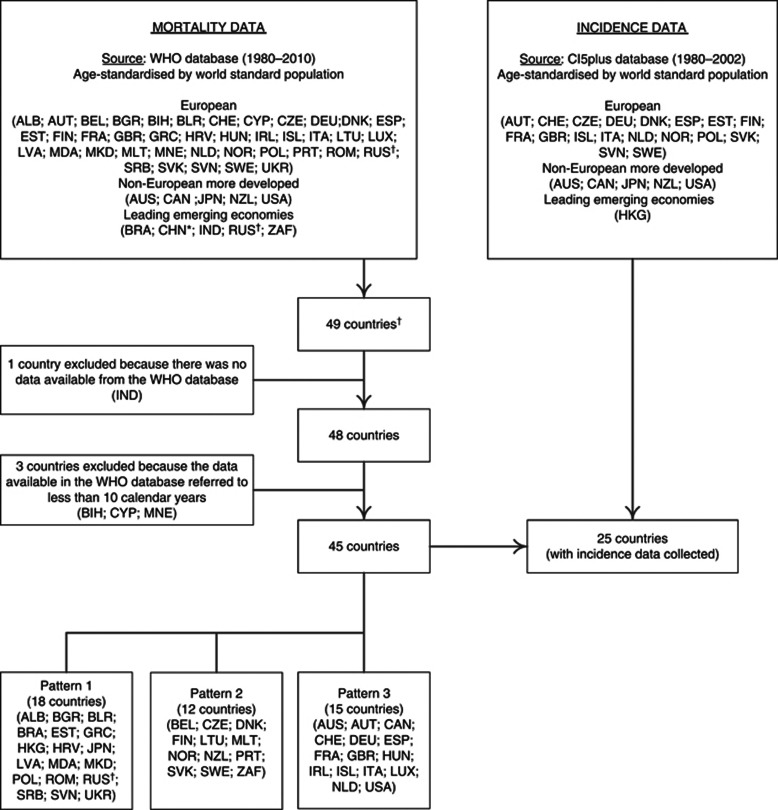
We analysed European countries, selected non-European high-income countries and selected leading emerging economies (United Nations, 2010) (Figure 1).
Figure 1.
Flowchart of the model-based approach used to identify prostate cancer mortality patterns and estimation of mortality/incidence ratios in the same countries. *For China, we used data from Hong Kong Special Administrative Region because Mainland China uses a special list of causes that does not encode prostate cancer. †Russian Federation was considered both as an European country and a leading emerging economy; ALB=Albania; AUS=Australia; AUT=Austria; BEL=Belgium; BIH=Bosnia and Herzegovina; BGR=Bulgaria; BLR=Belarus; BRA=Brazil; CAN=Canada; CYP=Cyprus; CHE=Switzerland; CHN=China; CZE=Czech Republic; DEU=Germany; DNK=Denmark; ESP=Spain; EST=Estonia; FIN=Finland; FRA=France; GBR=United Kingdom; GRC=Greece; HKG=Hong Kong Special Administrative Region; HRV=Croatia; HUN=Hungary; IND=India; IRL=Ireland; ISL=Iceland; ITA=Italy; JPN=Japan; LTU=Lithuania; LUX=Luxembourg; LVA=Latvia; MDA=Republic of Moldova; MNE=Montenegro; MKD=The Former Yugoslav Republic of Macedonia; MLT=Malta; NLD=The Netherlands; NOR=Norway; NZL=New Zealand; POL=Poland; PRT=Portugal; ROM=Romania; RUS=Russian Federation; SRB=Serbia; SVK=Slovakia; SVN=Slovenia; SWE=Sweden; UKR=Ukraine; USA=United States of America; ZAF=South Africa.
Official prostate cancer mortality data were obtained from the World Health Organisation (WHO) database (World Health Organization, 2012) for the period between 1980, or the first calendar year with available data since then, and 2010, or the most recent year with data available, using the update of WHO database in 24 November 2011; countries with data available for <10 calendar years were excluded (Figure 1). Three different revisions of the International Classification of Diseases (ICD) were used to classify prostate cancer deaths in this period; we extracted the number of deaths corresponding to the codes A057 (ICD-8), B124 (ICD-9) and C61 (ICD-10), as applicable.
Estimates of the resident population in each mid-year were obtained from the 2010 revision of United Nations World Population Prospects (United Nations, 2010), even when mortality data refers to <90% of the country population (World Health Organization, 2012): Albania (70.8%), Brazil (79.7%), Republic of Moldova (83.2%), Serbia (83.1%), South Africa (76.9%) and The Former Yugoslav Republic of Macedonia (89.2%).
Age-standardised mortality rates (ASMR), and the corresponding standard errors, were calculated by the direct method, using the world standard population (Doll and Smith, 1982) as reference, for the age groups, ⩾45, 45–64 and ⩾65 years.
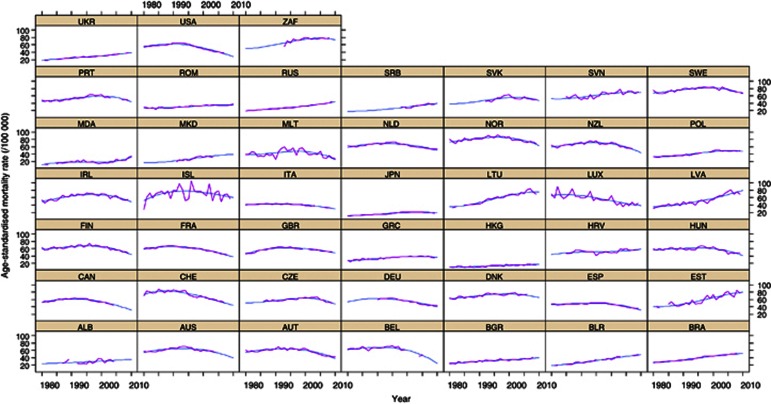
Mixed models were used to describe the time trends in the ASMR. All models included random terms by country for the intercept, slope, quadratic and cubic terms. The observed mortality rates and the model predictions are presented in Appendix 1.
Model-based clustering was used to identify groups of countries that share similar time trends in the ASMR, in the period 1980–2010, while distinguishing them from other homogeneous groups of countries regarding the variation in mortality rates. According to this method, the data (intercept, slope, quadratic and cubic terms) are assumed to have a multivariate normal distribution, parameterised by their means and covariances, generated by clusters. The geometric features (orientation, volume and shape) of the distributions are estimated from the data, and can be allowed to vary between clusters, or constrained to be the same for all clusters.
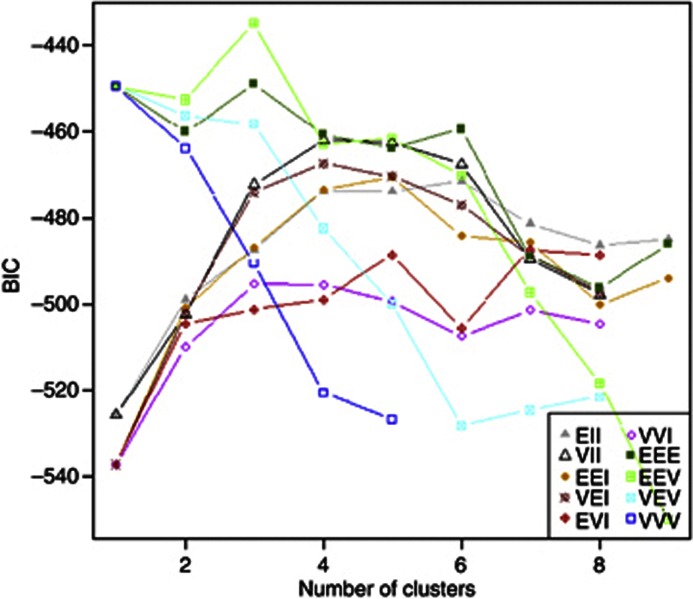
In Appendix 2, we present the Bayesian Information Criterion (BIC) for models considering different geometric features of the distribution of the data and number of clusters. We considered the type of model and number of clusters corresponding to the lowest value of BIC as the most appropriate.
The reliability of the model-based clustering was evaluated by 10-fold cross validation (Efron and Tibshirani, 1997). The sample was divided into 10 partitions, and each of the subsets of 9 out of the 10 partitions was used to construct 10 different models. The agreement between the predictions from these models and those from the model constructed with the complete data set was calculated; the overall kappa coefficient was estimated by the mean of the kappa coefficients regarding the agreement between each of the 10 subset models and the full model. Data analysis was conducted using the software R 2.14.1.
The patterns identified through the model-based approach were further characterised regarding the countries' region and GNI as well as the trends in mortality/incidence ratios.
Age-standardised incidence rates (ASIR; world standard population) and the corresponding standard errors, for the age group ⩾45 years, were abstracted from the Cancer Incidence in Five Continents database CI5plus for all the years with available data in the period 1980–2002 (International Agency for Research on Cancer, 2010). The incidence estimates reflect <15% of the national population in nine countries (Austria, France, Italy, Japan, Netherlands, Poland, Spain, Switzerland and United States of America (USA)) (Curado et al, 2007). Brazil and Germany were excluded from this analysis, because incidence data available refer to <5% of the country population. We considered incidence data from 25 of the countries eligible for the analysis of mortality trends (Figure 1).
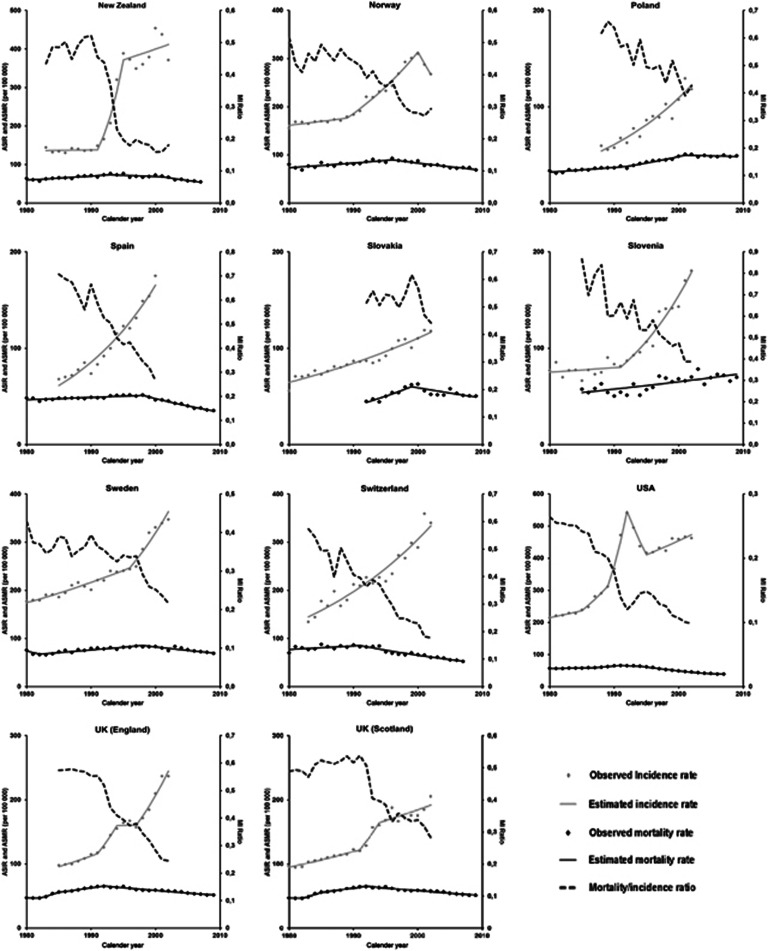
To obtain a summary measure of the relation between the incidence and mortality rates, we computed ASMR/ASIR (MI) ratios for the countries and periods from which the necessary data were available (Appendices 3 and 4). For the United Kingdom (UK), incidence data were available only from Scotland and England, and we computed the corresponding MI ratios using the specific incidence data and mortality data referring to the whole of UK.
Results
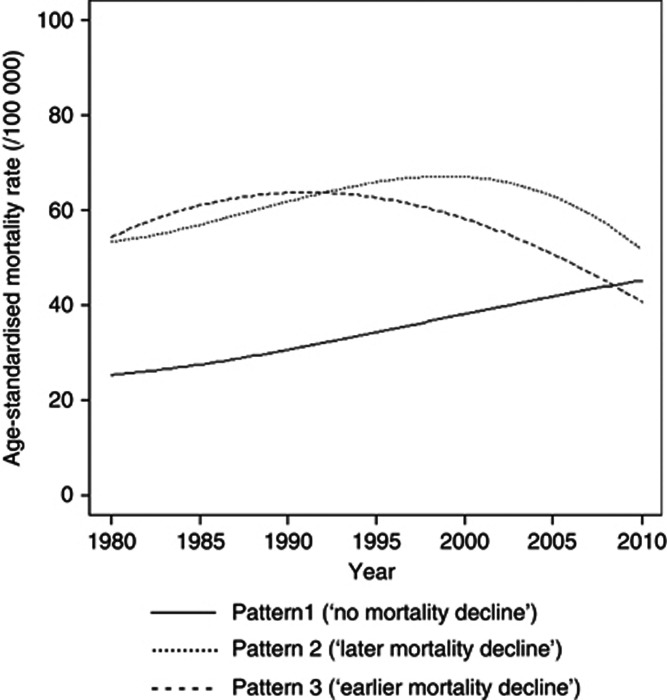
We identified three clusters of countries with similar variation in prostate cancer mortality between 1980 and 2010, including pattern 1 (18 countries), pattern 2 (12 countries) and pattern 3 (15 countries) (Figure 2 and Table 1). The reliability of the model-based clustering was good (kappa=0.72).
Figure 2.
Prostate cancer age-standardised mortality rates* (45+ years, direct method, World standard population), for each pattern identified. *Mean of the predictions for each of the countries included in the same pattern.
Table 1. Characterisation of the prostate cancer mortality patterns regarding the estimated age-standardised mortality rate (ASMR) (world standard population) in 1980, 1995 and 2010; percentage of changes in rates in the periods 1980–1995 and 1995–2010 and highest rates and corresponding year observed between 1980 and 2010, by age group.
|
Mortality rates (/100 000), median (P25–P75) |
|||
|---|---|---|---|
| Pattern 1 (‘no mortality decline') | Pattern 2 (‘later mortality decline') | Pattern 3 (‘earlier mortality decline') | |
|
45+ years | |||
|
ASMRa | |||
| 1980 | 24.2 (17.4 to 31.4) | 54.7 (44.0 to 62.2) | 53.4 (50.5 to 57.3) |
| 1995 | 31.6 (26.5 to 41.8) | 67.3 (57.1 to 72.0) | 62.2 (59.6 to 67.0) |
| 2010 |
39.9 (36.1 to 50.7) |
47.6 (43.6 to 65.0) |
39.4 (34.5 to 46.7) |
|
Variation in ASMR (%)b | |||
| 1980–1995 | 38.3 (30.3 to 51.1) | 20.3 (19.3 to 26.8) | 15.1 (8.2 to 19.0) |
| 1995–2010 |
29.5 (15.2 to 50.0) |
−22.6 (−36.5 to −11.6) |
−34.5 (−40.2 to −29.6) |
|
ASMRc | |||
| Highest value | 40.8 (38.3 to 51.1) | 74.6 (66.5 to 81.3) | 68.1 (64.8 to 72.9) |
| Year of highest value |
2007 (2002–2009) |
1999 (1996–2001) |
1992 (1991–1995) |
|
45–64 years | |||
|
ASMRa | |||
| 1980 | 5.8 (5.2 to 7.1) | 9.4 (8.1 to 11.1) | 9.2 (8.4 to 9.8) |
| 1995 | 8.6 (6.8 to 10.0) | 12.0 (10.7 to 14.0) | 10.3 (9.8 to 10.8) |
| 2010 |
8.9 (7.0 to 11.7) |
8.7 (6.7 to 9.6) |
6.3 (5.3 to 7.6) |
|
Variation in ASMR (%)b | |||
| 1980–1995 | 43.8 (21.8 to 54.8) | 24.3 (15.1 to 41.0) | 10.8 (−1.1 to 21.1) |
| 1995–2010 |
12.8 (−7.8 to 25.2) |
−32.8 (−35.8 to −17.1) |
−35.6 (−42.5 to −25.7) |
|
ASMRc | |||
| Highest value | 11.6 (8.8 to 13.4) | 15.3 (13.2 to 17.0) | 13.2 (12.7 to 14.7) |
| Year of highest value |
2002 (1998–2005) |
1995 (1989–2000) |
1990 (1988–1992) |
|
65+ years | |||
| ASMRa | |||
| 1980 | 72.3 (51.0 to 98.8) | 182.5 (144.2 to 200.4) | 178.5 (166.0 to 186.7) |
| 1995 | 93.4 (76.5 to 129.4) | 219.9 (183.6 to 231.9) | 201.1 (196.0 to 218.6) |
| 2010 |
125.7 (113.0 to 162.6) |
149.0 (140.3 to 218.1) |
127.3 (111.9 to 157.2) |
|
Variation in ASMR (%)b | |||
| 1980–1995 | 43.0 (29.4 to 50.7) | 19.9 (18.8 to 30.7) | 14.8 (8.8 to 17.9) |
| 1995–2010 |
34.7 (18.5 to 53.6) |
−22.7 (−36.2 to −8.6) |
−35.4 (−40.5 to −28.8) |
|
ASMRc | |||
| Highest value | 126.3 (111.7 to 164.1) | 245.0 (214.2 to 255.2) | 224.4 (210.3 to 239.9) |
| Year of highest value | 2007 (2002–2009) | 2000 (1997–2000) | 1993 (1991–1995) |
Abbreviations: ASMR=age-standardised mortality rate; P25=percentile 25; P75=percentile 75.
ASMR, estimated age-standardised mortality rate (model predictions).
Variation in ASMR (%), relative percentage of change in the estimated age-standardised mortality rate.
ASMR, observed age-standardised mortality rate.
Pattern 1, labelled as ‘no mortality decline', is characterised by the lowest rates in 1980, nearly half the observed for the other patterns, and a steady increase between 1980 and 2010; the mortality rates almost doubled, from 24.2 out of 100 000 in 1980 to 40.8 per 100 000 close to 2010.
Patterns 2 and 3 are characterised by similar ASMR in 1980 (close to 55 per 100 000 at age ⩾45 years), as well as by an inflection in the increasing trends between 1980 and 2010. In both patterns, the mortality rates declined approximately 40% from the highest values observed in this period to the rates in 2010. They differ essentially in the year when the decline starts; the highest rates observed in this period are observed nearly a decade earlier in pattern 3, and in the rates estimated for 2010, which are also lower for pattern 3. Patterns 2 and 3 were labelled ‘later mortality decline' and ‘earlier mortality decline' patterns, respectively.
The main distinctive features of the patterns were essentially the same when only the age groups 45–64 or 65+ years were considered, although in the younger the inflection in the rates started sooner in all the patterns (Table 1).
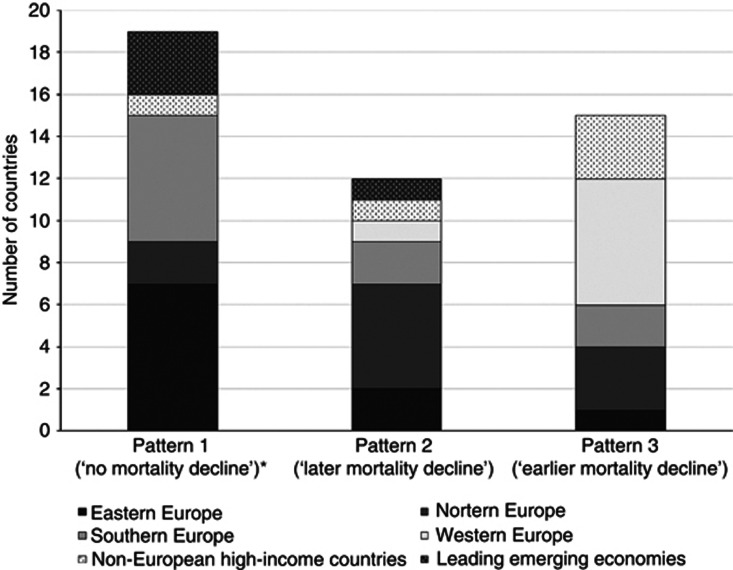
Although Southern and Eastern European countries are predominant in pattern 1 (‘no mortality decline'), and Northern and Western European countries were assigned mainly to patterns 2 (‘later mortality decline') and 3 (‘earlier mortality decline'), respectively, all clusters include countries from at least five of the six regions/groups considered (Figure 3).
Figure 3.
Number of countries from each region, by pattern of prostate cancer mortality trends. *In pattern 1, Russian Federation is represented twice, among Eastern European countries and the selected leading emerging economies.
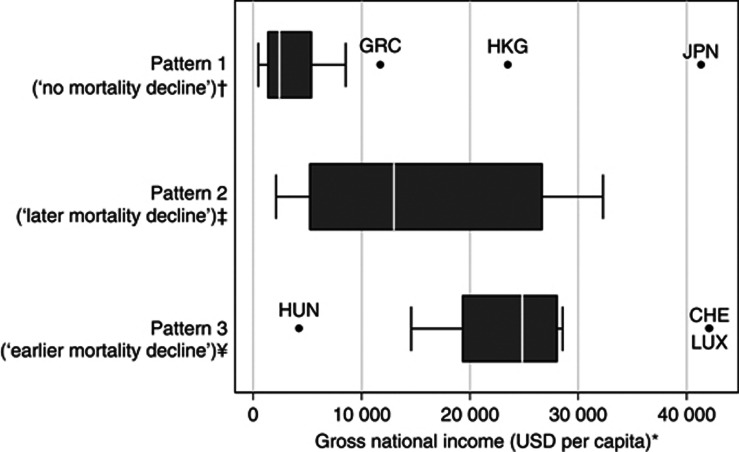
Regarding the distribution of the GNI per capita, pattern 1 included mostly countries that were below the World Bank cutoff to define upper middle-income countries (3036 USD, in 1995 (The World Bank, 2012)) and pattern 3 included almost exclusively high income countries (>9385 USD, in 1995 (The World Bank, 2012)). However, the distribution of the GNI per capita in pattern 2 (‘later mortality decline') overlapped the observed for patterns 1 and 3 (Figure 4).
Figure 4.
Gross national income per capita, by pattern of prostate cancer mortality trends. *The gross national income per capita (Atlas method) (GNI) in 1995 (the midpoint of the period under analysis) was obtained from the World Bank database (The World Bank, 2012). For Croatia, we used the GNI in 1997; for Serbia, we used the GNI in 1999; and for Estonia and Czech Republic, we used the GNI in 2002, as these were the first years with available data for these countries. †According to the World Bank classification of economic development, this pattern includes two countries classified as low income (GNI <765 USD), eight countries classified as lower middle income (GNI between 766 and 3035 USD), five countries classified as upper middle income (GNI between 3036 and 9385 USD) and three countries classified as high income (GNI >9385 USD). ‡According to the World Bank classification of economic development, this pattern includes one country classified as lower middle income (GNI between 766 and 3035 USD), four countries classified as upper middle income (GNI between 3036 and 9385 USD) and seven countries classified as high income (GNI >9385 USD). ¥According to the World Bank classification of economic development, this pattern includes one country classified as upper middle income (GNI between 3036 and 9385 USD) and 14 countries classified as high income (GNI >9385 USD). CHE=Switzerland; GRC=Greece; HKG=Hong Kong Special Administrative Region; HUN=Hungary; JPN=Japan; LUX=Luxembourg; USD=United States dollars.
In the ‘earlier' and ‘later' mortality decline patterns, the MI ratios were <0.5 since the beginning and reached figures as low as 0.2, which reflects the mortality declines, but mostly marked upward trends in the incidence rates; in many countries, the absolute changes in ASIR were higher than 100 per 100 000.
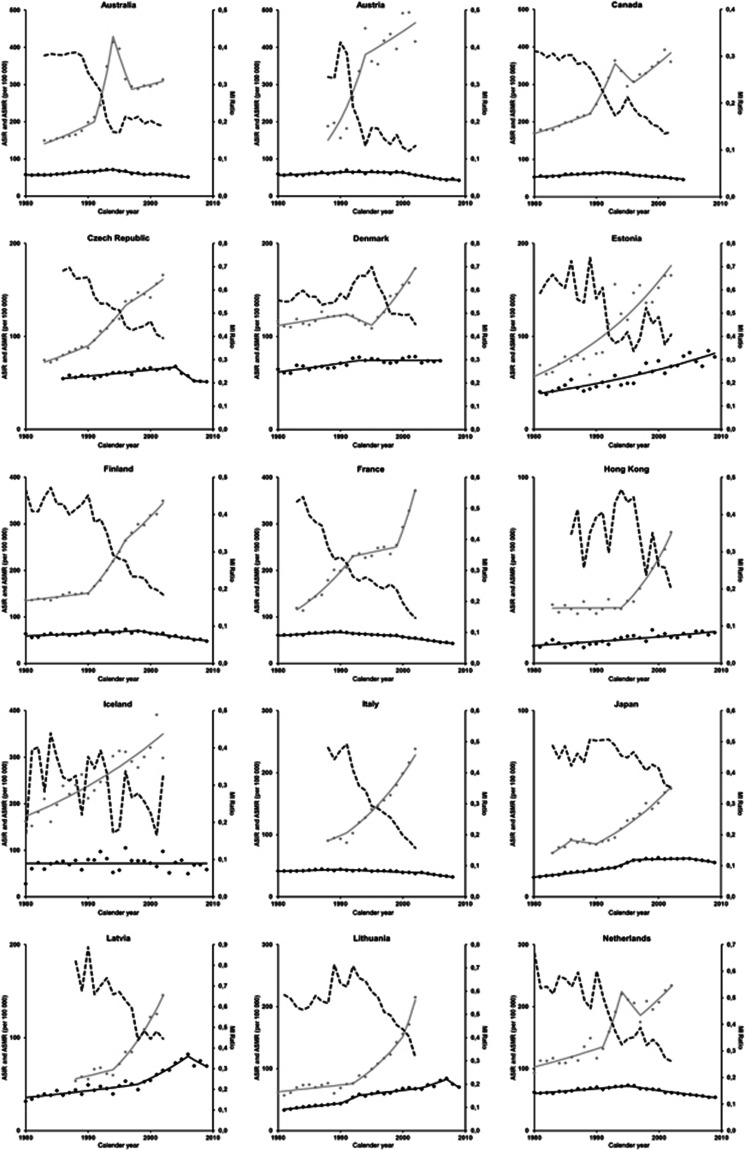
Regarding the trends in ASIR (Appendices 3 and 4), in most of the countries classified in pattern 3 (‘earlier mortality decline') we can identify three periods with distinct patterns of variation in incidence and mortality. First, there is a steady increase in the ASIR, also along with increasing ASMR, though at a smaller pace than incidence, approximately up to the late 1980s or the early 1990s. In a second period, usually lasting <5 years, the ASIR increased much more steeply than before while, the annual percent increase in ASMR remained similar to the observed in the first period. The third period is characterised by a decline in ASMR, while ASIR are still increasing.
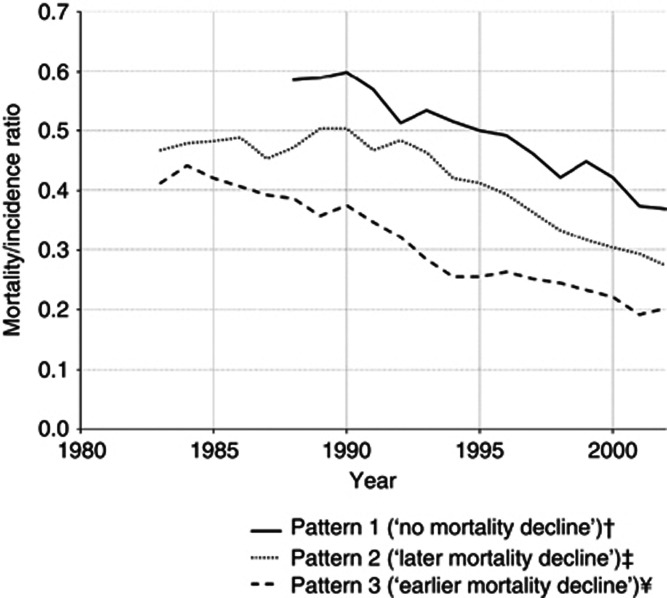
This is summarised in Figure 5, showing the trends in the MI ratios, which were above 0.4 in the early 1980s, decrease slightly in the first period, declined steeply in the second period, to <0.3, and still present a downward trend in the third period, to reach values close to 0.2 in 2002. Pattern 3 (‘earlier mortality decline') presents the lowest values of MI ratio during the whole period of analysis, and it started to decline around 1985, approximately 7 years before the decline in mortality rates in this pattern.
Figure 5.
Mortality/incidence ratio for prostate cancer* (age 45+ years), for each pattern identified. †Includes the countries for which it was possible to compute MI ratios between 1988 and 2002 (Estonia, Hong Kong SAR, Japan, Latvia; Poland, Slovenia); ‡includes the countries for which it was possible to compute MI ratios between 1983 and 2002 (Denmark; Finland; Lithuania; New Zealand; Norway; Sweden); ¥includes the countries for which it was possible to compute MI ratios between 1983 and 2002 (Australia; Canada; France; Netherlands; Iceland; Switzerland; United Kingdom§; United States of America). §To represent the United Kingdom, we used incidence data from Scotland because incidence data available from England refers to less than the period considered for this analyses. *Each line represents the mean of the MI ratios of the countries included in the same pattern.
Pattern 2 (‘later mortality decline') is characterised by an almost stable MI ratio up to 1990, with values close to 0.5, and then by a decline until the end of the period, with values close to 0.30 in 2002. The decrease of the MI ratio occurred about 9 years before the inflection of the upward trends in mortality rates, and approximately 5 years later than in the countries classified in pattern 3 (‘earlier mortality decline'). Within pattern 2 (‘later mortality decline'), Slovakia and Denmark are an exception to this general model of variation; in both the countries, the MI ratios were above 0.4 throughout the whole period and the ASMR declined or stabilised, respectively, before steep increases in the ASIR could be observed.
Pattern 1 (‘no mortality decline') is characterised by a decrease in MI ratio since the early 1990s, although maintaining the highest values throughout the period of analysis. In 2002, the MI ratio was close to the observed in the countries classified in the other patterns when mortality started to decline.
Discussion
Our analysis of recent trends in prostate cancer mortality identified three main patterns of variation in ASMR between 1980 and 2010. Pattern 1 is characterised by a continued increase in mortality throughout the whole period, while patterns 2 and 3 depict upward trends in the first years and subsequent declines, starting in the late and early 1990s, respectively. There was also a levelling of prostate cancer mortality worldwide, hence the difference between the main patterns was >50% in 1980 and <20% in 2010.
We used an original approach to summarise the trends in prostate cancer mortality rates in different countries, and the unconstrained analysis of mortality patterns is the major strength of this paper. Model-based clustering has several statistical advantages over standard cluster approaches. It provides cluster solutions with 10 different covariance structures, while the most popular heuristic clustering methods (Ward's and K-means) only allow one type covariance structure (Fraley and Raftery, 2002), and also allows the choice of the model and the number of clusters to be recast as statistical model choice problems based on information criteria. The latter is also an advantage regarding factor analysis, where there is no model-based classification (Muthén, 2006).
Our study adds to previous research on this topic the identification of three clusters of countries that are homogeneous regarding the variation in prostate cancer mortality, as well the trends in MI ratios, while remaining heterogeneous regarding the distribution of variables traditionally used for an a priori grouping of the countries, namely geographical region and GNI per capita.
The MI ratio can be interpreted as a marker of the intensity of early diagnosis in different countries, as in the period under analysis its variation depended mostly on sharp increases in incidence, especially before mortality declines could be observed. Therefore, the assessment of its trends provides valuable empirical evidence for the discussion of the determinants of the patterns in mortality trends, given the scarcity of national data on the frequency of early diagnosis in several countries across time.
In pattern 3 (‘earlier mortality decline'), the steady increase in the ASIR even before the ‘PSA era' probably reflects an increased diagnosis of prostate cancer due to the use of transurethral resection of the prostate to treat benign prostate hyperplasia (BPH) (Merril et al, 1999). The sharp increase around 1990 is consistent with widespread PSA testing. The estimates of the lead time associated with PSA screening range between 5 and 12 years (Draisma et al, 2003, 2009), but the lag between the steep increase in incidence rates and the mortality declines tends to be a few years only.
Earlier prostate cancer detection coupled with the increased rates of radical prostatectomy for localised prostate cancer and the introduction of antiandrogen therapy that began before the introduction of PSA testing could contribute to the observed decline in ASMR (Feuer et al, 1999; Mettlin, 2000). Moreover, during the 1980s and 1990s, there was a rapid rise in the use of radiotherapy and radical prostatectomy in the USA and in Europe for early disease (Selley et al, 1997), and in the 1990s there were improvements in those techniques (Peschel and Colberg, 2003).
In pattern 2 (‘later mortality decline'), the MI ratios were relatively stable up to 1990 and decreased steeply thereafter; at this point in time the MI ratios were also much higher in pattern 2 (‘later mortality decline') than in pattern 3 (‘earlier mortality decline'). The differences between the ‘earlier' and ‘later' mortality decline patterns may also be explained by the different extension to which early diagnosis is accomplished in each of these settings. In Denmark and Sweden, a steep increase in ASIR was seen approximately 5 years later than in the general trend of pattern 2 (‘later mortality decline'). This could be the result of the limited use of PSA testing until around 1995 as a consequence of recommendations against opportunistic screening in asymptomatic men (Kvâle et al, 2007), associated with the less frequent treatment for BPH (Møller, 2001). In Norway, the decline in ASIR after 2001 corresponds to a decline in PSA testing, as a result of the issuing of recommendations to all general practitioners and urologists, similar to those made earlier in Denmark and Sweden (Norderhaug et al, 2003).
Regarding pattern 1 (‘no mortality decline'), Hong Kong Special Administrative Region (SAR), Japan, Latvia and Slovenia had a pronounced increase of incidence rates between 1990 and 1994, and in the remaining countries the ASIR increased at a steady rate. This pattern, however, is characterised by a gradual decline in the MI ratios, though never reaching values as low as those observed for the ‘earlier' and ‘later' mortality decline patterns. The inflection of mortality rates occurred only in Latvia and Japan, 12 and 15 years after the start of the rapid increased of incidence, respectively, which is consistent with a late effect of PSA testing in these countries.
The interpretation of our findings needs to account the accuracy of the mortality data. First, mortality rates were computed using the UN estimates for the overall population of each country and the number of deaths in some countries refers only to a part of the population. However, the underestimation of the ASMR in those settings is not expected to compromise the comparison of the rates over time. Second, the adoption of three different revisions of ICD across the period considered could result in misclassification, although this is expected to have occurred in a small extent for prostate cancer (Klebba, 1980; Geran et al, 2005). Third, the reliability and validity of death certification may vary across settings and calendar years, especially in the selected leading emerging economies and some of middle-income countries included in our analyses. Although it is difficult to predict the extent to which these changes may have biased the magnitude and trends of the prostate cancer mortality rates, it is unlikely to have influenced the conclusions of our study. In fact, we identified three main patterns that are clearly distinct from each other and can accommodate differences between countries larger than could be expected from the heterogeneity in the quality of the data. This is supported by the fact that model-based clustering yielded essentially the same results when different subsets of the eligible countries were considered. However, some individual countries may have been misclassified regarding the cluster in which they were included, especially those that depict a pattern of variation compatible with more than one pattern. For example, South Africa was included in pattern 2 (‘later mortality decline'), while presenting an ASMR in 1980 closer to the observed for the other countries classified in the same pattern, along with a variation of ASMR across time compatible with the observed for pattern 1 (‘no mortality decline').
We opted for using incidence data obtained from the CI5plus database to ensure a higher homogeneity of data quality, which may be expected to minimise the potential bias associated with using data obtained from sources more heterogeneous regarding their quality standards. Therefore, the trends in the countries with sub-national data may not apply to the whole country, and the MI ratio estimates may be biased. However, our results and conclusions are robust and not dependent on accounting for any specific country; the trends in the MI ratios were essentially the same when sensitivity analyses (figures not shown) were conducted by excluding the countries with incidence data for <30% of the population or less than full coverage (though in the ‘earlier mortality decline' pattern, only Iceland had incidence data for the whole population).
Our analyses, including incidence data, could be also limited because the period covered by CI5plus extends only up to 2002. However, both for the ‘earlier' and ‘later' mortality decline patterns, no additional data is needed to interpret the mortality trends, as declines started to be observed before 2002, and the analysis of MI ratios in these countries sets a benchmark for the interpretation of the trends observed in the ‘no mortality decline' pattern. Although no data were available for all the countries, the validity of our findings regarding the main objective of identifying patterns of variation in prostate cancer mortality is not compromised, as incidence data was used mostly for a finer characterisation and interpretation of the patterns identified.
In conclusion, we provide a general model for the description and interpretation of the trends in prostate cancer mortality worldwide in the past decades, based on three main patterns homogeneous regarding the trends in mortality and MI ratio, each of them including countries from different regions and distinct categories of GNI.
Acknowledgments
The work of Carlo La Vecchia was supported by the Italian Association for Research on Cancer (AIRC, contract no. 10068).
Appendix 1
Figure A1.
Observed and predicted age-standardised mortality rate (direct method, world standard population), in the age group 45+ years. ALB=Albania; AUS=Australia; AUT=Austria; BEL=Belgium; BGR=Bulgaria; BLR=Belarus; BRA=Brazil; CAN=Canada; CHE=Switzerland; CHN=China; CZE=Czech Republic; DEU=Germany; DNK=Denmark; ESP=Spain; EST=Estonia; FIN=Finland; FRA=France; GBR=United Kingdom; GRC=Greece; HKG=Hong Kong Special Administrative Region; HRV=Croatia; HUN=Hungary; IRL=Ireland; ISL=Iceland; ITA=Italy; JPN=Japan; LTU=Lithuania; LUX=Luxembourg; LVA=Latvia; MDA=Republic of Moldova; MKD=The Former Yugoslav Republic of Macedonia; MLT=Malta; NLD=The Netherlands; NOR=Norway; NZL=New Zealand; POL=Poland; PRT=Portugal; ROM=Romania; RUS=Russian Federation; SRB=Serbia; SVK=Slovakia; SVN=Slovenia; SWE=Sweden; UKR=Ukraine; USA=United States of America; ZAF=South Africa.
Appendix 2
Figure A2.
Bayesian Information Criterion for models considering different geometric features (orientation, volume and shape) of the distribution of the data (intercept, slope, quadratic and cubic terms) and number of clusters. BIC—Bayesian Information Criterion (the plot depicts the BIC value multiplied by −1);
EII—Equal volume, equal shape, non-applicable orientation;
VII—Variable volume, equal shape, non-applicable orientation;
EEI—Equal volume, equal shape, coordinate axes orientation;
VEI—Variable volume, equal shape, coordinate axes orientation;
EVI—Equal volume, variable shape, coordinate axes orientation;
VVI—Variable volume, variable shape, coordinate axes orientation;
EEE—Equal volume, equal shape, equal orientation;
EEV—Equal volume, equal shape, variable orientation;
VEV—Variable volume, equal shape, variable orientation;
VVV—Variable volume, variable shape, variable orientation.
Appendix 3
Figure A3.
Trends in age-standardised (45+ years, direct method, world standard population) mortality rates (ASMR), age-standardised (45+ years, direct method, world standard population) incidence rates (ASIR) and ASMR/ASIR (MI) ratios.
Appendix 4
Table A1. Annual percent change (APC)a in age-standardised (45+ years, direct method, world standard population) mortality rates (ASMR), age-standardised (45+ years, direct method, world standard population) incidence rates (ASIR) in the periods identified by joinpoint analysis.
| |
|
Trend 1 |
Trend 2 |
Trend 3 |
Trend 4 |
Trend 5 |
|||||
|---|---|---|---|---|---|---|---|---|---|---|---|
| Region/country | Period | APC (95%CI) | Period | APC (95%CI) | Period | APC (95%CI) | Period | APC (95%CI) | Period | APC (95%CI) | |
| Australia |
ASIR |
1983–1991 |
4.5 (3.2 to 5.8) |
1991–1994 |
28.9 (18.9 to 39.9) |
1994–1997 |
−12.5 (−18.7 to −5.8) |
1997–2002 |
1.4 (−0.3 to 3.2) |
|
|
| |
ASMR |
1980–1983 |
−0.5 (−4.4 to 3.7) |
1983–1994 |
2.2 (1.6 to 2.7) |
1994–1999 |
−4.1 (−5.8 to −2.3) |
1999–2002 |
0.6 (−5.0 to 6.6) |
2002–2006 |
−3.7 (−5.4 to −1.9) |
| Austria |
ASIR |
1988–1994 |
16.7 (7.2 to 27.0) |
1994–2002 |
2.5 (−1.4 to 6.7) |
|
|
|
|
|
|
| |
ASMR |
1980–1991 |
1.4 (0.7 to 2.1) |
1991–2000 |
−0.3 (−1.3 to 0.7) |
2000–2006 |
−5.2 (−7.3 to −3.1) |
2006–2010 |
−2.1 (−5.1 to 1.1) |
|
|
| Canada |
ASIR |
1980–1989 |
3.1 (1.9 to 4.3) |
1989–1993 |
12.5 (7.0 to 18.2) |
1993–1996 |
−5.0 (−13.4 to 4.2) |
1996–2002 |
3.9 (2.4 to 5.4) |
|
|
| |
ASMR |
1980–1992 |
1.8 (1.3 to 2.2) |
1992–2004 |
−2.7 (−3.1 to −2.3) |
|
|
|
|
|
|
| Hong Kong SAR |
ASIR |
1983–1994 |
0.1 (−1.8 to 1.9) |
1994–2002 |
11.2 (9.2 to 13.2) |
|
|
|
|
|
|
| |
ASMR |
1980–2009 |
2.0 (1.5 to 2.5) |
|
|
|
|
|
|
|
|
| Czech Republic |
ASIR |
1983–1990 |
3.2 (1.5 to 4.9) |
1990–1996 |
6.8 (4.4 to 9.2) |
1996–2002 |
3.2 (1.8 to 4.7) |
|
|
|
|
| |
ASMR |
1986–2004 |
1.1 (0.8 to 1.4) |
2004–2007 |
−8.0 (−14.9 to −0.4) |
2007–2009 |
−0.9 (−8.3 to 7.2) |
|
|
|
|
| Denmark |
ASIR |
1980–1991 |
0.9 (0.3 to 1.6) |
1991–1995 |
−2.5 (−6.9 to 2.2) |
1995–2002 |
6.5 (5.3 to 7.7) |
|
|
|
|
| |
ASMR |
1980–1993 |
1.4 (0.8 to 2.1) |
1993–2006 |
−0.0 (−0.6 to 0.5) |
|
|
|
|
|
|
| Estonia |
ASIR |
1980–2002 |
5.3 (4.2 to 6.3) |
|
|
|
|
|
|
|
|
| |
ASMR |
1981–2009 |
2.7 (2.2 to 3.2) |
|
|
|
|
|
|
|
|
| Finland |
ASIR |
1980–1990 |
1.1 (0.5 to 1.8) |
1990–1996 |
9.9 (8.4 to 11.4) |
1996–2002 |
4.4 (3.6 to 5.2) |
|
|
|
|
| |
ASMR |
1980–1998 |
1.0 (0.6 to 1.4) |
1998–2009 |
−3.2 (−3.9 to −2.5) |
|
|
|
|
|
|
| France |
ASIR |
1983–1992 |
8.0 (6.3 to 9.7) |
1992–1999 |
1.2 (−1.0 to 3.4) |
1999–2002 |
14.3 (8.5 to 20.4) |
|
|
|
|
| |
ASMR |
1980–1989 |
1.4 (0.9 to 1.8) |
1989–1999 |
−1.3 (−1.6 to −0.9) |
1999–2008 |
−3.5 (−3.8 to −3.1) |
|
|
|
|
| Iceland |
ASIR |
1980–2002 |
3.3 (2.5 to 4.0) |
|
|
|
|
|
|
|
|
| |
ASMR |
1980–2009 |
0.0 (−1.0 to 1.0) |
|
|
|
|
|
|
|
|
| Italy |
ASIR |
1988–1991 |
4.4 (2.4 to 6.4) |
1991–2002 |
7.5 (7.0 to 8.1) |
|
|
|
|
|
|
| |
ASMR |
1980–1990 |
0.7 (0.1 to 1.2) |
1990–2003 |
−1.0 (−1.3 to −0.6) |
2003 –2008 |
−3.8 (−5.0 to −2.5) |
|
|
|
|
| Japan |
ASIR |
1983–1986 |
8.7 (−3.4 to 22.4) |
1986–1990 |
−1.7 (−11.1 to 8.8) |
1990–2002 |
6.3 (5.4 to 7.2) |
|
|
|
|
| |
ASMR |
1980–1993 |
3.1 (2.7 to 3.5) |
1993–1996 |
7.9 (2.2 to 13.9) |
1996–2005 |
0.4 (−0.1 to 0.9) |
2005–2009 |
−2.8 (−4.0 to −1.5) |
|
|
| Latvia |
ASIR |
1988–1994 |
2.7 (−0.6 to 6.2) |
1994–2002 |
10.4 (8.7 to 12.1) |
|
|
|
|
|
|
| |
ASMR |
1980–1998 |
1.9 (1.2 to 2.6) |
1998–2006 |
6.1 (3.9 to 8.3) |
2006–2009 |
−4.8 (−11.3 to 2.1) |
|
|
|
|
| Lithuania |
ASIR |
1980–1992 |
1.6 (0.2 to 3.0) |
1992–2000 |
9.0 (6.5 to 11.5) |
2000–2002 |
18.1 (4.3 to 33.6) |
|
|
|
|
| |
ASMR |
1981–1990 |
2.8 (1.7 to 3.9) |
1990–1993 |
9.0 (−1.5 to 20.6) |
1993–2003 |
1.9 (1.1 to 2.7) |
2003–2007 |
4.7 (0.8 to 8.8) |
2007–2009 |
−8.4 (−15.3 to −0.9) |
| Netherlands |
ASIR |
1980–1991 |
2.5 (0.6 to 4.5) |
1991–1994 |
18.3 (−4.3 to 46.3) |
1994–1997 |
−6.0 (−21.9 to 13.1) |
1997–2002 |
4.6 (0.6 to 8.7) |
|
|
| |
ASMR |
1980–1995 |
1.2 (1.0 to 1.5) |
1995–2010 |
−2.1 (−2.4 to −1.9) |
|
|
|
|
|
|
| New Zealand |
ASIR |
1983–1991 |
0.1 (−4.0 to 4.4) |
1991–1995 |
28.1 (11.6 to 47.2) |
1995–2002 |
1.5 (−1.3 to 4.3) |
|
|
|
|
| |
ASMR |
1980–1993 |
1.6 (0.9 to 2.3) |
1993–2001 |
−0.9 (−2.3 to 0.5) |
2001–2007 |
−3.8 (−5.5 to −2.1) |
|
|
|
|
| Norway |
ASIR |
1980–1989 |
1.0 (0.1 to 1.9) |
1989–2000 |
5.4 (4.7 to 6.1) |
2000–2002 |
−7.8 (−15.0 to 0.0) |
|
|
|
|
| |
ASMR |
1980–1996 |
1.3 (0.8 to 1.7) |
1996–2009 |
−1.9 (−2.5 to −1.4) |
|
|
|
|
|
|
| Poland |
ASIR |
1988–2002 |
6.0 (4.8 to 7.2) |
|
|
|
|
|
|
|
|
| |
ASMR |
1980–1992 |
1.4 (1.0 to 1.9) |
1992–2001 |
3.0 (2.3 to 3.7) |
2001–2009 |
−0.3 (−0.9 to 0.3) |
|
|
|
|
| Spain |
ASIR |
1985–2000 |
6.8 (6.0 to 7.6) |
|
|
|
|
|
|
|
|
| |
ASMR |
1980–1998 |
0.5 (0.3 to 0.7) |
1998–2009 |
−3.4 (−3.7 to −3.1) |
|
|
|
|
|
|
| Slovakia |
ASIR |
1980–2002 |
2.7 (2.4 to 3.1) |
|
|
|
|
|
|
|
|
| |
ASMR |
1992–1999 |
4.6 (2.3 to 6.9) |
1999–2009 |
−2.0 (−3.1 to −0.8) |
|
|
|
|
|
|
| Slovenia |
ASIR |
1980–1991 |
0.6 (−1.2 to 2.4) |
1991–2002 |
7.6 (6.2 to 9.0) |
|
|
|
|
|
|
| |
ASMR |
1985–2009 |
1.3 (0.8 to 1.7) |
|
|
|
|
|
|
|
|
| Sweden |
ASIR |
1980–1996 |
2.2 (1.7 to 2.7) |
1996–2002 |
6.7 (4.9 to 8.5) |
|
|
|
|
|
|
| |
ASMR |
1980–1982 |
−4.3 (−13.8 to 6.2) |
1982–1998 |
1.5 (1.1 to 1.9) |
1998–2010 |
−1.8 (−2.3 to −1.3) |
|
|
|
|
| Switzerland |
ASIR |
1983–2002 |
4.5 (3.8 to 5.1) |
|
|
|
|
|
|
|
|
| |
ASMR |
1980–1991 |
0.9 (−0.0 to 1.8) |
1991–2007 |
–2.9 (−3.4 to −2.5) |
|
|
|
|
|
|
| USA |
ASIR |
1980–1985 |
2.0 (−0.3 to 4.2) |
1985–1989 |
7.2 (2.7 to 12.0) |
1689–1992 |
20.3 (12.3 to 28.9) |
1992–1995 |
−9.0 (−14.8 to −2.9) |
1995–2002 |
2.0 (1.1 to 2.9) |
| |
ASMR |
1980–1987 |
0.7 (0.3 to 1.1) |
1987–1991 |
2.8 (1.4 to 4.3) |
1991–1994 |
−1.1 (−3.6 to 1.6) |
1994–2004 |
−4.3 (−4.5 to −4.0) |
2004–2007 |
−2.2 (−3.7 to −0.8) |
| UK (England) |
ASIR |
1985–1991 |
3.2 (0.7 to 5.8) |
1991–1994 |
11.3 (−1.6 to 25.9) |
1994–1997 |
0.1 (−10.3 to 11.8) |
1997–2002 |
8.8 (6.4 to 11.2) |
|
|
| |
ASMR |
1980–1982 |
−0.4 (−6.2 to 5.7) |
1982–1985 |
6.2 (0.5 to 12.3) |
1985–1992 |
2.3 (1.5 to 3.2) |
1992–2009 |
−1.4 (−1.6 to −1.2) |
|
|
| UK (Scotland) |
ASIR |
1980–1991 |
2.4 (1.2 to 3.5) |
1991–1994 |
10.3 (−3.7 to 26.3) |
1994–2002 |
1.9 (0.6 to 3.2) |
|
|
|
|
| ASMR | 1980–1982 | −0.4 (−6.2 to 5.7) | 1982–1985 | 6.2 (0.5 to 12.3) | 1985–1992 | 2.3 (1.5 to 3.2) | 1992–2009 | −1.4 (−1.6 to −1.2) | |||
Abbreviation: CI=confidence interval.
aThe APC and the corresponding 95% CIs were estimated by joinpoint regression, using the software Joinpoint. Several models were adjusted using different number of joinpoints, from zero to four; models were compared to identify the one which better fitted data; in Estonia, Italy, Lithuania, Slovakia, Poland and the USA, mortality data were missing for 1–2 calendar years, and we estimated the rates in these years by assuming a constant trend.
The authors declare no conflict of interest.
Footnotes
This work is published under the standard license to publish agreement. After 12 months the work will become freely available and the license terms will switch to a Creative Commons Attribution-NonCommercial-Share Alike 3.0 Unported License.
References
- Andriole GL, Crawford ED, Grubb RLr, Buys SS, Chia D, Church TR, Fouad MN, Isaacs C, Kvale P, Reding DJ, Weissfeld JL, Yokochi LA, O'Brien B, Ragard LR, Clapp JD, Rathmell JM, Riley TL, Hsing AW, Izmirlian G, Pinsky PF, Kramer BS, Miller AB, Gohagan JK, Prorok PC. Prostate cancer screening in the randomized prostate, lung, colorectal, and ovarian cancer screening trial: mortality results after 13 years of follow-up. J Natl Cancer Inst. 2012;104 (2:125–132. doi: 10.1093/jnci/djr500. [DOI] [PMC free article] [PubMed] [Google Scholar]
- Bill-Axelson A, Holmberg L, Ruutu M, Garmo H, Stark JR, Busch C, Nordling S, Häggman M, Andersson SO, Bratell S, Spångberg A, Palmgren J, Steineck G, Adami HO, Johansson J. Radical prostatectomy versus watchful waiting in early prostate cancer. N Engl J Med. 2011;364 (48:1708–1717. doi: 10.1056/NEJMoa1011967. [DOI] [PubMed] [Google Scholar]
- Bolla M, Collette L, Blank L, Warde P, Dubois JB, Mirimanoff RO, Storme G, Bernier J, Kuten A, Sternberg C, Mattelaer J, Lopez Torecilla J, Pfeffer JR, Lino Cutajar C, Zurlo A, Pierart M. Long-term results with immediate androgen suppression and external irradiation in patients with locally advanced prostate cancer (an EORTC study): a phase III randomised trial. Lancet. 2002;360 (9327:103–106. doi: 10.1016/s0140-6736(02)09408-4. [DOI] [PubMed] [Google Scholar]
- Bosetti C, Bertuccio P, Chatenoud L, Negri E, La Vecchia C, Levi F. Trends in mortality from urologic cancers in Europe, 1970–2008. Eur Urol. 2011;60 (1:1–15. doi: 10.1016/j.eururo.2011.03.047. [DOI] [PubMed] [Google Scholar]
- Bouchardy C, Fioretta G, Rapiti E, Verkooijen HM, Rapin CH, Schmidlin F, Miralbell R, Zanetti R. Recent trends in prostate cancer mortality show a continuos decrease in several countries. Int J Cancer. 2008;123 (2:421–429. doi: 10.1002/ijc.23520. [DOI] [PubMed] [Google Scholar]
- Bray F, Lorlet-Tieulen J, Ferlay J, Forman D, Auvinen A. Prostate cancer incidence and mortality trends in 37 European countries: an overview. Eur J Cancer. 2010;46 (17:3040–3052. doi: 10.1016/j.ejca.2010.09.013. [DOI] [PubMed] [Google Scholar]
- Center MM, Jemal A, Lorlet-Tieulen J, Ward E, Ferlay J, Brawley O, Bray F. International variation in prostate cancer incidence and mortality rates. Eur Urol. 2012;61 (6:1079–1092. doi: 10.1016/j.eururo.2012.02.054. [DOI] [PubMed] [Google Scholar]
- Collin SM, Martin RM, Metcalfe C, Gunnell D, Albertsen PC, Neal D, Hamdy F, Stephens P, Lane JA, Moore R, Donovan J. Prostate-cancer mortality in the USA and UK in 1975–2004: an ecological study. Lancet Oncol. 2008;9 (5:445–452. doi: 10.1016/S1470-2045(08)70104-9. [DOI] [PMC free article] [PubMed] [Google Scholar]
- Curado MP, Edwards B, Shin HR, Storm H, Ferlay J, Heanue M, Boyle P. Cancer Incidence in Five Continents, Vol. IX. IARC Scientific Publications No. 160. IARC: Lyon; 2007. [Google Scholar]
- Doll R, Smith P.1982Comparison between registries: age-standardized rates Cancer Incidence in Five Continents, Vol IV IARC Scientific Publication No 42Waterhouse J, Muir C, Shanmugaratnam K, Powell J, Peacham D, Whelan S (eds) pp671–675.International Agency for Research on Cancer: Lyon, France [Google Scholar]
- Draisma G, Boer R, Otto SJ, van der Cruijsen IW, Damhuis RA, Schrõder FH, de Koning H. Lead times and overdetection due to prostate-specific antigen screening: estimates from the European randomized study of screening for prostate cancer. J Natl Cancer Inst. 2003;95 (12:868–878. doi: 10.1093/jnci/95.12.868. [DOI] [PubMed] [Google Scholar]
- Draisma G, Etzioni R, Tsodikov A, Mariotto A, Wever E, Gulati R, Feuer E, de Koning H. Lead time and overdiagnosis in prostate-specific antigen screening: importance of methods and context. J Natl Cancer Inst. 2009;101 (6:374–383. doi: 10.1093/jnci/djp001. [DOI] [PMC free article] [PubMed] [Google Scholar]
- Efron B, Tibshirani R. Improvements on Cross-Validation: The 632+ Bootstrap Method. J Am Stat Assoc. 1997;92:548–560. [Google Scholar]
- Ferlay J, Shin HR, Bray F, Forman D, Mathers C, Parkin DM.2010GLOBOCAN 2008 v1.2, Cancer Incidence and Mortality Worldwide: IARC CancerBase No. 10 [Internet] International Agency for Research on Cancer: Lyon, France; Available from http://globocan.iarc.fr (accessed on 25 March 2012) [Google Scholar]
- Feuer EJ, Merril RM, Hankey BF. Cancer surveillance series: interpreting trends in prostate cancer—part II: cause of death misclassification and the recent rise and fall in prostate cancer mortality. J Natl Cancer Inst. 1999;91 (12:1025–1032. doi: 10.1093/jnci/91.12.1025. [DOI] [PubMed] [Google Scholar]
- Fraley C, Raftery AE. Model-based clustering, discriminant analysis, and density estimation. J Am Stat Assoc. 2002;97 (458:611–631. [Google Scholar]
- Geran L, Tully P, Wood P, Thomas B. Comparability of ICD-10 and ICD-9 for Mortality Statistics in Canada. Statistics Canada: Ottawa, Canada; 2005. [Google Scholar]
- Hsing AW, Devesa SS. Trends and patterns of prostate cancer: what do they suggest. Epidemiol Rev. 2001;23 (1:3–13. doi: 10.1093/oxfordjournals.epirev.a000792. [DOI] [PubMed] [Google Scholar]
- International Agency for Research on Cancer 2010. Cancer Incidence in Five Continents, Volumes I to IX [database on the Internet] Available from http://ci5.iarc.fr (accessed on 25 March 2011)
- Klebba AJ. Estimates of Selected Comparatibility Ratios based on Dual Coding of 1976 Death Certificates by the Eighth and Ninth Revisions of the International Classification of Diseases. Monthly Vital Statistics Report. National Center for Health Statistics: Hyattsville, Maryland, USA; 1980. [Google Scholar]
- Kvâle R, Auvinen A, Adami HO, Klint A, Hernes E, Moller B, Pukkala E, Storm HH, Tryggvadottir L, Tretli S, Wahlqvist R, Weiderpass E, Bray F. Interpreting trends in prostate cancer incidence and mortality in the five Nordic countries. J Natl Cancer Inst. 2007;99 (24:1881–1887. doi: 10.1093/jnci/djm249. [DOI] [PubMed] [Google Scholar]
- Merril RM, Feuer EJ, Warren JL, Schussler N, Stephenson RA. Role of transurethral resection of the prostate in population-based prostate cancer incidence rates. Am J Epidemiol. 1999;150 (8:848–860. doi: 10.1093/oxfordjournals.aje.a010090. [DOI] [PubMed] [Google Scholar]
- Mettlin C. Impact of screening on prostate cancer rates and trends. Microsc Res Tech. 2000;51 (4:415–418. doi: 10.1002/1097-0029(20001201)51:5<415::AID-JEMT2>3.0.CO;2-B. [DOI] [PubMed] [Google Scholar]
- Møller H. Trends in incidence of testicular cancer and prostate cancer in Denmark. Hum Reprod. 2001;16 (5:1007–1011. doi: 10.1093/humrep/16.5.1007. [DOI] [PubMed] [Google Scholar]
- Muthén B. Should substance use disorders be considered as categorical or dimensional. Addiction. 2006;101 (Suppl 1:6–16. doi: 10.1111/j.1360-0443.2006.01583.x. [DOI] [PubMed] [Google Scholar]
- Norderhaug IN, Sandberg S, Fosså SD, Forland F, Malde K, Kvinnsland S, Traaholt I, Rossiné BK, Førde OH. Health technology assessment and implications for clinical practice: the case of prostate cancer screening. Scand J Clin Lab Invest. 2003;63 (5:331–338. doi: 10.1080/00365510310002022. [DOI] [PubMed] [Google Scholar]
- Oliver SE, May MT, Gunnell D. International trends in prostate-cancer mortality in the "PSA ERA". Int J Cancer. 2001;92:893–898. doi: 10.1002/ijc.1260. [DOI] [PubMed] [Google Scholar]
- Peschel RE, Colberg JW. Surgery, brachytherapy, and external-beam radiotherapy for early prostate cancer. Lancet Oncol. 2003;4 (4:233–241. doi: 10.1016/s1470-2045(03)01035-0. [DOI] [PubMed] [Google Scholar]
- Schröder FH, Hugosson J, Roobol MJ, Tammela TL, Ciatto S, Nelen V, Kwiatkowski M, Lujan M, Lilja H, Zappa M, Denis LJ, Recker F, Páez A, Määttänen L, Bangma CH, Aus G, Carlsson S, Villers A, Rebillard X, van der Kwast T, Kujala PM, Blijenberg BG, Stenman UH, Huber A, Taari K, Hakama M, Moss SM, de Koning HJ, Auvinen A. Prostate-cancer mortality at 11 years of follow-up. N Engl J Med. 2012;366 (11:981–990. doi: 10.1056/NEJMoa1113135. [DOI] [PMC free article] [PubMed] [Google Scholar]
- Selley S, Donovan J, Faulkner A, Coast J, Gillatt D. Diagnosis, management and screening of early localised prostate cancer. Health Technol Assess. 1997;1 (2:1–96. [PubMed] [Google Scholar]
- Soerjomataram I, Lorlet-Tieulen J, Parkin DM, Ferlay J, Mathers C, Forman D, Bray F. Global burden of cancer in 2008: a systematic analysis of disability-adjusted life-years in 12 world regions. Lancet. 2012;S0140-6736 (12:60919–60912. doi: 10.1016/S0140-6736(12)60919-2. [DOI] [PubMed] [Google Scholar]
- The World Bank 2012. Analytical classifications for GNI. http://data.worldbank.org/about/country-classifications/a-short-history (accessed on 5 March 2013)
- The World Bank 2012. World Development Indicators http://data.worldbank.org/indicator/NY.GNP.ATLS.CD/countries (accessed on 5 May 2013)
- United Nations 2010. World Population Prospects: The 2010 Revision—Special Aggregates. Available from http://esa.un.org/unpd/wpp/index.htm (accessed on 30 May 2012)
- Warde P, Mason M, Ding K, Kirkbride P, Brundage M, Cowan R, Gospodarowicz M, Sanders K, Kostashuk E, Swanson G, Barber J, Hiltz A, Parmar MK, Sathya J, Anderson J, Hayter C, Hetherington J, Sydes MR, Parulekar W. Combined androgen deprivation therapy and radiation therapy for locally advanced prostate cancer: a randomised, phase 3 trial. Lancet. 2011;378 (9809:2104–2111. doi: 10.1016/S0140-6736(11)61095-7. [DOI] [PMC free article] [PubMed] [Google Scholar]
- Wiegel T, Bottke D, Steiner U, Siegmann A, Golz R, Störkel S, Willich N, Semjonow A, Souchon R, Stöckle M, Rübe C, Weissbach L, Althaus P, Rebmann U, Kälble T, Feldmann HJ, Wirth M, Hinke A, Hinkelbein W, Miller K. Phase III postoperative adjuvant radiotherapy after radical prostatectomy compared with radical prostatectomy alone in pT3 prostate cancer with postoperative undetectable prostate-specific antigen: ARO 96-02/AUO AP 09/95. J Clin Oncol. 2009;27 (18:2924–2930. doi: 10.1200/JCO.2008.18.9563. [DOI] [PubMed] [Google Scholar]
- Wilt TJ, Brawer MK, Jones KM, Barry MJ, Aronson WJ, Fox S, Gingrich JR, Wei J, Gilhooly P, Grob BM, Nsouli I, Iyer P, Cartagena R, Snider G, Roehrborn C, Sharifi R, Blank W, Pandya P, Andriole G, Culkin D, Wheeler T. Radical prostatectomy versus observation for localized prostate cancer. N Engl J Med. 2012;367 (3:203–213. doi: 10.1056/NEJMoa1113162. [DOI] [PMC free article] [PubMed] [Google Scholar]
- World Health Organization 2012. World Health Organization Statistical Information System. WHO Mortality Database; Available from http://www.who.int/whosis/mort/download/en/index.html (accessed on 30 May 2012)


