

Abstract
Neuronal currents produce local electromagnetic fields that can potentially modulate the phase of the magnetic resonance signal and thus provide a contrast mechanism tightly linked to neuronal activity. Previous work has demonstrated the feasibility of direct MRI of neuronal activity in phantoms and cell culture, but in vivo efforts have yielded inconclusive, conflicting results. The likelihood of detecting and validating such signals can be increased with (i) fast gradient-echo echo-planar imaging, with acquisition rates sufficient to resolve neuronal activity, (ii) subjects with epilepsy, who frequently experience stereotypical electromagnetic discharges between seizures, expressed as brief, localized, high-amplitude spikes (interictal discharges), and (iii) concurrent electroencephalography. This work demonstrates that both MR magnitude and phase show large-amplitude changes concurrent with electroencephalography spikes. We found a temporal derivative relationship between MR phase and scalp electroencephalography, suggesting that the MR phase changes may be tightly linked to local cerebral activity. We refer to this manner of MR acquisition, designed explicitly to track the electroencephalography, as encephalographic MRI (eMRI). Potential extension of this technique into a general purpose functional neuroimaging tool requires further study of the MR signal changes accompanying lower amplitude neuronal activity than those discussed here.
Keywords: epileptiform spike, electroencephalography, eMRI
Functional neuroimaging techniques localize cerebral activity related both to normal brain function and to pathologies such as epilepsies and brain tumors. Commonly used methods include blood oxygenation level-dependent (BOLD) functional MRI, positron emission tomography, and optical imaging. These methods do not directly image neuronal activity but rather measure associated metabolic processes such as changes in blood flow, hemoglobin oxygenation, and glucose concentration. Blood oxygenation level-dependent functional MRI is the most widely used among these methods. However, due to the hemodynamic nature of BOLD contrast, its response to neuronal activity is sluggish, with a 2–5 sec latency following stimulus onset (1). Conversely, electrophysiological recording techniques, such as electroencephalography (EEG) and magnetoencephalography, measure scalp electric and magnetic fields, respectively, generated by synchronously active cortical neuronal assemblies. These techniques have excellent temporal resolution, on the order of milliseconds. However, estimating local current distributions from these scalp measurements poses an underdetermined inverse problem, with results that are inherently spatially ambiguous (2).
The possibility of using MRI to directly detect neuronal electromagnetic activity with high spatiotemporal resolution has been explored by other investigators (3–11). Neuronal currents generate local electric and magnetic fields according to Maxwell’s equations and Ohm’s law. The component, ΔBz, of these local magnetic fields along the main static field of the MR scanner, (B0) alters the local water proton precession rate, thus modulating the phase, Φ, of the MR signal. This potentially provides a contrast mechanism tightly linked to local neuronal activity, and most prior efforts have been aimed at detection of resulting phase shifts or dephasing. For a gradient echo sequence, the phase shift, ΔΦ, in a given voxel is given by
| [1] |
where TE is the echo time and γ the gyromagnetic ratio. While phantom experiments have been encouraging (3,12), with reported detection of local magnetic fields on the order of 0.2 nT, analogous imaging attempts in humans have resulted in inconclusive and conflicting reports (6,7,13,14).
We hypothesized that reliable detection of an MR signal more tightly linked to human cerebral electromagnetic activity would be most likely under the following conditions:
High speed imaging: Neuronal currents have a typical duration of 1–400 msec. Most previous work has employed repetition times (TRs) in the order of several seconds (7,10,11). This sampling rate is likely inadequate for measuring the underlying signal fluctuations. Therefore, we employed single slice imaging with a short repetition time (TR) of 47 msec, resulting in an acquisition rate of approximately 21 images per second.
Epilepsy subjects: Most prior work has involved attempts to image spontaneous and evoked responses in healthy subjects, where the neuronal currents are of extremely small magnitude (6,13). Reliable separation of the small neuronal response from intrinsic image and physiological noise is difficult. In contrast, subjects with epilepsy frequently experience high amplitude stereotypical cortical electromagnetic discharges between seizures, or “interictal discharges”. These discharges result from synchronous paroxysmal membrane depolarization of large assemblies of hyperexcitable cortical neurons. On scalp EEG, these discharges are expressed as brief, localized, high-amplitude events (20–200 msec, >50 μV), called interictal spikes (15) (Fig. 1a). We expected the MR signal changes associated with interictal discharges to be more easily detectable than those accompanying spontaneous or evoked responses in healthy subjects.
Concurrent EEG: Recording simultaneous EEG during MR scanning (16) allows identification of the precise time of occurrence of interictal spikes and direct comparison of MRI and EEG time courses by correlations, thus distinguishing images corresponding to high-amplitude electrical activity from those acquired during baseline activity (i.e., no epileptiform events).
FIG. 1.
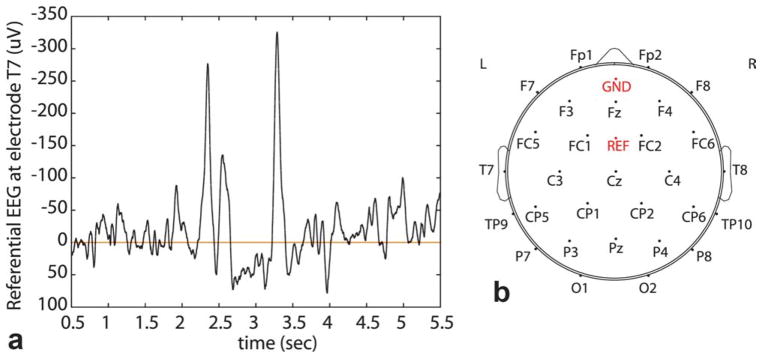
a: Interictal epileptiform spike as seen on referential EEG. Signal shown was measured at the left temporal electrode (T7). Spikes are seen at 2.3 and 3.3 sec, and are clearly distinguishable from background activity. b: Electrode placement on MR-compatible EEG cap, according to the International 10–20 system. As per neurology convention, odd-numbered electrodes are on the left, even on the right, and “z” electrodes along the midline. Letters designate the anatomic area: F, frontal; P, parietal; C, central; T, temporal; O, occipital; GND, ground; REF, reference. [Color figure can be viewed in the online issue, which is available at wileyonlinelibrary.com.]
We refer to this acquisition paradigm, explicitly designed to track and correlate MR signal changes with EEG, as encephalographic MRI (eMRI).
SUBJECTS AND METHODS
Subjects
All subjects signed informed consent approved by our institutional review board (Human Research Committee of Partners Healthcare System). We imaged 12 patients (five male, seven female; ages 20–57 years, Table 1) with medically refractory focal epilepsy, referred by the Epilepsy Service due to their frequent high-amplitude surface-EEG abnormalities, allowing us to capture events with short scan times. One epilepsy patient was imaged twice, with the two scans 1 year apart. In addition, we scanned one patient (male, age 52 years) who was consistently surface-EEG negative for epileptiform activity, but who experienced paroxysmal behavioral episodes suggestive of possible seizures (not included in Table 1). We also scanned six healthy subjects in the same age range.
Table 1.
Summary of EEG, Clinical Findings, and MRI Scan Times for 12 Epilepsy Subjects
| Subject | Age, gender | Anatomic MRI | Number of interictal EEG spikes during MRI | Localization of maximal interictal EEG discharges | Total MRI scan time (min) |
|---|---|---|---|---|---|
| E1a,b | 25, M | Normal | 6, 20 | Bilateral T; L > R (T7; SW at F7) | 39.7, 38.8 |
| E2 | 45, M | Normal | 3 | Bilateral T; L > R (T7) | 32 |
| E3 | 56, F | Normal | 2 | Right FT; (F8,T8) | 28 |
| E4 | 29, F | Normal | 2 | Left FTP (F7, T7, P7) | 29.3 |
| E5 | 29, F | Left frontal abscess | 4 | Left FT (F7, T7) | 24.1 |
| E6 | 20, M | Normal | 6 | Bilateral FT; L > R (F7, T7, P7) | 26.9 |
| E7 | 39, F | Normal | 15 | Bilateral FT; R > L(F8, T8, F7, T7) | 24.1 |
| E8a | 50, M | Normal | 1 | Right T; (T8) | 35.5 |
| E9a | 57, F | Normal | 8 | Left T; (T7) | 31.2 |
| E10a | 30, F | Normal | 5 | Left T; (T7) | 38.8 |
| E11 | 49, M | Left frontal abscess | 12 | Left F; (F7) | 20.1 |
| E12 | 54, F | Normal | 22 | Left FT; (F7, T7) | 37 |
F, frontal; T, temporal; P, parietal; C central; L left; R right; SW sharp wave.
MRI volume acquisitions (three-slice and five-slice).
Scanned twice; the two sessions were 1 year apart
MRI Acquisition
All imaging was performed using a 3-T scanner (Signa Excite, General Electric, Milwaukee, WI). Subjects were instructed to relax and lie still during the scan, with their head immobilized with sponge cushions. We acquired concurrent MRI and EEG, scanning the brain one axial slice at a time using gradient-echo echo-planar imaging. Scan parameters were: TR = 47 msec, TE = 22 msec, flip angle = 20°, image matrix = 64 × 64, field of view (FOV) = 28 cm, in-plane pixel size = 4.375 × 4.375 mm2, slice thickness = 5 mm, pixel bandwidth 7.8 KHz. An eight-channel phased array head coil was used.
Single-slice acquisition was repeated at different axial positions in order to cover multiple regions within the supratentorial brain. In cases where the epileptologists reported a single, well-defined focus of interictal spikes on EEG, we positioned the set of axial slices to cover the entirety of that particular cerebral lobe. In most cases, there were multiple, bilateral foci of interictal spikes on EEG. We therefore positioned the axial slices to sample both cerebral hemispheres, from skull base to vertex. Interslice spacing and the number of axial positions scanned depended on the ability of the subject to continue to lie still for imaging. With a TR of 47 msec, our sampling rate was approximately 21 images per second. Each acquisition block at a given slice position consisted of 512 consecutive images, and we obtained 10–15 such data blocks for each slice. The mean MRI scan time per subject was 31.6 min. For each subject, we also acquired T1-weighted anatomical images using a three-dimensional inversion recovery spoiled gradient recalled echo sequence with TR = 7.2 msec, TE = 2.9 msec, inversion time = 600 msec, flip angle = 10°, image matrix = 256 × 256, and field of view = 30 cm.
MRI Multichannel Image Reconstruction
At each time point, we recorded the complex data generated by each of the eight detectors in the phased array head coil. We reconstructed magnitude and phase difference images from these per-channel complex data, as follows: the per-channel data were first corrected for Nyquist ghosting, using an algorithm described by Buonocore et al. (17). We then reconstructed magnitude images by combining the magnitude of each of the per-channel complex data, using a standard root-sum-of-squares algorithm (18). The combined magnitude image, M, may be given as,
| [2] |
where Zi is the complex image for the ith channel and is the corresponding complex conjugate.
We then reconstructed multichannel phase difference images, using a quiet time instant (with no epileptiform activity) adjacent to each event as the reference. The phase differences were computed by combining the per-channel complex data, as described by Bernstein et al. (19). The combined phase difference image, ΔΦn, at time n, is,
| [3] |
Here, Zqk is the kth channel complex image at the quiet time q, is the complex conjugate of the kth channel complex image at time n, Mnk is the kth channel magnitude image at time n, and arg(A + iB) = arctangent (B/A).
EEG Recording During MRI
We recorded 32-channel EEG continuously (with a sample rate of 5000 Hz) during imaging using BrainAmp MR, a high-input impedance amplifier designed for recording EEG in an MR environment (BrainProducts, Munich, Germany). The EEG electrode cap (Easycap, GmbH, Herrsching, Germany) had 29 scalp electrodes, two chin electrodes for electromyograms and one electrode placed on the upper back for the electrocardiogram (Fig. 1b). The electrodes were sintered Ag/AgCl rings filled with a conductive gel for good scalp contact (impedance <10 kΩ). The EEG amplifier was placed on the table behind the subject’s head. Digitized EEG signals from the amplifier (16 bit, resolution 0.5 μV, ±16.38 mV dynamic range) were transmitted to a recording computer in the control room via a fiber optic cable. Electric potentials at all electrodes were measured with the electrode REF as the reference (Fig. 1b).
EEG recorded inside the MR scanner is contaminated with two artifacts: gradient artifacts due to the rapid gradient switching during imaging, and cardioballistic artifacts due to pulsatile movement of blood (Fig. 2a). Both were removed using the artifact template subtraction algorithm (20) implemented in the Vision Analyzer software (BrainProducts, Munich, Germany) (Fig. 2b). The denoised EEGs were stored at 250 Hz. For further EEG processing, we used Matlab 7.1 (MathWorks, Natick, MA) and EEGLAB 6.01 (21).
FIG. 2.

a: Raw EEG (all channels shown) recorded inside the MR scanner during imaging contains high amplitude gradient and cardioballistic artifacts. Gradient artifacts may be as large as 50 times the amplitude of the underlying EEG, rendering the EEG signal invisible. Both artifacts can be removed using software algorithms. b: EEG recorded inside the MR scanner with artifacts removed (eight channels shown). Same 5-sec segment as in Fig. 1a, shown on a bipolar montage. The two left temporo-parietal epileptiform spikes seen in Fig. 1 are intact, as seen at 2.3 and 3.3 sec. Principal negativity occurs at T7-P7, as evidenced by the cancellation of potentials in that derivation, the downward deflection at F7-T7, and the upward deflection at P7-O1. Also shown on the x-axis are the TTL markers sent from the scanner to the EEG amplifier (red markers, one for each TR).
Temporal Alignment of MRI and EEG
At each TR, a single transistor-transistor logic (TTL) pulse was sent from the MR scanner to the EEG amplifier (Fig. 2b). Temporal alignment of the MRI voxel time courses and the concurrently recorded EEG was performed using in-house software and was based solely on these TTL timing markers. EEG was recorded continuously and did not trigger the MR acquisition.
Multi-slice MRI acquisition
To assess the contiguity of MR response across cortical volumes and to preclude inflow as a possible cause of our observed signal changes, we acquired interleaved three-slice and five-slice MRI volume scans in four epilepsy patients, at the expense of increased effective TRs of 141 msec (three-slice) and 235 msec (five-slice). The remaining scan parameters were the same as the single slice scans. Slice thickness was 5 mm, with a gap of 0.5 mm between slices. EEG was again recorded continuously and did not trigger MR acquisition.
Imaging without EEG
To verify that our findings were not affected by the presence of the EEG equipment inside the scanner room, we repeated the MRI acquisition without recording EEG, for four epilepsy subjects. The EEG amplifier, power supply, cap, and cables were placed outside the scanner room during these acquisitions.
Concurrent EEG and Head Motion Tracking
To ascertain that the interictal spikes were not associated with tiny head movements, we acquired EEG and performed concurrent head motion tracking outside the MR scanner in three epilepsy patients. Head motion was tracked using an electromagnetic tracking device with a positional accuracy of 0.7 mm (Aurora; Northern Digital Inc., Waterloo, Ontario, Canada). The motion sensor was attached to the EEG cap using medical tape with the subject seated in a relaxed position. At each time point, the motion sensor recorded six parameters, three translational and three rotational. We used the Euclidian distance between successive locations of the sensor as a measure of motion. The motion tracking system transmitted a single TTL pulse to the EEG device corresponding to each head position measurement (with a sensor sampling rate of 20 Hz). Temporal alignment of the EEG and the motion data was solely based on these markers, and was performed using in-house software.
Detection of Interictal Spikes on EEG
Two epileptologists blinded to the MRI images reviewed each subject’s EEG and identified focal interictal epileptiform spikes according to a standard clinical classification (22). Epileptiform patterns seen on EEG may be morphologically divided into sharp waves, spikes, and spike-wave complexes. The epileptologists used the following selection criteria: a sharp wave is a transient, clearly distinguished from the background activity, with a pointed peak (amplitude >50 μV), a duration from 70 to 200 msec, and with an electronegative main component. A spike is similar to a sharp wave, but with a duration of 20 to 70 msec. We use the term interictal spikes to refer both to spikes and sharp waves, as they are neurophysiologically closely related phenomena; both are typical paroxysmal discharges commonly seen in epileptic seizure disorders (23).
Analysis of MR Images of Epilepsy Subjects
We examined the MR magnitude image and phase difference time courses corresponding to the interictal spikes identified by the epileptologists. We calculated percent MR magnitude signal changes by subtracting from these images an average reference magnitude image corresponding to an adjacent quiet time segment, with non-spiking EEG. MR phase difference images were generated as described earlier. We detected all voxels showing high-amplitude, fast MR signal changes (change greater than three times the standard deviation above the baseline, duration <500 msec). The time course of signal changes seen in these voxels were plotted on the same time axis as the concurrently recorded EEG. MR magnitude and phase data were analyzed separately.
The MR magnitude time course was well modeled by a filtered version of the EEG signal (with a filter of the form e−βt, with β = 5 sec−1). Accordingly, we computed the correlation between the MR magnitude signal and the filtered EEG, with a filter of the form,
| [4] |
As described below in the Results section, we found that the temporal derivative of the MR phase time course was empirically well modeled by the EEG signal. We therefore computed the correlation between the temporal derivative of the MR phase signal and the EEG. The particular EEG lead used in the correlations was selected by the epileptologists to best display the interictal spike. The results of the correlation analyses were correlation coefficients (r, [−1, +1]) and the statistical significance of the correlation (P-values) at each voxel. The P-values were Bonferroni-corrected for multiple comparisons by multiplying the uncorrected P-values by (N − 1), where N is the number of image voxels (N = 4096).
Analysis of MR Images of Controls
The data processing steps for the healthy control subjects were similar to the steps for the epilepsy subjects, with the main difference being that there were no EEG spike events to segment the voxel time courses. As in the case of the epilepsy subjects, the algorithm searched for all voxels containing high amplitude, fast signal changes relative to baseline.
RESULTS
MRI Response to Epileptiform Spikes
We found that both MR magnitude and phase showed large amplitude changes concurrent with every EEG epileptiform spike, albeit with different characteristics. These responses were observed without exception in all the identified EEG spike events in all the epilepsy subjects and were absent in all the healthy subjects. Figure 3a,b shows 3- and 12-sec segments of single-slice MRI scans (patient E11). Both segments contain bilateral spikes.
FIG. 3.

a, b Tight temporal correspondence between the interictal spike seen on EEG (black plot, top panel), percent change in MR magnitude (middle panel) and phase change in radians (bottom panel). The red curve shows the time course of the voxel showing the largest phase change. Temporal derivative of the largest MR phase time course (green curve, top panel) closely tracks EEG. M(h–g) and P(a–h) show percent change in MR magnitude and MR phase change in radians, at times (a–h), respectively. Results from correlation analyses between MR magnitude signal and the filtered EEG, and between the temporal derivative of the MR phase signal and the EEG, are also shown in the panels on the right. The significant voxels (as determined by the correlation coefficient, r, and the corrected P-values) are overlaid (in yellow) on the corresponding EPI slice. All spikes are from patient E12. In (c), we show MR magnitude and phase change time courses for a 3-sec “quiet” segment (i.e., no epileptiform events) from the same epilepsy subject (E12).
The MR magnitude signal changes concurrent with the EEG spikes had large amplitude, ranging from 33 to 100% above the mean. We observed that the descending segment of the magnitude response was slower than the ascending segment and dropped slightly below the baseline on the return. This mimics the morphology of the interictal EEG spike, which undershoots the baseline during hyperpolarization after sustained depolarization (seen as a negative EEG peak).
The MR phase responses concurrent with the EEG spikes showed both positive and negative changes in different regions on the same image. We found that the EEG signal was empirically well-modeled by the temporal derivative of the MR phase time course. In Fig. 3a,b, we plot the MR voxel phase time course showing the largest change (bottom of upper panel, red curve), as well as its temporal derivative (top of upper panel, green curve), overlaid on the simultaneously recorded EEG signal (top of upper panel, black curve). The EEG and the temporal derivative of the MR phase are in striking agreement (maximum r = 0.7536, P < 10−20). As phase change is related to local magnetic field change through Eq. 1, our maximal phase change of 1.074 radians would correspond to a local magnetic field change of 182.47 nT. By way of comparison, in Fig. 3c, we plot MR magnitude, phase change, and EEG for the same epilepsy subject as in Fig. 3a,b, during a quiescent 3-sec segment, with no spike events. No large, fast MR signal changes are present during this segment.
MRI in Subjects without EEG Epileptiform Spikes
None of the normal volunteers had interictal spikes on EEG, and none had MR magnitude or phase signal changes analogous to those seen in the epilepsy patients. Similarly, the patient with paroxysmal behavioral changes who had consistent EEG studies with no interictal spikes showed no large amplitude MR magnitude or phase signal changes suggestive of interictal spikes.
Multi-slice MRI acquisition
The three-slice and five-slice interleaved MRI scans showed similar high-amplitude magnitude and phase changes, temporally coupled to the EEG interictal spikes. Sampling was slower than in the single-slice case, with an effective TR of 141 msec. There was spatial contiguity in the magnitude and phase responses between adjacent slices (Fig. 4e).
FIG. 4.

a–d: Consistent focal MR magnitude signal increase concurrent with EEG spikes in a patient with localized left temporal lobe epilepsy (patient E10). Figures a–d show 3-sec segments corresponding to four distinct spikes observed in repeated scans of the same volume. We show the EEG spike (top), percent changes in MR magnitude [M(a–d), corresponding to times (a–d)], and the corresponding EPI magnitude image and the T1 anatomical image. The MR response patterns are consistent with the localization of the patient’s seizure focus in the temporal lobe. The largest MR magnitude signal increase (71.5%) corresponds to the largest amplitude spike (Fig. 4a). e: shows interleaved multislice magnitude data for the spike in Fig. 4(c), with Mai representing the magnitude change at slice level i at time a. While these data were acquired at the cost of slower temporal resolution (TR = 141 msec), spatial contiguity in the magnitude responses across multiple slices can be seen. [Color figure can be viewed in the online issue, which is available at wileyonlinelibrary.com.]
In Fig. 4, we demonstrate a consistent focal magnitude signal increase concurrent with the EEG spike in the left temporal lobe, in repeated scans of the same volume (Fig. 4a–d) show the bottom-most axial slice in Fig. 4e scanned during four distinct spikes). This pattern of MR signal increase was consistent with the focal nature of the patient’s epilepsy, originating in the left temporal lobe. We observed that the largest MR magnitude signal increase corresponded to the highest amplitude EEG spike (Fig. 4a).
We note that for the multislice volume scans, the temporal derivative of the MR phase did not closely track the EEG time course, as it did for the single-slice acquisition. This may be due to undersampling related to the longer TR.
Imaging Without EEG
We observed similar MR magnitude and phase signal changes in the epilepsy subjects during MRI scans acquired without the EEG apparatus. While the underlying EEG was not concurrently recorded, the temporal derivative of the MR phase time course had epileptiform morphology, as seen in the top green curve of Fig. 5.
FIG. 5.

eMRI acquisition (single-slice) without EEG equipment (patient E6). Magnitude and phase changes are similar to the acquisitions with EEG present. The derivative (green) of the maximal voxel phase response (red) is shown on the top plot and shows morphology similar to EEG epileptiform spikes. [Color figure can be viewed in the online issue, which is available at wileyonlinelibrary.com.]
Concurrent EEG and Head Motion Tracking
Twitches or other movements concurrent with focal interictal spikes have never been reported, and all our subjects were in an interictal state during the entire study, i.e., they did not experience seizure activity. Nevertheless, in order to verify that our observed signal changes were not related to movements coupled to interictal spikes, we analyzed concurrent EEG and head motion tracking acquired outside the scanner in patients E9, E10, and E11. We found no measurable head motion accompanying the interictal spikes, to an accuracy of 0.7 mm root-mean-square (RMS). Temporal correlation of the motion tracker output with the EEG (electrode T7) yielded a correlation coefficient of 0.0043 (computed over 450,000 points), consistent with the uncorrelated appearance of the EEG (black) and head motion (red) time courses in Fig. 6a,b.
FIG. 6.

Concurrent EEG and head motion tracking outside the MR scanner (patients E9, E11). In (a), an interictal spike (*) is seen in the 3-sec EEG segment (referential montage). Head motion (red) was found to be uncorrelated with the EEG spike activity (correlation coefficient = 0.0043). In (b), multiple interictal spikes (*) are seen in the 11-sec EEG segment shown. Head motion (in red) was again measured (with positional root-means-squared (RMS) = 0.7 mm), and found to be uncorrelated with EEG spike activity (correlation coefficient = 0.0068). [Color figure can be viewed in the online issue, which is available at wileyonlinelibrary.com.]
DISCUSSION
The eMRI Magnitude Signal
We found the large MR magnitude changes accompanying interictal spikes to be surprising, as we expected a magnitude signal loss due to local spin dephasing (7). The MR changes we observed were concurrent with the EEG events, with a lag of only milliseconds. Localized changes in blood flow and hemoglobin oxygenation are therefore unlikely to cause our observed signal changes. Bulk head motion accompanying interictal spikes could cause signal increases from unsaturated spins entering the imaging plane, but our findings from the head motion tracking study render this explanation unlikely.
Inflow of unsaturated blood or cerebrospinal fluid into the imaging plane could cause sudden magnitude signal increases but does not explain the rapid return to baseline. Inflow and bulk motion effects are also inconsistent with the results of the MRI multislice volume scans, where such effects on the central slices should be minimal.
Registration of the time course image data is important in analyzing multi-slice data. However, other than the above-described limited multislice acquisitions, designed solely to exclude inflow as a significant source of the detected signal, our paradigm involved independent acquisition of single-slice data sets, and thus realignment was not undertaken. For multislice acquisitions in future eMRI studies, realignment will be part of the analysis algorithm.
Focal micromotions of brain tissue or cerebrospinal fluid during interictal spikes are another conceivable source of the signal changes we observed. While such a phenomenon has never been described, it cannot be excluded by us here. The Lorentz effect (9,24) might result in focal displacement forces on the firing neurons along the B0 magnetic field, but this would be expected to cause phase dispersion and magnitude signal loss, rather than the magnitude signal increases we observed. However, a recent study of Lorentz effect imaging of ionic currents in solution (25) demonstrated both signal loss and signal increases, the latter potentially related to bulk motion of water molecules induced by ionic flow. On the other hand, another recent study (26), using realistic parameters to calculate the displacement of the human median nerve at 4 T resulting from Lorentz effects, found the displacement to be on the order of 0.013 μm or less, which is probably too small to account for the large magnitude increases we observe.
Another potential contrast mechanism underlying our observations might be described as an apparent, rather than a real movement, mediated by the local magnetic fields associated with macroscopic current. Consider the case of a transient, local field arising during the application of the slice select gradient. This may lead to an apparent shift in location of the region harboring the local field, bringing unsaturated spins into the field of view, with an attendant intensity increase.
An interesting potential mechanism underlying our observed magnitude signal increases is a transient release of bound water to free water during strong neuronal electrical discharges. It is known that intense neuronal activity alters the extracellular micro-environment (27,28). For example, during repetitive interictal activity, extracellular K+ concentration may increase from its baseline value of 3 mM to 10–12 mM (29). During depolarization, cations release their bound hydration shell water for transport through ion channels in the neuronal cell membrane (30), and these hydration shells may be rapidly regained during hyperpolarization. While bound water is largely MR invisible, a transient release of the bound water pool into the free water pool could result in a greater proton density contributing to the MR signal and thus may be related to the signal changes we observed. Recent MR measurements of neuronal depolarization in the rat brain showed large associated changes in tissue relaxation times (T1 increase of 13%; T2 increase of 88%) and in the magnetization transfer ratio (decrease of 9%) (31), consistent with this proposed mechanism. Finally, rapid neuronal cell swelling related to neuronal activity may also result in free water shifts that may be discernible on MR (28,32). The degree to which neuronal cell volume changes may affect our signal is unknown.
Relatively diffuse regions of MR signal change were seen on the spike images in most of the epilepsy patients we scanned (Fig. 3a,b). Although the localization of maximal EEG discharge is listed for each subject in Table 1, we chose patients with the highest frequency of interictal spikes, and many had more than one focus of spiking on EEG. Additionally, the spread of epileptiform activity across the cortex may be so rapid that the MR sampling rate used here may be too low to identify the earliest focus of spiking. The single patient in our cohort (E10) with spikes localized to one region, the left temporal lobe, had a correspondingly localized eMRI response (Fig. 4).
The eMRI Phase Signal
The temporal derivative relationship between MR phase and EEG suggests that MR phase change may be tightly linked to local field changes associated with neuronal activity. Our maximal observed phase change of 1.074 radians corresponds to a local magnetic field change of 182.47 nT (TE = 22 msec). This is one to two orders of magnitude larger than similar results (0.2–1.7 nT) reported in prior work on non-epilepsy subjects (33) and mirrors the higher amplitude of the EEG spikes observed in our patients.
The conventional model for contrast in MR phase images results from differences in local precession frequencies, which in turn are affected by local perturbations in the B0 magnetic field. Thus, the phase images map the B0 component of the local magnetic field, and might be thought of as a “voxel-level magnetoencephalography.” However, only the component of the local magnetic field fluctuation that is parallel to B0 is encoded in the MR phase changes (34). To image all components, the subject would have to be imaged in three separate orientations, with the x, y, and z axes in turn aligned with B0. The local current density vector J could then be calculated using Ampere’s Law.
Just as in the case of magnetoencephalography, the sources of the local magnetic fields detected by MRI may be postsynaptic currents in the apical dendrites of synchronously activated pyramidal neurons, which lie parallel to each other and thus define the direction of the primary intracellular currents. Volume currents, in contrast, are generated in the extracellular fluid to complete the current loop and are the largest contributor to the scalp EEG (35).
Prior Work
To date, direct imaging of human neuronal activity using MRI remains controversial. While phantom studies are encouraging, in vivo studies have been either negative or else lacking conclusive, reproducible results (3–11). While several approaches have been proposed, most investigators have used long TRs, on the order of several seconds (6,11). This sampling rate is likely too slow to track rapidly varying neuronal electromagnetic fields. Additionally, most in vivo imaging has been attempted on spontaneous and evoked responses in healthy subjects, and the associated neuronal current effects may be too small to be reliably separated from physiological and image noise.
Prior work on functional MR imaging of interictal spikes attempted to detect associated BOLD changes using long TRs (10,36–39). In Ref. 10, the investigators attempted to detect an MR signal linked to neuronal depolarization during spike-and-wave complexes in generalized epilepsy, but their data were sampled with a TR of 3 sec. The approach used here, with rapid sampling of high amplitude neuronal activity, may contribute toward the development of a reliable technique for more direct imaging of neuronal activity using MRI. Further work is required to determine whether eMRI can be extended to normal physiological conditions.
CONCLUSIONS
We have described fast magnetic resonance signal changes concurrent with cerebral epileptiform discharges. These changes were seen in both the magnitude and phase images. The phase changes appear tightly linked to magnetic field changes induced by local neuronal activity. The magnitude changes may result from related fast physiologic processes, such as water shifts between “bound” and “free” pools. However, the precise mechanism of the observed changes, in both magnitude and phase, remains unclear. Possible extension of eMRI for use as a generalized functional neuroimaging modality will require a more thorough analysis of magnitude and phase responses accompanying lower amplitude EEG changes than are described here.
Acknowledgments
Grant sponsor: Brigham and Women’s Hospital Radiology Department; Grant sponsor: National Institutes of Health; Grant numbers: NIH P41 RR13218, NIH U41-RR019703; Grant sponsors: Brigham Radiology Research, Education Fund, Jazz Pharmaceuticals, ISMRM/ASNR seed grant.
This work was supported by research funds provided to D.B.O. by the Brigham and Women’s Hospital Radiology Department. W.M.W. was partially supported by the National Institutes of Health. R.V.M. was partially supported by the National Institutes of Health. P.S. was partially supported by a Brigham Radiology Research and Education Fund grant. M.M. was supported by a fellowship from Jazz Pharmaceuticals (Palo Alto, CA, USA). The authors gratefully acknowledge receipt of an ISMRM/ASNR seed grant to P.S. and D.B.O. based on the work described here. The authors thank B. Dworetzky, J. Lee, and D. Sarco for their referral of appropriate patients for this study, Sharon Peled for sharing code for unwrapping of MR phase images, Nathan MacDannold for help with reconstruction of MR phase images from multichannel data, Nan-Kuei Chen for help Nyquist ghost correction of EPI data, Bruno Madore and Scott Hoge for help with ramp sampling correction, and Nobuhiko Hata and Haiying Liu for assistance with the use of the Aurora motion tracker. The authors thank Frank Jolesz and Larry Panych for helpful comments on the manuscript.
Footnotes
The authors dedicate this article to the memory of their dear colleague, Ed Bromfield.
References
- 1.Logothetis NK, Wandell BA. Interpreting the BOLD signal. Annu Rev Physiol. 2004;66:735–769. doi: 10.1146/annurev.physiol.66.082602.092845. [DOI] [PubMed] [Google Scholar]
- 2.Lopes da Silva F. Functional localization of brain sources using EEG and/or MEG data: volume conductor and source models. Magn Reson Imaging. 2004;22:1533–1538. doi: 10.1016/j.mri.2004.10.010. [DOI] [PubMed] [Google Scholar]
- 3.Bodurka J, Bandettini PA. Toward direct mapping of neuronal activity: MRI detection of ultraweak, transient magnetic field changes. Magn Reson Med. 2002;47:1052–1058. doi: 10.1002/mrm.10159. [DOI] [PubMed] [Google Scholar]
- 4.Petridou N, Plenz D, Silva AC, Loew M, Bodurka J, Bandettini PA. Direct magnetic resonance detection of neuronal electrical activity. Proc Natl Acad Sci USA. 2006;103:16015–16020. doi: 10.1073/pnas.0603219103. [DOI] [PMC free article] [PubMed] [Google Scholar]
- 5.Konn D, Gowland P, Bowtell R. MRI detection of weak magnetic fields due to an extended current dipole in a conducting sphere: a model for direct detection of neuronal currents in the brain. Magn Reson Med. 2003;50:40–49. doi: 10.1002/mrm.10494. [DOI] [PubMed] [Google Scholar]
- 6.Parkes LM, de Lange FP, Fries P, Toni I, Norris DG. Inability to directly detect magnetic field changes associated with neuronal activity. Magn Reson Med. 2007;57:411–416. doi: 10.1002/mrm.21129. [DOI] [PubMed] [Google Scholar]
- 7.Xiong J, Fox PT, Gao JH. Directly mapping magnetic field effects of neuronal activity by magnetic resonance imaging. Hum Brain Mapp. 2003;20:41–49. doi: 10.1002/hbm.10124. [DOI] [PMC free article] [PubMed] [Google Scholar]
- 8.Witzel T, Lin FH, Rosen BR, Wald LL. Stimulus-induced Rotary Saturation (SIRS): a potential method for the detection of neuronal currents with MRI. Neuroimage. 2008;42:1357–1365. doi: 10.1016/j.neuroimage.2008.05.010. [DOI] [PMC free article] [PubMed] [Google Scholar]
- 9.Song AW, Takahashi AM. Lorentz effect imaging. Magn Reson Imaging. 2001;19:763–767. doi: 10.1016/s0730-725x(01)00406-4. [DOI] [PubMed] [Google Scholar]
- 10.Liston AD, Salek-Haddadi A, Kiebel SJ, Hamandi K, Turner R, Lemieux L. The MR detection of neuronal depolarization during 3-Hz spike-and-wave complexes in generalized epilepsy. Magn Reson Imaging. 2004;22:1441–1444. doi: 10.1016/j.mri.2004.10.017. [DOI] [PubMed] [Google Scholar]
- 11.Luo Q, Lu H, Senseman D, Worsley K, Yang Y, Gao JH. Physiologically evoked neuronal current MRI in a bloodless turtle brain: detectable or not? Neuroimage. 2009;47:1268–1276. doi: 10.1016/j.neuroimage.2009.06.017. [DOI] [PMC free article] [PubMed] [Google Scholar]
- 12.Joy M, Scott G, Henkelman M. In vivo detection of applied electric currents by magnetic resonance imaging. Magn Reson Imaging. 1989;7:89–94. doi: 10.1016/0730-725x(89)90328-7. [DOI] [PubMed] [Google Scholar]
- 13.Chu R, de Zwart JA, van Gelderen P, Fukunaga M, Kellman P, Holroyd T, Duyn JH. Hunting for neuronal currents: absence of rapid MRI signal changes during visual-evoked response. Neuroimage. 2004;23:1059–1067. doi: 10.1016/j.neuroimage.2004.07.003. [DOI] [PubMed] [Google Scholar]
- 14.Chow LS, Cook GG, Whitby E, Paley MN. Investigation of MR signal modulation due to magnetic fields from neuronal currents in the adult human optic nerve and visual cortex. Magn Reson Imaging. 2006;24:681–691. doi: 10.1016/j.mri.2006.01.005. [DOI] [PubMed] [Google Scholar]
- 15.de Curtis M, Avanzini G. Interictal spikes in focal epileptogenesis. Prog Neurobiol. 2001;63:541–567. doi: 10.1016/s0301-0082(00)00026-5. [DOI] [PubMed] [Google Scholar]
- 16.Ritter P, Villringer A. Simultaneous EEG-fMRI. Neurosci Biobehav Rev. 2006;30:823–838. doi: 10.1016/j.neubiorev.2006.06.008. [DOI] [PubMed] [Google Scholar]
- 17.Buonocore MH, Gao L. Ghost artifact reduction for echo planar imaging using image phase correction. Magn Reson Med. 1997;38:89–100. doi: 10.1002/mrm.1910380114. [DOI] [PubMed] [Google Scholar]
- 18.Roemer PB, Edelstein WA, Hayes CE, Souza SP, Mueller OM. The NMR phased array. Magn Reson Med. 1990;16:192–225. doi: 10.1002/mrm.1910160203. [DOI] [PubMed] [Google Scholar]
- 19.Bernstein MA, Grgic M, Brosnan TJ, Pelc NJ. Reconstructions of phase contrast, phased array multicoil data. Magn Reson Med. 1994;32:330–334. doi: 10.1002/mrm.1910320308. [DOI] [PubMed] [Google Scholar]
- 20.Allen PJ, Josephs O, Turner R. A method for removing imaging artifact from continuous EEG recorded during functional MRI. Neuroimage. 2000;12:230–239. doi: 10.1006/nimg.2000.0599. [DOI] [PubMed] [Google Scholar]
- 21.Delorme A, Makeig S. EEGLAB: an open source toolbox for analysis of single-trial EEG dynamics including independent component analysis. J Neurosci Methods. 2004;134:9–21. doi: 10.1016/j.jneumeth.2003.10.009. [DOI] [PubMed] [Google Scholar]
- 22.Fisch BJ. Fisch and Spehlmann’s EEG primer. Amsterdam: Elsevier; 1999. pp. 199–217. [Google Scholar]
- 23.Niedermeyer E, Lopes da Silva FH. Electroencephalography, basic principles, clinical applications, and related fields. Baltimore: Urban & Schwarzenberg; 1982. p. 752. [Google Scholar]
- 24.Song AW, Truong TK, Woldorff M. Dynamic MRI of small electrical activity. Methods Mol Biol. 2009;489:297–315. doi: 10.1007/978-1-59745-543-5_14. [DOI] [PubMed] [Google Scholar]
- 25.Truong TK, Avram A, Song AW. Lorentz effect imaging of ionic currents in solution. J Magn Reson. 2008;191:93–99. doi: 10.1016/j.jmr.2007.12.005. [DOI] [PubMed] [Google Scholar]
- 26.Roth BJ, Basser PJ. Mechanical model of neural tissue displacement during Lorentz effect imaging. Magn Reson Med. 2009;61:59–64. doi: 10.1002/mrm.21772. [DOI] [PMC free article] [PubMed] [Google Scholar]
- 27.Lux HD, Heinemann U, Dietzel I. Ionic changes and alterations in the size of the extracellular space during epileptic activity. Adv Neurol. 1986;44:619–639. [PubMed] [Google Scholar]
- 28.Dietzel I, Heinemann U. Dynamic variations of the brain cell micro-environment in relation to neuronal hyperactivity. Ann NY Acad Sci. 1986;481:72–86. doi: 10.1111/j.1749-6632.1986.tb27140.x. [DOI] [PubMed] [Google Scholar]
- 29.Moody WJ, Futamachi KJ, Prince DA. Extracellular potassium activity during epileptogenesis. Exp Neurol. 1974;42:248–263. doi: 10.1016/0014-4886(74)90023-5. [DOI] [PubMed] [Google Scholar]
- 30.Zhou Y, Morais-Cabral JH, Kaufman A, MacKinnon R. Chemistry of ion coordination and hydration revealed by a K+ channel-Fab complex at 2. 0 A resolution. Nature. 2001;414:43–48. doi: 10.1038/35102009. [DOI] [PubMed] [Google Scholar]
- 31.Stanisz GJ, Yoon RS, Joy ML, Henkelman RM. Why does MTR change with neuronal depolarization? Magn Reson Med. 2002;47:472–475. doi: 10.1002/mrm.10071. [DOI] [PubMed] [Google Scholar]
- 32.Le Bihan D. The ‘wet mind’: water and functional neuroimaging. Phys Med Biol. 2007;52:R57–R90. doi: 10.1088/0031-9155/52/7/R02. [DOI] [PubMed] [Google Scholar]
- 33.Bodurka J, Jesmanowicz A, Hyde JS, Xu H, Estkowski L, Li SJ. Current-induced magnetic resonance phase imaging. J Magn Reson. 1999;137:265–271. doi: 10.1006/jmre.1998.1680. [DOI] [PubMed] [Google Scholar]
- 34.Scott GC, Joy ML, Armstrong RL, Henkelman RM. Sensitivity of magnetic-resonance current-density imaging. J Magn Reson. 1992;97:235–254. doi: 10.1002/mrm.1910280203. [DOI] [PubMed] [Google Scholar]
- 35.Nunez PL, Srinivasan R. Electric fields of the brain: the neurophysics of EEG. Oxford: Oxford University Press; 2006. p. xvi.p. 611. [Google Scholar]
- 36.Salek-Haddadi A, Diehl B, Hamandi K, Merschhemke M, Liston A, Friston K, Duncan JS, Fish DR, Lemieux L. Hemodynamic correlates of epileptiform discharges: an EEG-fMRI study of 63 patients with focal epilepsy. Brain Res. 2006;1088:148–166. doi: 10.1016/j.brainres.2006.02.098. [DOI] [PubMed] [Google Scholar]
- 37.Benar CG, Gross DW, Wang Y, Petre V, Pike B, Dubeau F, Gotman J. The BOLD response to interictal epileptiform discharges. Neuroimage. 2002;17:1182–1192. doi: 10.1006/nimg.2002.1164. [DOI] [PubMed] [Google Scholar]
- 38.Jager L, Werhahn KJ, Hoffmann A, Berthold S, Scholz V, Weber J, Noachtar S, Reiser M. Focal epileptiform activity in the brain: detection with spike-related functional MR imaging--preliminary results. Radiology. 2002;223:860–869. doi: 10.1148/radiol.2233010360. [DOI] [PubMed] [Google Scholar]
- 39.Moeller F, Tyvaert L, Nguyen DK, LeVan P, Bouthillier A, Kobayashi E, Tampieri D, Dubeau F, Gotman J. EEG-fMRI: Adding to standard evaluations of patients with nonlesional frontal lobe epilepsy. Neurology. 2009;73:2023–2030. doi: 10.1212/WNL.0b013e3181c55d17. [DOI] [PMC free article] [PubMed] [Google Scholar]