Abstract
The objective of this paper is to analyze the behaviour of a backscattered signal according to soil moisture depth over bare soils. Analysis based on experimental vertical moisture profiles and ASAR/ENVISAT measurements has been carried out. A modified IEM model with three permittivity layers (0-1cm, 1-2cm, 2-5cm) has been developed and used in this study. Results show a small effect of moisture profile on the backscattered signal (less than 0.5dB). However, measurements and simulations have provided a more detailed insight into the behaviour of the radar signal and have shown that it was important to consistently use the same protocol when performing ground truth measurements of soil moisture.
Keywords: Soil moisture, ASAR-ENVISAT, IEM, permittivity profile
1. Introduction
Over the past decades, different surface backscattering models have been developed for a better understanding of the relationship between soil surface parameters (surface roughness and soil moisture) and radar signals. The great majority of models rely on simulations using as their input a constant value of soil moisture, assuming uniform moisture down to the penetration depth of the radio wave. This hypothesis is not realistic, particularly at low frequencies for which the penetration depth is only a few centimeters. In this regard, on clay loam soil, Bruckler et al. [1], found that the radar penetration depth in the C-band decreases from about 5 cm for a soil moisture content of 10%, to 1 cm for a soil moisture content of 30%. When the radar wavelength increases (L-band), the penetration depth increases but never exceeds a few centimeters in the upper soil layer. The use of surface backscattering models has often revealed various limitations in the backscattering simulations [2]. On the other hand, a linear relationship between radar signal and soil moisture is generally observed, but with different slopes from one study to another [3-6]. Various studies have attempted to analyze the effect of a non-uniform soil moisture profile in active and passive microwave modelling [7-11]. In general, they achieve only a slight improvement in the retrieval of the backscattering level. Fung et al., [8], has shown the contribution of multi-layer permittivity to improve backscattering simulations and to reduce discrepancy between radar measurements and radar signal over two different test fields. Walker et al. [9], have proposed also a variable dielectric profile showing an improvement in the simulation of data collected in the European Microwave Signature Laboratory (EMSL) experiments. Lu et al. [11], have solved Ricatti equation to introduce moisture profile in BSM (Bi-Spectrum model) backscattering model, showing the higher contribution of soil surface moisture in simulations, comparing to deep soil moisture. All these studies focus particularly in the analysis of moisture profile contribution in backscattering simulation, in field scale, without a study of the inhomogeneous moisture profile effect in correlation between radar signal and moisture measurements, particularly in larger spatial scale.
The aim of this paper is to discuss this scientific question and also to highlight the particular importance of the soil moisture profile measurement protocol in reducing the substantial differences in results given by various experimental studies, designed to analyse the correlation between moisture and radar signals. In this study, we propose to analyse the moisture profile effect, using ASAR SAR images, experimental soil moisture, and a modified version of the Integral Equation Model (IEM) with three layer permittivities.
The paper is organised as follows. In section 2, the methodology proposed to simulate radar signals with a three-layer soil moisture profile is presented. Section 3 deals with experimental measurements of soil moisture and satellite data acquired over two sites in France (Villamblain and Avignon). Section 4 provides details of results obtained using experimental data and modelling simulations. Finally, Section 5 gives our conclusions.
2. Modelling backscattering with a multi-layer permittivity profile
Assuming a permittivity profile ε(z) specifically representing a continuous variation of soil moisture as a function of depth z, the magnitude and phase of the reflection coefficient at any given depth inside the soil are computed according to the Reflection-Coefficient Equation known as the Ricatti Equation, written as Ulaby et al. [12]:
| (1) |
where β = k0ncosθ, and A is the amplitude of the incident electric field.
n = [ε(z)] 1/2 is the refractive index, θ is the incidence angle and k0 is the wave number.
Resolving this equation in the case of the natural soil medium is far from straightforward. Therefore, in this study, the problem is simplified by considering a soil medium having only three discontinuous permittivity layers and using the IEM model for backscattering simulations [8], [12].
First, the principles of the IEM model will broadly be recalled. The backscattering coefficient is expressed as follows:
| (1) |
Where kz= k cosθi, kx= k sin θi, θi is the incidence angle, k is the wave number, and s is the rms surface height. is a function of the incidence angle, the soil's dielectric constant, and the Fresnel reflection coefficient. W(n) (−2kx,0) is the Fourier transform of the nth power of the surface correlation function.
This version of the IEM model introduces the transitional function proposed by [13], in which the Fresnel coefficient is not estimated at the incidence angle θi, but at an angle ranging between θi and normal incidence, depending on the surface roughness parameters.
The IEM input parameters are the dielectric constant, deduced from surface volumetric moisture content and soil texture [14], and the correlation function of surface heights or its corresponding spectrum.
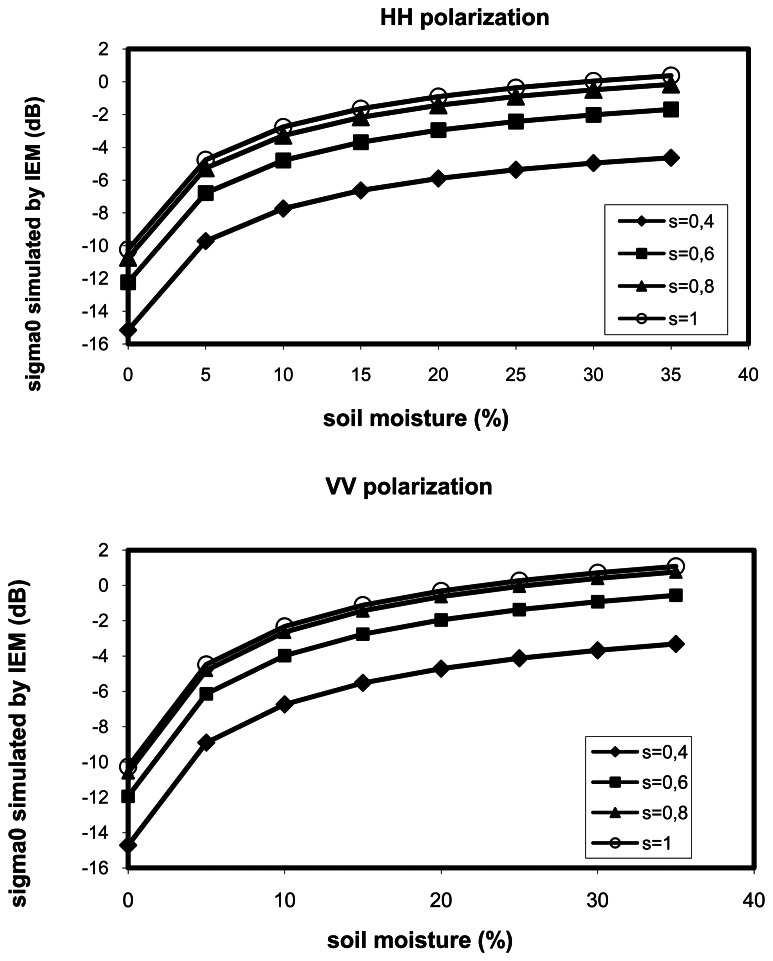
Figure 1 illustrates the sensitivity of backscattering coefficient IEM simulations as a function of soil moisture, for different roughness values (s=0.4 cm, s=0.6 cm, s=0.8 cm, s=1cm) in horizontal and vertical polarisations. First, we observe approximately an identical effect of soil moisture increasing on IEM simulations for different roughness. Second, the backscattering coefficients illustrate the saturation of radar signal for high soil moisture. This saturation is generally less important for real data which shows a linear increasing even for high soil moisture around 30% [4].
Figure 1.
Sensitivity analysis of IEM model function of soil roughness and moisture (a) HH polarisation, (b) VV polarisation
We propose to estimate an effective permittivity computed from the Fresnel coefficients at the interface between the different layers [8]. This effective permittivity will be used as an input to the IEM model.
The coefficients R2, R1 and R0 are the Fresnel coefficients at the boundaries of the three layers (with respective depths d3, d2 and d1). They are written as:
The Fresnel reflection coefficients, R0, between the air (region 0) and layer 1 (with permittivity ε1) are defined as:
| (2) |
| (3) |
The subscripts h and v denote horizontal or vertical polarisation (p), respectively.
The Fresnel coefficient R1 between layer 1 and layer 2 (with permittivity ε2) is:
| (4) |
and
| (5) |
with the angle of transmission θ1 defined by Snell Law as:
| (6) |
and finally the Fresnel coefficient at the boundary of layers 2 and 3 (with permittivity ε3) is:
| (7) |
| (8) |
with the angle of transmission θ2 defined by Snell Law as:
| (9) |
The reflection coefficient for reflectivity of a layer of depth d2 over a half space is written as:
| (10) |
where ψ1 is an attenuation factor that depends on the thickness d2 of the second layer, the electromagnetic wavelength, λ0, and effective permittivity ε2.
| (11) |
The expression (8) can be extended for the first layer of depth d1 above it as:
| (12) |
| (13) |
In practice, there are no physical boundaries between layers, and the soil medium is characterized by a continuous dielectric profile. In order to avoid an oscillatory behaviour caused by the assumption of discrete layers, an incoherent treatment of the reflections in equations (8) and (10) was chosen in our computations [8], [12]. The terms containing the phases were neglected. As a result, the final reflection coefficient, for example, can be written as:
| (14) |
The corresponding effective permittivity could be computed from this Fresnel coefficient:
| (15) |
3. Experimental measurements
This study relies on two databases:
-
-
The first one of these was obtained at the Avignon site in the south of France, in 1995. It comprises ground measurements only, without satellite acquisitions.
-
-
A second database was obtained at the Villamblain site in 2006, with a large number of experimental campaigns detailed in the next section.
3.1. Description of Avignon Site
The monitored site is a flat agriculture area whose dimensions are approximately 4km x 5km, located in Rhone Valley near Avignon (France). It consists mainly of agricultural landscape. It includes agricultural areas, forest stands. The agricultural areas are composed mainly of bare soils and wheat fields. But include orchards of various fruit trees, among them peach, pear and apricot. Most of the soil textures are 40% of clay and 6% of sand particles. The ground measurements were done in 28 test fields. They were carried out on bare soils. Ten roughness profiles were established for each training field with long needle profilometers. The soil moisture at field scale was assumed to be equal to the mean value estimated from 15 samples (per field) collected from different depths: the top 1 cm of soil, the top 2 cm and the top 5 cm, using the gravimetric method. Important variations of the volumetric moisture content were observed ranging from 4% to 38%.
3.2. Description of the Villamblain Site
In this study, data acquired over eight experimental campaigns between October and December 2006 on the Villamblain site was used. The study site is located in South West of Paris (France) with a very flat topography (latitude 48° 10′ N and longitude 01° 48′ E). This site is characterized by large agricultural fields with a homogenous soil composed of about 60 % loam, 30 % clay and 10 % sand [15] (Macaire, 1971). The main crops at the Villamblain site are wheat and corn. Therefore, from September to December, many bare soil fields are found before wheat sowing. Therefore, for all dates, approximately half of the fields are bare soil. At each recording date, radar measurements were made with the ASAR/ENVISAT sensor. Simultaneously to radar acquisitions, ground truth measurements were acquired for a large number of bare soil test fields, thus providing soil parameters, in particular moisture, at various depths. Two SPOT optical images were used to accurately define field boundaries.
- Soil moisture measurements
Measurements of the soil moisture were carried out in order to estimate soil moisture profiles within the top 5 cm (0-1 cm, 1-2 cm, 2-5 cm) using a gravimetric method with about fifteen samples per field. These samples were gathered using metal cylinders with different length (1 cm, 2cm and 5cm).
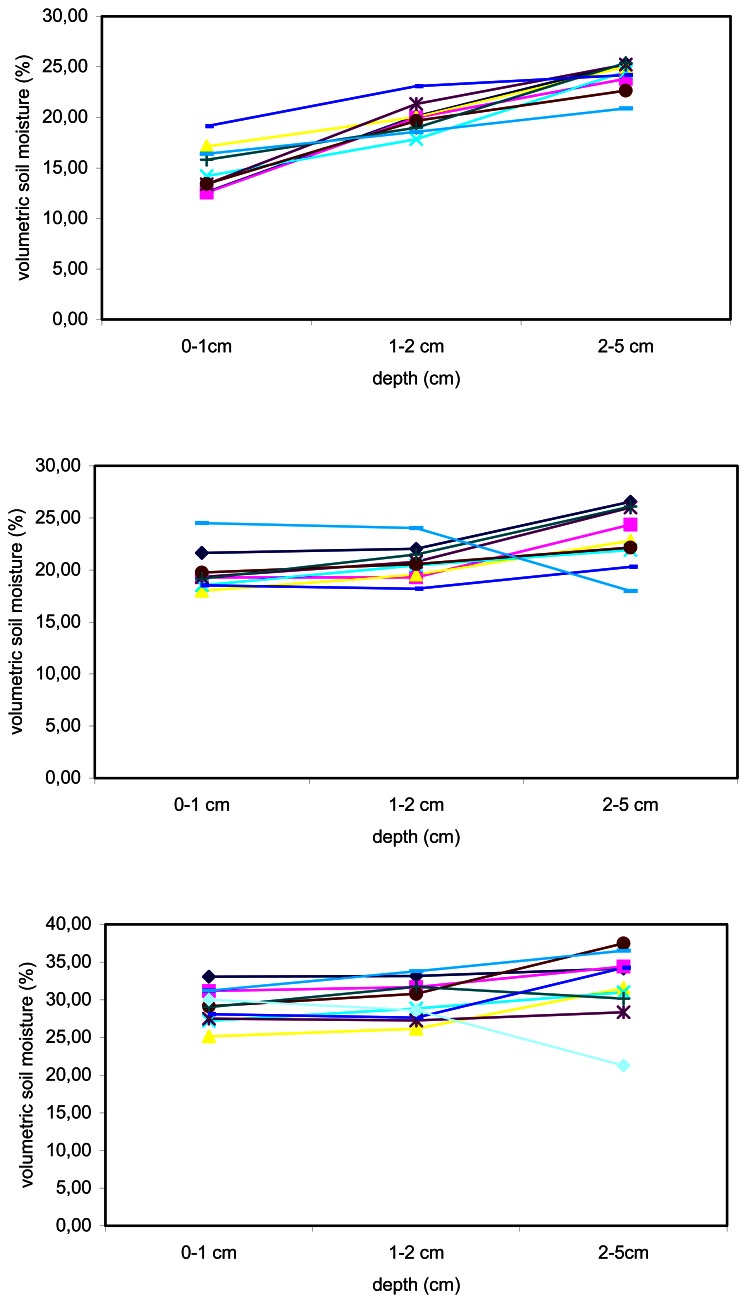
On each date, measurements were made on more than 8 fields. Many bulk density measurements were carried out for each training site using three types of cylindrical sample, namely 49 cm3 with a depth of 2.5 cm, 98 cm3 with a depth of 5 cm, and 196.25 cm3 with a depth of 10 cm, so that gravimetric soil moisture measurements could be converted into volumetric water content, and the change in density could be analysed as a function of depth. Table 1 illustrates the change in mean density as a function of depth, for each measurement date. It shows the general increase in density with soil depth, the lowest values often being observed in the first few centimetres of soil. Figure 2 illustrates various examples of volumetric soil moisture profiles, measured during experimental campaigns. It is clearly shown that the hypothesis of uniform soil moisture profile is valid only for large soil moisture values. In most other cases, soil moisture is found to increase with increasing depth. In the general case of a decrease in soil moisture several hours or days after a rain event, the soil moisture decreases firstly on the surface, and then decreases with a delay which increases with increasing depth.
Table 1.
Soil density variations as a function of soil depth for each date
| Date (dd/mm/yy) | Density 0-2.5 cm | Density 2.5-5 cm | Density 5-10cm |
|---|---|---|---|
| 10/10/2006 | 1.02 | 1.11 | 1.114 |
| 20/10/2006 | 1.05 | 1.16 | 1.13 |
| 26/10/2006 | 1.05 | 1.10 | 1.14 |
| 08/11/2006 | 1.04 | 1.11 | 1.13 |
| 14/11/2006 | 1.05 | 1.08 | 1.16 |
| 24/11/2006 | 1.03 | 1.12 | 1.21 |
| 19/12/2006 | 1.05 | 1.09 | 1.19 |
Figure 2.
Illustration of soil moisture variation as a function of soil depth for all test fields at different dates (a) 26/10/2006, (b) 14/11/2006, (c) 24/11/2006
- Roughness measurements
Roughness measurements were made using a pin profiler (with a total length of 1 m and a resolution between two consecutive pins of 2 cm). Ten profile measurements were made for each test field. For each date a large range of roughness values is found, from smooth to rough surfaces. For each test field, two roughness parameters are derived, namely the rms surface height and the correlation length (l). The correlation function describing height profiles is chosen to be exponential [2] :
| (16) |
Only a small range of roughness values is observed in measurements having rms heights from 0.87 cm to 1.86 cm and a correlation length of 1.8 cm to 6.4 cm.
3.3. Satellite measurements
ESA launched the ENVISAT satellite with the ASAR radar in March 2002. The wavelength used is 5.6 cm (C-band). In this study, the narrow mode corresponding to high resolution data (pixel spacing = 12.5 m x 12.5 m) was chosen. On eight different dates, data was acquired over Villamblin site using the configurations described in table 2.
Table 2.
Details of satellite images
| Date (dd/mm/yy) | Incidence angle | Sensor/mode | Polarization | Pixel spacing | Mean soil moisture“Ws”(%) |
|---|---|---|---|---|---|
| 10/10/2006 | 16.6° | ASAR/IS1 | HH/VV | 12.5 m by 12.5 m | 23.3 |
| 20/10/2006 | 16.4° | ASAR/IS1 | HH/VV | 12.5 m by 12.5 m | 23.3 |
| 26/10/2006 | 20.5° | ASAR/IS2 | HH/VV | 12.5 m by 12.5 m | 21.5 |
| 08/11/2006 | 20.3° | ASAR/IS2 | HH/VV | 12.5 m by 12.5 m | 20.2 |
| 14/11/2006 | 16.7° | ASAR/IS1 | HH/VV | 12.5 m by 12.5 m | 21.8 |
| 24/11/2006 | 16.4° | ASAR/IS1 | HH/VV | 12.5 m by 12.5 m | 31 |
| 27/11/2006 | 24° | ASAR/IS2 | HH/VV | 12.5 m by 12.5 m | 25.7 |
| 19/12/2006 | 16.6° | ASAR/IS1 | HH/VV | 12.5 m by 12.5 m | 27.7 |
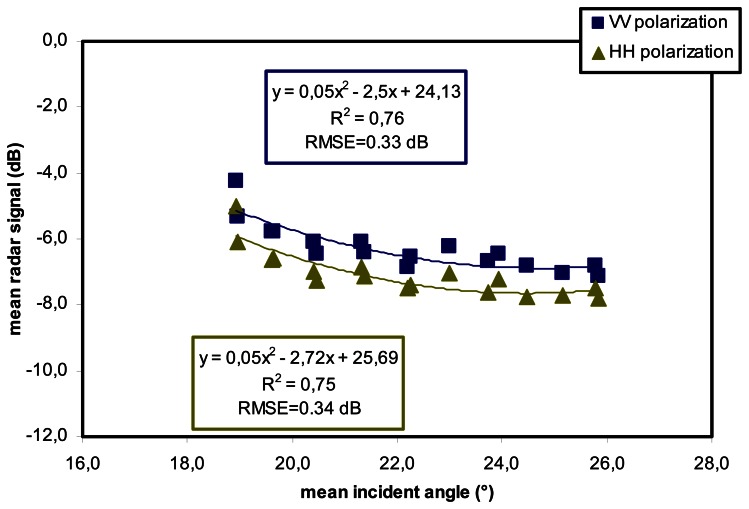
Absolute calibration of the ASAR images was carried out to transform the radar signal (a digital number) into a backscattering coefficient (σ0). All images were georeferenced using topographic maps with a root mean square error of the control points of about 20 m. The registration error of the ASAR images is taken into account by selecting areas of interest (AOI) within each training site and removing 2 pixels relative to the limits defined by the GPS control points. After radar images calibration, for each test field, a mean radar signal value is estimated. As observed in table 2, radar measurements correspond to low incidence angles (IS1 and IS2 configurations). Small incidence angle differences are noted between measurements performed over Villamblain at different dates. The following normalization is thus proposed, based on a simple polynomial empirical model as illustrated in figure 3. The data used to retrieve the model are collected from a large number of Area of Interest (AOI) made over bare soil fields with different incidence angles.
Figure 3.
Illustration of polynomial empirical model developed for radar data normalisation at one incidence angle, for IS2 configuration
Analysis is made in the highest soil moisture day with a very small spatial variation, to verify the independence of retrieved parameters with soil moisture. As observed in figure 3, normalisation errors are very limited (root mean square error under 0.35 dB for horizontal and vertical polarisations). This is due particularly to the small spatial and temporal changes in roughness retrieved on the Villamblain site during the studied period. After this operation, all the data were normalized to a twenty degree incidence angle.
4. Application and results
4.1. Analysis of correlation between moisture and radar measurements
In order to minimize the influence of roughness temporal change on our analysis, we characterize the radar signal dynamic, as a function of soil moisture, by averaging the soil moisture data and radar signals over all of the bare soil fields at the Villamblain site. We consider therefore the hypothesis that roughness effect on radar signal is approximately the same for the eight dates of measurement over the site. In fact, roughness measurements over Villamblain site show very limited spatial and temporal variations. Bare soil fields are identified by means of the NDVI vegetation index estimated from SPOT optical images.
Different research studies have shown that the following empirical relationship could be established between the radar signal and soil moisture [6]:
| (17) |
Where Ws, volumetric soil moisture, coefficients a and b depend on the incidence angle, roughness and polarization.
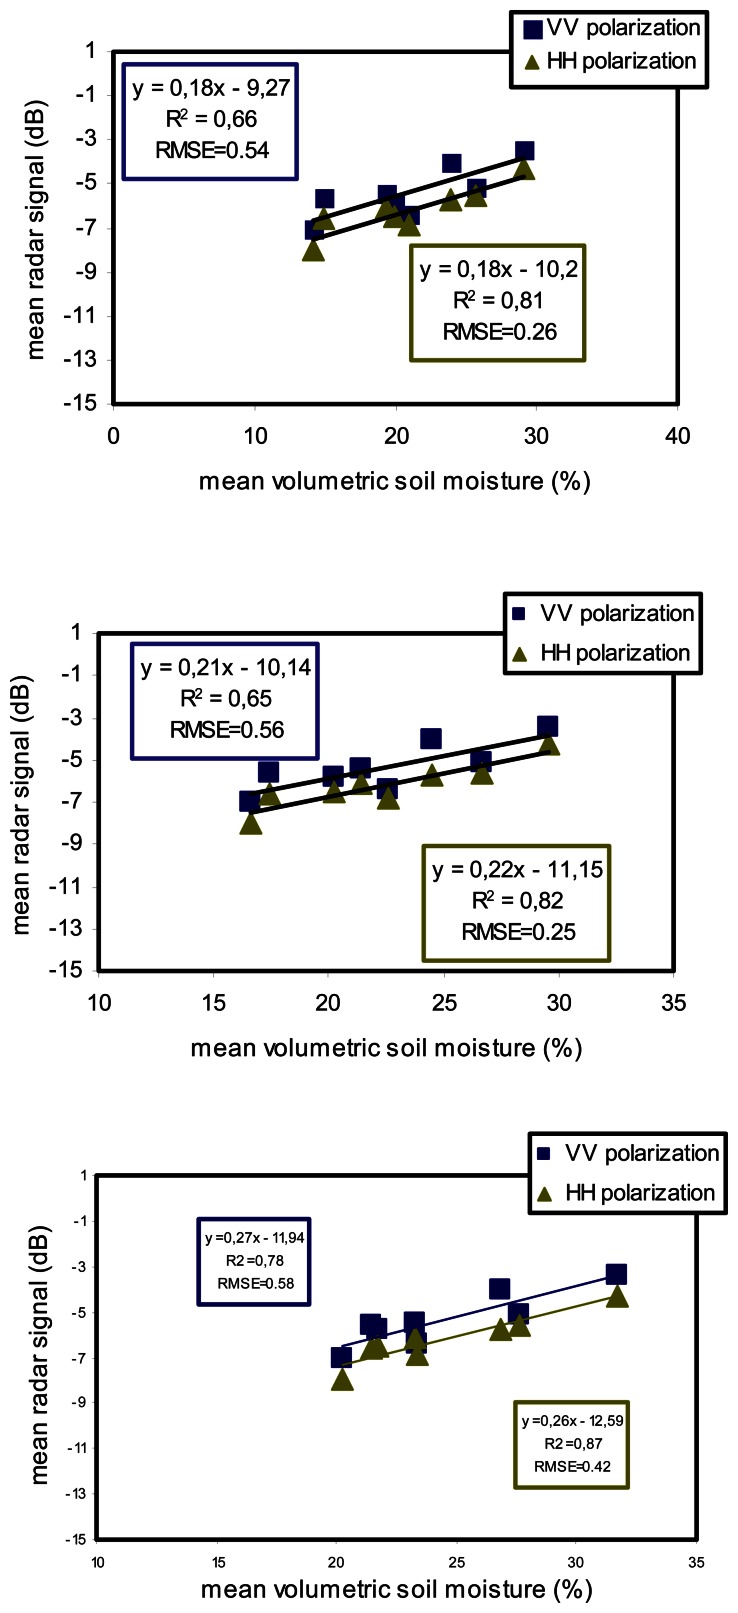
However, from one study to another, the slope parameter may vary widely. Zribi et al. [5], have shown the influence of the spatial distribution of roughness and of the variation from one date to another in the estimated parameter. One of the goals of this study was to identify how the protocol used to derive ground truth measurements of soil moisture can influence this variation. Figure 4 illustrates the mean radar signal calculated over the same test fields as a function of mean moisture at different depths (0-1 cm, 0-2 cm and 0-5 cm). These results show a clear difference between the three relationships derived for each of the three depths investigated here, with large differences in the parameter a. The observed sensitivity of the radar signal to soil moisture is approximately 0.18dB/%, 0.21dB/%, and 0.27dB/%, respectively, for the three depths, with VV polarisation. In fact, for small depths (0-1cm), the range of moisture values is the largest and so, the slope of the linear relation is the smallest.
Figure 4.
Illustration of mean radar signal behaviour over the studied site as a function of soil moisture measured at different depths, (a) 0-1 cm, (b) 0-2 cm, (c) 0-5 cm
The significance of these linear association between moisture measurements and radar signals was tested for the three depths using Fisher's F test for α = 0.05 significance level. Table 3 illustrates the values of F and significance for the different cases. All were found significant.
Table 3.
Illustration of Fisher's F test results for linear relationships between moisture measurements and radar signals
| depth | HH polarization | VV polarization | ||
|---|---|---|---|---|
| F | significance | F | significance | |
| 1 cm | 25.45 | 0.0023 | 11.60 | 0.014 |
| 2 cm | 26.60 | 0.0021 | 11.1 | 0.016 |
| 5 cm | 38.89 | 0.00078 | 21.1 | 0.0037 |
This result shows how important it is to have actual measurements of moisture available at the same depths in the various studies, because of its influence on the relationship established between moisture and the radar measurements. Because of the limited number of radar measurements and the small range of soil moisture, the established relationships need to be validated by a second period of measurement if we apply them for radar signal inversion to estimate soil moisture.
After this experimental analysis, the effects of the soil moisture profile on radar signal simulations will be investigated. In spite of the differences generally observed between IEM simulations and radar measurements, particularly for high roughness [2], the IEM model is nevertheless a powerful tool for analysing sensitivities and understanding the various parameters which affect the radar signal.
4.2. Analysis of the multi-layer profile effect using the IEM model
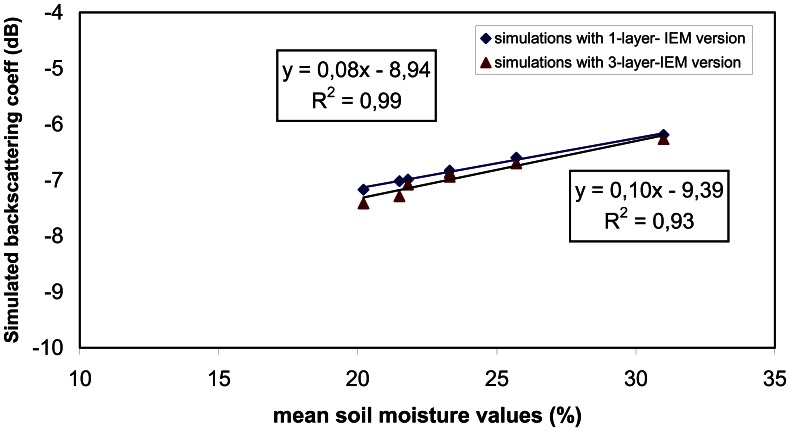
Based on ground truth measurements carried out on the two experimental sites, we computed the backscattering coefficients for each moisture measurement using both the modified IEM model (three-layer profile: 0-1 cm, 1-2 cm, 2-5 cm) and its classical version (one layer), and a mean moisture value. Figure 5 illustrates the results of these simulations. They show that the difference between the two types of simulation does not exceed 0.5dB, for all studied cases. Although this difference is not very large compared to other effects related to vegetation or roughness, it could obviously lead to changes in the relationship between moisture and radar signal measurements.
Figure 5.
Comparison between backscattering values obtained with the two IEM versions (one layer and three layers) according to mean soil moisture over the Villamblain site
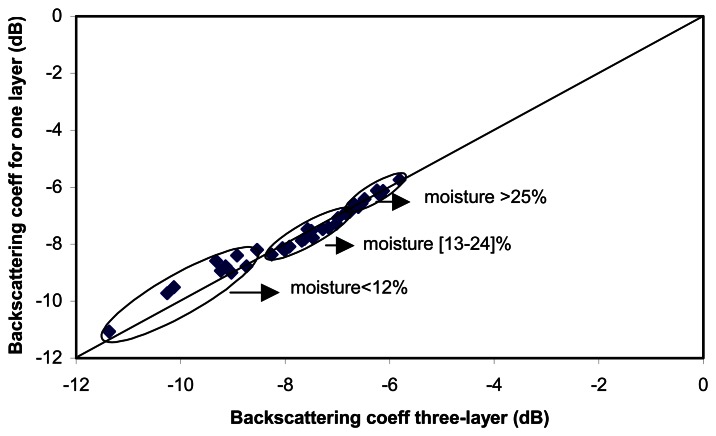
Using all ground measurements acquired on the two studied sites, simulations performed using the two IEM versions show that the multi-layer model does not influence the simulations for high moisture values. In fact, in this case, the difference between the first, second and third layers is known to be very small.
For volumetric soil moistures ranging from 12% to 24%, a decrease in the radar signal value is found when using a multi-layer model (Figure 6). This decrease is explained by the underestimation of the effect on the backscattering level of layers ranging in depth between 0 and 2 cm when averaging is performed over a thickness of 0 to 5cm. This can be explained by the fact that the wave penetration is small, so that the effect of the first layers between 0 and 2 cm, which are generally drier and have smaller moisture than the mean value computed over all the measurements, must be stronger than that produced by layers between 2 and 5 cm in depth. In the range between 3% and 12% an opposite behaviour is observed. This is due to the fact that averaging the soil moisture underestimates the effect of deeper layers, whose moisture is larger than the mean value and which provide a large contribution due to the deeper penetration of the radar signal. As observed in experimental measurements, these deeper layers have the highest soil moisture.
Figure 6.
Comparison between the two IEM versions (one layer and three layers), using soil moisture measured at the two studied sites
5. Conclusions
The objective of this paper was to analyse the effect of the soil moisture profile on the estimation of radar signals over bare soils. Because it was not possible to take into account the full range of soil moisture variability as a function of soil depth, a modification of the IEM model is proposed, which involves three layers each having a different soil moisture value.
The relationship between the radar signal and soil moisture reveals a strong dependence on the depth of the considered measurements. Analysis based on a modified IEM model illustrates the effect on radar simulations of taking the soil moisture profile into consideration, in IEM model validity domain. Although it does not exceed 0.5dB in the experimental measurements described here, this effect could partially explain the differences in the parameters of the linear relationship between the radar signal and soil moisture. Simulations also show how the contribution of each of the three layers changes as a function of soil moisture range.
In conclusion, the main result of this study is that the protocol used when measuring soil moisture is of utmost importance. Different measurements performed without an accurate knowledge of depth lead to an inaccurate estimation of the correlation between soil moisture and the radar signal.
Acknowledgments
This work was financed by the French CNES/TOSCA program. The authors would like to thank the European Space Agency (ESA) for providing them with the ASAR images free of charge, through the ENVISAT/ASAR project n° 351. The authors would also like to thank the BRGM and CETP teams for their logistical support during the field campaigns.
References and Notes
- 1.Bruckler L., Wittono H., Stengel P. Near surface moisture estimation from microwave measurements. Remote Sens. Environ. 1988;26:101–121. [Google Scholar]
- 2.Zribi M., Taconet O., Le Hégarat-Mascle S., Vidal-Madjar D., Emblanch C., Loumagne C., Normand M. Backscattering behavior and simulation comparison over bare soils using SIRC/XSAR and ERASME 1994 data over Orgeval. Remote Sens. Environ. 1997;59:2, 256–266. [Google Scholar]
- 3.Cognard A.L., Loumagne C., Normand M., Olivier P., Ottlé C., Vidal-Madjar D., Louahala S., Vidal A. Evaluation of the ERS-1/synthetic aperture radar capacity to estimate surface soil moisture: Two-year results over the Naizin watershed. Wat. Resour. Res. 1995;31(4):975–982. [Google Scholar]
- 4.Le Hégarat-Mascle S., Zribi M., Alem F., Weisse A. Soil moisture estimation from ERS/SAR data: Toward an operational methodology. IEEE Trans. Geosci. Remote Sens. 2002;40:12, 2647–2658. [Google Scholar]
- 5.Zribi M., Baghdadi N., Holah N., Fafin O. New methodology for soil surface moisture estimation and its application to ENVISAT-ASAR multi-incidence data inversion. Remote Sens. Environ. 2005;96:485–496. [Google Scholar]
- 6.Baghdadi N., Holah N., Zribi M. Soil moisture estimation using multi-incidence and multi-polarization ASAR SAR data. Int. J. Remote Sens. 2006;27:10, 1907–1920. [Google Scholar]
- 7.Boisvert J.B., Gwyn Q.H.J., Chanzy A., Major D.J., Brisco B., Brown R.J. Effect of surface soil moisture gradients on modeling radar backscattering from bare fields. Int. J. Remote Sens. 1997;18(1):153–170. [Google Scholar]
- 8.Fung A.K., Boisvert J., Brisco B. Interpretation of radar measurements from rough soil surface with a permittivity profile. IGARSS'97. 1997;3:1376–1378. [Google Scholar]
- 9.Walker J.P., Troch P.A., Mancini M., Willgoose G.R., Kalma J.D. Profile soil moisture estimation using the modified IEM. IGARSS'97. 1997;3:1263–1265. [Google Scholar]
- 10.Crosson W.L., Laymon C.A., Inguva R., Bowman C. Comparison of the two microwave radiobrighthness models and validation with field measurements. IEEE Trans. Geosci. Remote Sens. 2002;40:143–152. [Google Scholar]
- 11.Lu T., Shi C., Li Z. Electromagnetic scattering and emission from rough surfaces of soil with inhomogeneous moisture profile. 4th ICMMWTP; 2004. pp. 940–944. [Google Scholar]
- 12.Ulaby F.T., Moore M.K., Fung A.K. Microwave Remote Sensing, Active and Passive. Vol. 3. Artech House; Norwood, MA: 1986. [Google Scholar]
- 13.Wu T.D., Chen K.S., Shi J., Fung A.K. A transition model for the reflection coefficient in surface scattering. IEEE Trans. Geosci. Remote Sens. 2001;39:9, 2040–2050. [Google Scholar]
- 14.Hallikanen M.T., Ulaby F.T., Dobson M.C., El-Rayes M., Wu L. Microwave dielectric behavior of Wet Soil- Part I: Empirical Models and Experimental Observations. IEEE Trans. Geosci. Remote Sens. 1985;GE-23(1):25–34. [Google Scholar]
- 15.Macaire J. M. Thèse 3ecycle. Université d'Orléans; 1971. Etude sédimentologique des formations superficielles sur le tracé de l'autoroute A10 entre Artenay et Meung/Loire; p. 104 pp. [Google Scholar]


