

Abstract
Objective
To address the issue of nonresponse as problematic and offer appropriate strategies for assessing nonresponse bias.
Study Design
A review of current strategies used to assess the quality of survey data and the challenges associated with these strategies is provided along with appropriate post-data collection techniques that researchers should consider.
Principal Findings
Response rates are an incomplete assessment of survey data quality, and quick reactions to response rate should be avoided. Based on a five-question decision making framework, we offer potential ways to assess nonresponse bias, along with a description of the advantages and disadvantages to each.
Conclusions
It is important that the quality of survey data be considered to assess the relative contribution to the literature of a given study. Authors and funding agencies should consider the potential effects of nonresponse bias both before and after survey administration and report the results of assessments of nonresponse bias in addition to response rates.
Keywords: Nonresponse bias, response rate, survey quality
Surveys have become an important tool in the health services researcher's toolbox. Much of what we know about health services is based on surveys of health care providers, patients, and other stakeholders. When assessing survey research quality, we need to consider many factors, including the internal validity of the conclusions drawn and the external validity of the data as we extend the conclusions to the population broadly. Although response rate has become a dominant factor in the assessment of quality in terms of external validity, it is a flawed indicator of data quality (Fowler et al. 2002). Researchers commonly increase sample size to compensate for nonresponse bias; however, such action does not ensure a representative sample (Groves 2006; Groves and Peytcheva 2008). The pool of respondents may not offer a balanced representation of the overall population in question; thus, findings may not be generalizable to the group at large. Moreover, if the sample is not representative of the target population, inferences made about the cause–effect relationships may be biased. Researchers have suggested that survey nonresponse shifts the mean values of certain outcomes (e.g., attitudes toward work) and changes the measured relationships between variables (e.g., correlations; see Taris and Schreurs 2007).
A number of authors have underscored the need for researchers to go beyond response rates in assessing the quality of their data (Cummings, Savitz, and Konrad 2001; Fowler et al. 2002). In our view, very few researchers have addressed this concern. As one indicator, over the past 3 years, 23 papers based on primary survey data have been published in Health Services Research. Of those, only 12 have addressed nonresponse bias beyond reporting of the response rate. We propose that this is the case because researchers are unsure of how to best assess nonresponse bias in their samples and subsequently discuss nonresponse bias in their manuscripts. Although there is a rich literature concerning nonresponse bias in the literature (Groves 2006; Rogelberg and Stanton 2007), we translate those works into a decision making framework to assist researchers in choosing a strategy for assessing nonresponse bias.
Defining Nonresponse Bias
One common way to assess the quality of survey data is to examine the response rate, or the percentage of people who completed the survey after being asked to do so. As evidence of the perceived importance of response rates, authors have attempted to determine benchmarks for response rates by examining the average response rate across a body of research (Asch, Jedrziewski, and Christakis 1997; Sitzia and Wood 1998; Cummings, Savitz, and Konrad 2001). Although they are an indicator of survey data quality, response rates are highly problematic. Response rates can be valuable when they are very high, but even then we have to be careful (e.g., Baines et al. 2007 found evidence of nonresponse bias even with an 83 percent response rate). Rather than sole reliance on response rate, health services researchers should consider the true impact of nonresponse on their data and interpretations.
Nonresponse bias is a systematic difference between those who respond and those who do not respond on a substantive construct measured by a survey (Taris and Schreurs 2007). The concern with nonresponse bias is that the conclusions one draws from the data may not represent the population; the findings from the respondents may not generalize to the population. Conceptually, one can think about nonresponse bias in terms of the following equation (Rogelberg and Stanton 2007):
| (1) |
In this equation, PNR represents the proportion of nonrespondents (1—response rate),  the mean of the respondents on a variable of interest to the survey (e.g., the dependent variable), and
  is the population mean on that same variable. Of course,
  is what we are often trying to estimate (and impossible to know, in most cases), so this equation is meant more for illustrative purposes than for use in actual calculations. It represents two main components. The
  component is an indicator of error. The greater the difference between the sample and population means, the greater the nonresponse bias. The PNR component determines the impact that response rate has on that error; in effect it sets the bounds of nonresponse bias (Rogelberg and Stanton 2007). If response rate is higher, PNR is lower, and nonresponse bias is lower.
Groves (2006) presents an alternative equation that is mathematically different, yet would yield similar conclusions about bias. His equation is as follows:
| (2) |
The first part of the equation is equivalent to the equation above. The second part, however, subtracts the mean of the nonrespondents  from the mean of the respondents rather than subtracting the mean of the population from the mean of the respondents. Just as it is impossible to know the mean in the population in the equation above, it is similarly impossible to truly know the mean of the nonrespondents (or else they would presumably be respondents and one would also then know the mean of the population). However, there may be ways to estimate the mean of the nonrespondents through a variety of proxies (Groves and Peytcheva 2008). Although imperfect, it could offer hints about the extent to which the mean of the nonrespondents is influencing the statistical inferences about the population. This equation is valuable because it suggests that nonresponse rate and nonresponse bias are not necessarily positively correlated. Clearly, as nonresponse rate approaches zero, the amount of nonresponse bias approaches zero. As the nonresponse rate and the mean of the nonrespondents are independent, one could have a very high nonresponse rate with relatively little nonresponse bias (e.g., if the mean of the respondents and the mean of the nonrespondents are very similar).
Although the equations for nonresponse bias emphasize differences in the means between respondents and nonrespondents, it is worth noting that this can impact other statistics as well. Obviously, any test of mean differences (e.g., a t-test, ANOVA, etc.) could be impacted by nonresponse bias. However, other tests of associations between variables (e.g., correlation and regression) are also influenced by mean values of the variables. As a result, nonresponse bias goes beyond simply inflated or deflated mean values on a variable—it can lead to inflated or deflated inferences about the relationships between two variables.
Researchers would ideally take steps to minimize nonresponse bias during the study design phase. For example, techniques aimed at increasing response rates include techniques such as different and multiple survey modes (e.g., mail vs. telephone vs. internet; Baines et al. 2007; Beebe et al. 2007; Fowler et al. 2002; Nicholls et al. 2011; Rivara et al. 2011), incentives for participation (Deehan et al. 1997; Halpern et al. 2002, 2011), cognitive interviewing (Willis, DeMaio, and Harris-Kojetin 1999), and highlighting the match between the survey and potential participants' interests (Groves, Cialdini, and Couper 1992). Along these lines, funders and sponsors of research should help play a role by understanding that their investment will hold less value if the researcher is unable to address nonresponse bias prior to data collection. However, steps to avoid nonresponse bias may not be successful or researchers may not be in a position to contribute to the study design (e.g., using secondary data). As such, our focus is primarily on techniques to assess nonresponse after data collection.
A Decision Framework For Assessing Nonresponse Bias
We summarize various approaches to assessing nonresponse bias in Table 1. We provide an illustration of how one might implement each of these techniques in an appendix on the HSR website. In Figure 1, we provide a decision framework that will guide our analysis. We build our framework on five questions that health services researchers can ask to determine which techniques for assessing nonresponse bias might be most appropriate. In general, we have arranged the questions in order of how unlikely the researcher is to be able to answer “Yes.” For example, in most cases, it is least likely that the researcher will have access to the original population, though we recognize every dataset is unique.
Table 1.
Summary of Techniques to Address Nonresponse Bias
| Technique | Description | Pitfalls to Avoid | Reference/Further Reading |
|---|---|---|---|
| Comparison of sample and population | Comparison of the sample to known characteristics of the population. Often only demographic characteristics will be compared | If demographics are not the core variables tested in the model, simply comparing demographics of the sample to the population may not provide a valuable evaluation of nonresponse bias | Armstrong and Overton (1977) (See also Groves 2006; Beebe et al. 2011) |
| Follow-up analysis | A sample of nonrespondents are surveyed on substantive variables in the study to determine if any meaningful differences exist between those who did complete the survey and those who did not | Nonresponse may also be high in the follow-up survey, making it difficult to assess nonresponse bias | Sosdian and Sharp (1980) (See also Groves 2006) |
| Wave analysis | Respondents who completed the survey prior to the deadline are compared with those who completed the survey after the deadline (or in response to a reminder) | This technique does not actually assess nonrespondents, as the second (or later) wave participants did indeed respond to the survey. Thus, although assumptions can be made regarding nonresponse bias, it cannot truly be assessed | Ellis, Endo, and Armer (1970) (See also Filion 1976; Fitzgerald and Fuller 1982; Lin and Schaeffer 1995; Mazor et al. 2002; Yessis and Rathert 2006) |
| Passive and active nonresponse analysis | Meaningful differences exist between those who actively choose not to participate in a survey and those who are passively nonrespondent. For active nonrespondents, researchers can examine a random sample of the population through focus groups, interviews, and a very brief survey to assess whether they intend to complete the survey, and if not, why not. For passive nonrespondents, simply resending the survey might address this issue. Researchers may also consider including items in the survey that might assess causes of passive nonresponse (e.g., workload) | Those who were opposed to the survey to start (active nonrespondents) may not be likely to participate in an interview or focus group. Repeated surveys may help with passive nonrespondents but will probably not lead to full participation | Rogelberg and Stanton (2007) (See also Beebe et al. 2008; Peiperl and Baruch 1997; Rogelberg et al. 2003; Roth 1994) |
| Interest-level analysis | Interest in the survey topic is associated with a greater likelihood of responding. Researchers may consider asking questions about the level of each participant's interest in the survey and, assuming an adequate level of variation in those responses, statistically control for interest level when conducting the analyses | This technique does not actually examine nonrespondents and thus may not directly address the issue of nonresponse bias | Rogelberg and Stanton (2007) (See also Groves, Singer, and Corning 2000; Groves and Peytcheva 2008; Rogelberg et al. 2000) |
| Benchmarking | Benchmarking findings against other published data, examining whether the descriptive statistics (e.g., means, standard deviation, etc.) for those measures are consistent with previously published studies | If one is looking at a specific group because he or she believes the group is unique and will differ from the population, then such a comparison becomes problematic | Rogelberg and Stanton (2007) (See also Asch, Jedrziewski, and Christakis 1997; Cummings, Savitz, and Konrad 2001; Sitzia and Wood 1998) |
| Replication | Researchers may attempt to replicate the findings. Similar findings in multiple samples would suggest that nonresponse bias is not a significant concern | Replication may be more costly than trying to raise the original response rate and it is difficult to determine if nonresponse bias is acting in the same way across multiple samples | Rogelberg and Stanton (2007) |
Figure 1.
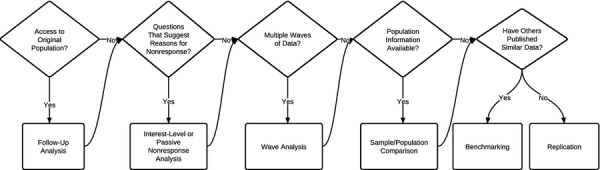
Decision Chart for Nonresponse Bias Assessment
Do You Have Access to the Population?
Our first question is about whether the researcher has access to the population; in other words, can he or she still collect data from the participants (or the nonrespondents)? In many cases, we theoretically have access to the population, but it might not be particularly helpful. For example, if one is using data from a representative sample of adults within a state to examine risk factors associated with emergency department visits, one might assume that a researcher could always resurvey from that population. Much of the time, we work with deidentified data such that even if we could resample from the population, we would not know who the original respondents were.
However, there may be instances when a researcher has access to the population and could go back to the population to collect additional data, either by drawing new samples from that population or going back to the original sample and repeating the call for responses. In those instances, the researcher may consider changing the mode of the survey (e.g., going from pencil-and-paper to online or telephone) to reach people with different preferences for completing the survey and raise the response rate (cf., Fowler et al. 2002; Baines et al. 2007).
A related approach would be to focus on the nonrespondents using a technique called follow-up analysis. In follow-up analysis, researchers survey a sample of the nonrespondents on substantive variables in the study to determine if any meaningful differences exist between those who did or did not complete the survey (Sosdian and Sharp 1980). As this group was resistant to the survey to begin with, researchers will typically use a significantly shorter survey that includes only the most critical variables (or the variables most susceptible to nonresponse bias). Revisiting equation 2 above, a researcher could take the mean on a substantive variable from the respondents and the mean from the nonrespondents and multiply it by the nonresponse rate to create an assessment of nonresponse bias. Although helpful in determining the extent of nonresponse bias, this approach is limited in that nonresponse is typically high in the follow-up survey, making it difficult to assess the “true” nonresponse bias.
Are There Questions in the Survey That Might Address Reasons for Nonresponse?
Next, researchers can ask themselves whether the survey includes questions that might provide hints about the nature and extent of nonresponse bias. This can take two forms: assessing the level of passive nonresponse and assessing interest in the survey.
The limited research on nonrespondents (e.g., Rogelberg et al. 2003) has found that there are meaningful differences between those who actively choose not to participate (e.g., are clearly opposed to participation) and those who are passively nonrespondent (e.g., forgot about the survey). Rogelberg et al. (2003) found that passive nonrespondents were very similar to respondents in their attitudes (and thus their responses to attitude-based surveys). However, active nonrespondents were significantly different from respondents in their attitudes (see also Rogelberg et al. 2000). This suggests that active nonrespondents are different from respondents, whereas the differences between passive nonrespondents and respondents are fewer. Furthermore, it means that dealing with active and passive nonrespondents requires slightly different strategies.
Rogelberg and Stanton (2007) suggest that for active nonresponse, researchers can examine a random sample of the population through focus groups, interviews, and a very brief survey to assess whether they intend to complete the survey, and if not, why not (this is essentially identical to the follow-up analysis described above). If the percentage of active nonrespondents is very low (e.g., below 15 percent), nonresponse is unlikely to have a significant impact on the study (Roth 1994; Rogelberg et al. 2003). If, however, it is a high percentage, the researcher may wish to make changes to the survey or survey procedures (e.g., the invitation or incentives) to try to persuade active nonrespondents to participate. Passive nonrespondents would have completed the survey, but forgot to do so, did not actually receive it, or some other related excuse (Peiperl and Baruch 1997).
Passive nonrespondents appear to be more common than active nonrespondents in survey studies (Gliksman, Smythe, and Engs 1992; Kaner, Haighton, and Mcavoy 1998). As Rogelberg et al. (2003) noted, typically these individuals are not different from the sample of respondents except for areas of personality or in cases where the survey has something to do with work demands (see also Beebe et al. 2008; McLeod et al. 2009). Rogelberg and Stanton (2007) suggest including items in the survey that might assess correlates of passive nonresponse (e.g., workload). If the results indicate a relationship with a substantive variable in the survey (e.g., those who are more busy seem less likely to use an EHR), researchers should statistically control for these variables.
Leverage-Salience Theory (Groves, Presser, and Dipko 2000) suggests that interest in the survey topic, along with other characteristics of the survey and its administration (e.g., an incentive), is associated with a greater likelihood of responding to surveys. If interest level is associated with substantive variables in the survey, it is worth considering the extent of this relationship as a potential indicator of nonresponse bias. For example, if one were conducting a survey of occupational injuries of registered nurses, lack of interest in a survey may exist among those who have never experienced an injury or work in areas where injuries are less likely (e.g., a triage call center). In this case, lack of interest may lead to an upward bias in the estimation of injuries. One way to address this is to ask questions about the level of each participant's interest in the survey topics (e.g., “On a scale of 1–5, what is your interest in issues related to occupational injuries?” or by using the survey interest scale developed by Rogelberg et al. 2001) and statistically control for interest level when conducting the analyses (Rogelberg and Stanton 2007). This is also consistent with leverage-salience theory in that asking about interest in a specific substantive variable (e.g., occupational injuries) would presumably increase the salience of that topic and thus the likelihood of responding. Similar to some of the other techniques discussed, this approach does not actually examine nonrespondents and therefore may not fully address the issue of nonresponse bias (Rogelberg et al. 2000).
Another variant on interest-level analysis is to examine differences between participants who indicate they would be interested in completing a follow-up survey and those who indicate they would not (Groves and Peytcheva 2008). One could then examine differences in mean values for the “interested” versus “not interested” groups, assuming the “not interested” group represents future nonrespondents. This could be plugged into equation 2 to estimate the impact of nonresponse on the mean of a variable.
Were the Data Collected in Multiple Waves or Using Multiple Reminders?
A “yes” to this question (and its secondary requirement—that a researcher knows who filled out the survey at each wave or after each reminder) offers a proxy of nonresponse based on the people who did not respond to the initial wave(s) of data collection. The logic behind this approach is based on a process called the continuum of resistance, which suggests that each subsequent wave of participants demonstrates greater resistance in completing the survey (Filion 1976; Fitzgerald and Fuller 1982; Lin and Schaeffer 1995). By this logic, one could use the last people to respond (thus, the most difficult to obtain) as proxies for nonrespondents, as they are closest to nonrespondents on the continuum of resistance. Thus, we can compare the last group to respond with the others in the survey to examine potential differences that might approximate nonresponse bias.
Wave analysis is common, largely because many researchers use multiple waves of data collection (e.g., reminders) to collect the data. Yessis and Rathert (2006) highlighted the importance of this approach in health services research, finding that patients who responded to a reminder for a commercial patient satisfaction measure were significantly less positive in their satisfaction than were initial respondents (see also Mazor et al. 2002). In this approach, one compares those who complete the survey prior to the deadline with those who completed it after the deadline (or in response to a reminder; Ellis, Endo, and Armer 1970). From this comparison, one would derive means for the late respondents (proxies for nonrespondents) and the early respondents along with the overall nonresponse rate to calculate nonresponse bias based on equation 2.
As with the others, this approach has drawbacks as well. Clearly, one is not actually assessing nonrespondents, as the later wave participants did respond to the survey. Therefore, although we can make assumptions regarding nonresponse bias on the basis of this approach, we cannot truly assess it. Lin and Schaeffer (1995) highlighted the nature of this problem, finding that even respondents who required a great deal of effort to attain are not comparable to true nonrespondents. Similarly, Davern et al. (2010) found that those requiring a great deal of effort to attain were not substantively different from those responding early in the survey process. As such, although this can provide some assessment of nonresponse bias, it is limited in its ability to accurately estimate the extent of the bias.
Are Population Data Available?
Next, one might ask if there are data from the population that are accessible. Arguably the most common approach to assessing and addressing nonresponse bias has been to examine how one's sample matches known characteristics of the population (Armstrong and Overton 1977; Beebe et al. 2011). There are two different approaches one could take for such comparisons. Most common is a comparison with general population data (e.g., Census data), typically focusing on demographics. For example, in their study of nurses in South Carolina, Ma, Samuels, and Alexander (2003) compared their sample to the population of registered nurses in the state and found no significant differences in gender, age, level of education, and geographic location.
Alternatively, Beebe et al. (2011) compared their sample with another data source from the same population, matching the data at the participant (rather than group) level. Examining the impact of Health Insurance Portability and Accountability Act authorization forms (HAF) on nonresponse bias, they conducted a survey and were able to match their survey data to another data source that included health records that could be linked to participants in their study. This allowed them to go beyond simple sample versus population demographics to actually compare respondents with nonrespondents in their sample and, furthermore, compare them on issues that could be relevant to the study. As they could track the health status of all of the study participants, they could determine the extent to which health status impacted the likelihood that someone would respond to a survey where an HAF was required. As a result, they could determine that whereas the inclusion of an HAF in a study may reduce response rates (by 15 percent in their study), the reduction in response rate had no impact on nonresponse bias.
The population-level comparison and the participant-level comparisons have advantages and disadvantages. Often the focus is on demographics, as those are the data most likely to be available (e.g., through state nursing board databases). Unfortunately, in many cases demographics are not the core variables in the model tested and may not be markers of nonresponse bias (Rogelberg and Stanton 2007). However, there are instances where the demographics are key to the model (e.g., Ma, Samuels, and Alexander 2003; where demographics were conceptualized as predictors of nurse job satisfaction). In those cases, the comparison on gender characteristics is a valuable evaluation of nonresponse bias, although an incomplete examination as many other substantive variables in the model are not (or could not be) compared.
Participant-level comparisons address the limitations of the population-level comparisons by allowing the researcher to more directly compare respondents with nonrespondents using an external source of data. In some ways, this approach is closer to the follow-up analysis discussed earlier (and arguably a stronger approach, as the researcher is likely to have more complete data from nonrespondents). In cases such as Beebe et al. studies (2007, 2008), the participant data could be matched with data that were not only about the participants, but externally validated (e.g., diagnosis codes from a physician) rather than self-report. As they note, reliance on self-report data for certain outcomes, such as health outcomes, could introduce measurement error that could be interpreted as nonresponse bias (Beebe et al. 2011).
The disadvantage is that such data are rarely available. The Beebe et al. (2011) study is unique in that they could directly match participants in their study with an external database. Many researchers work with deidentified data that will not allow for this approach. However, particularly for studies of the health care workforce, researchers could find creative ways to obtain data. For example, collecting employee identification numbers could allow one to match data collected with the identification numbers to a variety of human resources databases.
In cases where such data are available, they may yield a number of other biases that are important to consider. Although there are clear advantages to the external validation of the physicians in the data used by Beebe et al. (2011), they are not without concern. Administrative data are also susceptible to measurement error (Lillard and Farmer 1997). Furthermore, data that are external but still rely on self-report (e.g., employee reports of occupational injuries to a human resources department) may skew assessments of nonresponse bias because the external data may themselves be subject to biased means due to nonresponse.
Have Others Published Similar Data?
In some cases, researchers simply will not have the data needed to conduct the above analyses. A number of options are available. Rogelberg and Stanton (2007) suggest benchmarking one's findings against other published data. Many measures of constructs in health services research have been used in other studies. A researcher could examine whether the descriptive statistics (e.g., means, standard deviation, etc.) for those measures are consistent with previously published studies. There are limitations to this approach as well. If one is looking at a specific group because he or she believes the group is unique and will differ from the population, such a comparison becomes problematic. However, in most cases, this approach can be used where other data are not available.
Finally, one might try to replicate the findings with a new sample (Rogelberg and Stanton 2007). Nonresponse bias is a characteristic of an individual sample; thus, finding similar findings in multiple samples would suggest that nonresponse bias is not a significant concern. However, this is likely a final resort given that (1) replication may be more costly than trying to raise the original response rate, and (2) one cannot know if nonresponse bias is acting in the same way across multiple samples.
Concluding Advice for Authors
Our basic recommendation to authors is to consider the potential for nonresponse bias before conducting a survey and to follow-up by also considering it once the data are collected. Where possible, researchers and funders should consider nonresponse bias before collecting data. For example, the techniques we have discussed above require specific information, in some cases, to assess nonresponse. This might require expansion of sampling frames to include important comparative information (at the very least demographics, but variables more directly related to the model of interest would be helpful). Researchers should also consider whether there are external sources of data they could draw upon to verify results and compare respondents and nonrespondents (cf., Beebe et al. 2011). Researchers should consider adding a single question related to passive nonresponse. Also useful would be to add a question about interest in a future survey, as it taps into interest level in the survey and could also be used to recruit future participation.
Researchers should also consider that nonresponse bias is not necessarily limited to individual respondents; there can be bias associated with organizations choosing not to participate in a study. Although ultimately people decide not to include their organizations studies, it generates a different “layer” of nonresponse bias at the organizational level. Several of the techniques discussed above can be extended to this level of analysis (e.g., examining passive and active nonresponse).
It is particularly important to consider which constructs might be more or less impacted by nonresponse bias. For example, if one were conducting a study of patient responsiveness in paying a bill, it would seem that nonresponse bias could have a major impact. Those who did not respond to the survey would seem more likely to also be less responsive to bills, perhaps due to a third variable (e.g., conscientiousness). Nonresponse bias can impact any variable, but clearly its impact is greater in certain cases.
In addition, we echo Groves' (2006) call for reporting multiple methods for assessing nonresponse bias in any given study. Clearly, there are instances where one would answer “no” to every question in the decision framework such that multiple nonresponse assessments would be impossible; however, that seems unlikely in most cases. As each of the techniques has weaknesses, it would be helpful in evaluations of nonresponse bias for authors to incorporate multiple assessments of nonresponse bias.
A logical next step after assessing nonresponse bias is to try to reduce it via analytic tools. Although the emphasis of this article is the assessment of nonresponse bias, it is worth noting what one could do to address nonresponse bias. One option is to weight data to account for differences in the sample and population to “push” the sample data closer to the population (Little and Rubin 2002). Weighting of the data should be done with some caution, however. Typically, weighting is based on known population characteristics, which may not have anything to do with the substantive variables in the model. Finally, although the underlying goal of weighting (addressing the possibility that a disproportionate response from one group does not sway the results) is acceptable, giving greater weight to groups with lower response assumes those limited respondents are similar to the population. If that is not the case, the weighting scheme has actually increased nonresponse bias.
As the field relies more heavily on survey data, the quality of those data must be considered to assess the relative contribution of a given study. Nonresponse bias may or may not be an issue in studies. However, it is imperative that authors consider its potential effects both before and after survey administration.
Acknowledgments
Joint Acknowledgment/Disclosure Statement: The authors would like to thank Douglas Wakefield, Cheryl Rathert, and Grant Savage for their comments on an earlier draft.
Disclosures: None.
Disclaimer: None.
SUPPORTING INFORMATION
Additional supporting information may be found in the online version of this article:
Appendix SA1: Author Matrix.
Appendix SA2: Examples to Illustrate Nonresponse Bias Assessment Techniques.
Data S1: Data to Support Nonresponse Bias Assessment Examples.
Please note: Wiley-Blackwell is not responsible for the content or functionality of any supporting materials supplied by the authors. Any queries (other than missing material) should be directed to the corresponding author for the article.
References
- Armstrong JS, Overton T. Estimating Nonresponse Bias in Mail Surveys. Journal of Marketing. 1977;14:396–402. [Google Scholar]
- Asch DS, Jedrziewski MK, Christakis NA. “Response Rates to Surveys Published in Medical Journals”. Journal of Clinical Epidemiology. 1997;50(10):1129–36. doi: 10.1016/s0895-4356(97)00126-1. [DOI] [PubMed] [Google Scholar]
- Baines AD, Partin MR, Davern M, Rockwood TH. “Mixed-Mode Administration Reduced Bias and Enhanced Poststratification Adjustments in a Health Behavior Survey”. Journal of Clinical Epidemiology. 2007;60:1246–55. doi: 10.1016/j.jclinepi.2007.02.011. [DOI] [PubMed] [Google Scholar]
- Beebe TJ, Locke GR, Barnes SA, Davern ME, Anderson KJ. “Mixing Web and Mail Methods in a Survey of Physicians”. Health Services Research. 2007;42(3):1219–34. doi: 10.1111/j.1475-6773.2006.00652.x. [DOI] [PMC free article] [PubMed] [Google Scholar]
- Beebe TJ, Jenkins SM, Anderson KJ, Davern ME. “Survey-Related Experiential and Attitudinal Correlates of Future Health Survey Participation: Results of a Statewide Survey”. Mayo Clinic Proceedings. 2008;83(12):1358–63. doi: 10.1016/S0025-6196(11)60784-2. [DOI] [PubMed] [Google Scholar]
- Beebe TJ, Ziegenfuss JY, St Sauver JL, Jenkins SM, Haas L, Davern ME, Talley NJ. “Health Insurance Portability and Accountability Act (HIPAA) Authorization and Survey Nonresponse”. Medical Care. 2011;49(4):365–70. doi: 10.1097/MLR.0b013e318202ada0. [DOI] [PMC free article] [PubMed] [Google Scholar]
- Cummings SM, Savitz LA, Konrad TR. “Reported Response Rates to Mailed Physician Questionnaires”. Health Services Research. 2001;35(6):213–26. [PMC free article] [PubMed] [Google Scholar]
- Davern M, McAlpine D, Beebe TJ, Ziegenfuss J, Rockwood T, Call KT. “Are Lower Response Rates Hazardous to Your Health Survey? An Analysis of Three State Telephone Health Surveys”. Health Services Research. 2010;45:1324–44. doi: 10.1111/j.1475-6773.2010.01128.x. [DOI] [PMC free article] [PubMed] [Google Scholar]
- Deehan A, Templeton L, Taylor C, Drummond C, Strange J. “The Effect of Cash and Other Financial Inducements on the Response Rate of General Practitioners in a National Postal Survey”. British Journal of General Practice. 1997;47:87–90. [PMC free article] [PubMed] [Google Scholar]
- Ellis RA, Endo CM, Armer JM. “The Use of Potential Nonrespondents for Studying Nonresponse Bias”. Pacific Sociological Review. 1970;13:103–9. [Google Scholar]
- Filion FL. “Exploring and Correcting for Nonresponse Bias Using Follow-ups of Nonrespondents”. Pacific Sociological Review. 1976;19:401–8. [Google Scholar]
- Fitzgerald R, Fuller L. “I Hear You Knocking But You Can't Come In: The Effects of Reluctant Respondents and Refusers on Sample Survey Estimates”. Sociological Methods and Research. 1982;11:3–32. [Google Scholar]
- Fowler FJ, Gallagher PM, Stringfellow VL, Zaslavsky AM, Thompson JW, Cleary PD. “Using Telephone Interviews to Reduce Nonresponse Bias to Mail Surveys of Health Plan Members”. Medical Care. 2002;40(3):190–200. doi: 10.1097/00005650-200203000-00003. [DOI] [PubMed] [Google Scholar]
- Gliksman L, Smythe C, Engs RC. “Responders vs. Non-Responders to a Mail Survey: Are They Different?”. The Canadian Journal of Program Evaluation. 1992;7:131–7. [Google Scholar]
- Groves RM. “Nonresponse Rates and Nonresponse Bias in Household Surveys”. Public Opinion Quarterly. 2006;70(5):646–75. [Google Scholar]
- Groves RM, Cialdini RB, Couper MP. “Understanding the Decision to Participate in a Survey”. Public Opinion Quarterly. 1992;56:475–95. [Google Scholar]
- Groves RM, Peytcheva E. “The Impact of Nonresponse Rates on Nonresponse Bias: A Meta-analysis”. Public Opinion Quarterly. 2008;72(2):167–89. [Google Scholar]
- Groves RM, Presser S, Dipko S. “The Role of Topic Interest in Survey Participation Decisions”. Public Opinion Quarterly. 2000;68:2–31. [Google Scholar]
- Groves RM, Singer E, Corning A. “Leverage-Saliency Theory of Survey Participation: Description and an Illustration”. Public Opinion Quarterly. 2000;64:299–308. doi: 10.1086/317990. [DOI] [PubMed] [Google Scholar]
- Halpern SD, Ubel PA, Berlin JA, Asch DA. “Randomized Trial of 5 Dollars versus 10 Dollars Monetary Incentives, Envelope Size, and Candy to Increase Physician Response Rates to Mailed Questionnaires”. Medical Care. 2002;40(9):834–9. doi: 10.1097/00005650-200209000-00012. [DOI] [PubMed] [Google Scholar]
- Halpern SD, Kohn R, Dornbrand-Lo A, Metkus T, Asch DA, Volpp KG. “Lottery-based versus Fixed Incentives to Increase Clinicians' Response to Surveys”. Health Services Research. 2011;46(5):1663–74. doi: 10.1111/j.1475-6773.2011.01264.x. [DOI] [PMC free article] [PubMed] [Google Scholar]
- Kaner EFS, Haighton CA, Mcavoy BR. “‘So Much Post, So Busy with Practice—So, No Time!’: A Telephone Survey of General Practitioners Reasons for Not Participating in Postal Questionnaire Surveys”. British Journal of General Practice. 1998;48:1067–9. [PMC free article] [PubMed] [Google Scholar]
- Lillard LA, Farmer MM. “Linking Medicare and National Survey Data”. Annuals of Internal Medicine. 1997;127:691–5. doi: 10.7326/0003-4819-127-8_part_2-199710151-00051. [DOI] [PubMed] [Google Scholar]
- Lin I, Schaeffer N. “Using Survey Participants to Estimate the Impact of Non-participation”. Public Opinion Quarterly. 1995;59:236–58. [Google Scholar]
- Little RJ, Rubin DB. Statistical Analysis with Missing Data. New York: John Wiley and Sons; 2002. [Google Scholar]
- Ma C, Samuels ME, Alexander JW. “Factors that Influence Nurses' Job Satisfaction”. Journal of Nursing Administration. 2003;33(5):293–9. doi: 10.1097/00005110-200305000-00005. [DOI] [PubMed] [Google Scholar]
- Mazor KM, Clauser BE, Field T, Yood RA, Gurwitz JH. “A Demonstration of the Impact of Response Bias on the Results of Patient Satisfaction Surveys”. Health Services Research. 2002;37(5):1403–17. doi: 10.1111/1475-6773.11194. [DOI] [PMC free article] [PubMed] [Google Scholar]
- McLeod TG, Costello BA, Colligan RC, Dierkhising RA, Beebe TJ, Offord KP, Locke GR., III “Personality Characteristics of Health Care Satisfaction Survey Non-Respondents”. International Journal of Health Care Quality Assurance. 2009;22(2):145–56. doi: 10.1108/09526860910944638. [DOI] [PubMed] [Google Scholar]
- Nicholls K, Chapman K, Shaw T, Perkins A, Sullivan MM, Crutchfield S, Reed E. “Enhancing Response Rates in Physician Surveys: The Limited Utility of Electronic Options”. Health Services Research. 2011;46(5):1675–82. doi: 10.1111/j.1475-6773.2011.01261.x. [DOI] [PMC free article] [PubMed] [Google Scholar]
- Peiperl MA, Baruch Y. “Models of Careers: Back to Square Zero”. Organizational Dynamics. 1997;35(4):7–22. [Google Scholar]
- Rivara FP, Koepsell TD, Wang J, Durbin D, Jaffe KM, Vavilala M, Dorsch A, Roper-Caldback M, Houseknecht E, Temkin N. “Comparison of Telephone with World Wide Web-Based Responses by Parents and Teens to a Follow-Up Survey after Injury”. Health Services Research. 2011;46(3):964–81. doi: 10.1111/j.1475-6773.2010.01236.x. [DOI] [PMC free article] [PubMed] [Google Scholar]
- Rogelberg SG, Stanton JM. “Introduction: Understanding and Dealing with Survey Nonresponse”. Organizational Research Methods. 2007;10(2):195–209. [Google Scholar]
- Rogelberg SG, Luong A, Sederburg ME, Cristol DS. “Employee Attitude Surveys: Examining the Attitudes of Noncompliant Employees”. Journal of Applied Psychology. 2000;85:284–93. doi: 10.1037/0021-9010.85.2.284. [DOI] [PubMed] [Google Scholar]
- Rogelberg SG, Fisher GG, Maynard D, Hakel MD, Horvath M. “Attitudes toward Surveys: Development of a Measure and Its Relationship to Respondent Behavior”. Organizational Research Methods. 2001;4:3–25. [Google Scholar]
- Rogelberg SG, Conway JM, Sederburg ME, Spizmuller C, Aziz S, Knight WE. “Profiling Active and Passive Nonrespondents to an Organizational Survey”. Journal of Applied Psychology. 2003;88(6):1104–14. doi: 10.1037/0021-9010.88.6.1104. [DOI] [PubMed] [Google Scholar]
- Roth PL. “Missing Data: A Conceptual Review for Applied Psychologists”. Personnel Psychology. 1994;47:537–60. [Google Scholar]
- Sitzia J, Wood N. “Response Rate in Patient Satisfaction Research: An Analysis of 210 Published Studies”. International Journal for Quality in Health Care. 1998;10(4):311–7. doi: 10.1093/intqhc/10.4.311. [DOI] [PubMed] [Google Scholar]
- Sosdian CP, Sharp LM. “Nonresponse in Mail Surveys: Access Failure or Response Resistance”. Public Opinion Quarterly. 1980;44:396–402. [Google Scholar]
- Taris TW, Schreurs PJG. “How May Nonresponse Affect Findings in Organizational Surveys? The Tendency-to-the-Positive Effect”. International Journal of Stress Management. 2007;14(3):249–59. [Google Scholar]
- Willis G, DeMaio T, Harris-Kojetin B. “Is the Bandwagon Headed to the Methodological Promised Land? Evaluation of the Validity of Cognitive Interviewing Techniques”. In: Sirken M, Herrmann D, Schechter S, Schwarz N, Tanur J, Tourangeau R, editors. Cognition and Survey Research. Wiley: New York; 1999. pp. 133–43. [Google Scholar]
- Yessis J, Rathert C. “Initial versus Prompted Responders to Patient Satisfaction Surveys: Implications for Interpretation and Patient Feedback”. Journal of Applied Management and Entrepreneurship. 2006;11(4):49–64. [Google Scholar]
Associated Data
This section collects any data citations, data availability statements, or supplementary materials included in this article.