Abstract
Objective
To analyze and display facial movement data from noncleft subjects and from patients with cleft lip and palate by using a new dynamic approach. The hypothesis was that there are differences in facial movement between the patients with cleft lip and palate and the noncleft subjects.
Setting
Subjects were recruited from the University of North Carolina School of Dentistry Orthodontic and Craniofacial Clinics.
Patients, Participants
Sixteen patients with cleft lip and palate and eight noncleft “control” subjects.
Interventions
Video recordings and measurements in three dimensions of facial movement.
Main Outcome Measures
Principal component (PC) scores for each of six animations or movements and dynamic modeling of mean animations.
Statistics
Multivariate statistics were used to test for significant differences in the PC mean scores between the patient groups and the noncleft groups.
Results
No statistically significant differences were found in PC mean scores between the patient groups and the noncleft groups; however, the variability of the effect of clefting on the soft tissues during animation was noted when the noncleft data were used to establish a “normal” scale of movement. Compensatory movements were seen in some of the patients with cleft lip and palate, and the compensation was not unidirectional.
Conclusion
Measures of mean movement differences as summarized by PC scores between patients with cleft lip and palate and noncleft subjects may be misleading because of extreme variations about the mean in the patient group that may neutralize group differences. It may be more appropriate to compare patients to a noncleft normal scale of movement.
Keywords: circumoral movement, cleft impairment, dynamic analysis
For patients with a cleft of the lip, surgical operations for both primary and secondary lip (revision) surgery aim to restore continuity and function to the orbicularis oris and surrounding muscles and to minimize postsurgical scarring. The specific type of surgical repair that may be selected is based on the surgeon’s training and experience, his or her subjective evaluation of the patient’s underlying muscle problem, and, in the case of a lip revision, the location and nature of scarring from previous surgery. Past reports have demonstrated that some patients with a cleft of the lip have measurable impairments in circumoral displacement (Trotman et al., 2000) and obvious distortions in the static and dynamic form of the nasolabial region (Ritter et al., 2002; Trotman et al., 2003). Although these patients may have restrictions in displacement of the upper lip, they also may display enhanced or compensatory movements in other facial regions such as the lower lip and cheeks (Trotman et al., 2000). As a result, these distortions and impairments in movement affect external perceptions of facial aesthetics during animated behaviors such as smiling and eating, and they also have important implications for function during these activities. An objective measure of the magnitude and direction of impaired movements would be a valuable aid to the surgeon so that he or she could modify or tailor a particular surgical approach to the patient’s needs and minimize or eliminate any impairment.
Our past studies and analyses of facial movement were based mainly on a measurement of maximum displacement of discrete facial landmarks (Trotman et al., 1998, 2000) and on the relative changes of the distances between pairs of landmarks (Trotman and Faraway, 1998). The results of both analyses were displayed graphically; however, the static nature of these displays limited their application for the study of a dynamic process such as facial movement. Consequently, a new dynamic analysis for facial movement has been developed (Faraway, 2004) and applied (Trotman et al., 2003). In this particular study, the specific aim was to statistically analyze and display facial movement data from noncleft subjects and from patients with cleft lip and palate by using this new dynamic approach. The hypothesis was that there are differences in facial movement between the patients with cleft lip and palate and the noncleft subjects.
Materials and Methods
The sample consisted of 8 noncleft “control” subjects and 16 patients with cleft lip and palate. The mean age of the control subjects was 10.5 years (standard deviation [SD] = 3.5 years) and of the patients was 13.4 years (SD = 3.7 years). Four boys and four girls were in the control group, and eight boys and eight girls were in the patient group. Twelve patients had a unilateral cleft lip and four had a bilateral cleft lip. All subjects were recruited from patients attending the University of North Carolina School of Dentistry Orthodontic and Craniofacial Clinics and were part of a larger clinical trial funded by the National Institutes for Dental and Craniofacial Research.
The inclusion criteria for all the subjects were as follows: subject interest and parent willingness to participate in the study; an ability to comprehend verbal instructions; an age range of 5 to 21 years; and, specifically for the patients, a previously repaired complete unilateral or bilateral cleft lip with or without a cleft of the palate. Subjects were excluded if they had previous orthognathic or facial soft tissue surgery; a medical history of diabetes, collagen vascular disease, or systemic neurological impairment; mental or hearing impairment to the extent that comprehension or ability to perform tests was hampered; and, specifically for the patients, a lip-revision surgery within the past 2 years. Approval for the study was obtained from the Institutional Review Board at the University of North Carolina. Informed consent was obtained from a parent or legal guardian, and assent was obtained from each subject before data collection.
Recording Circumoral Movements
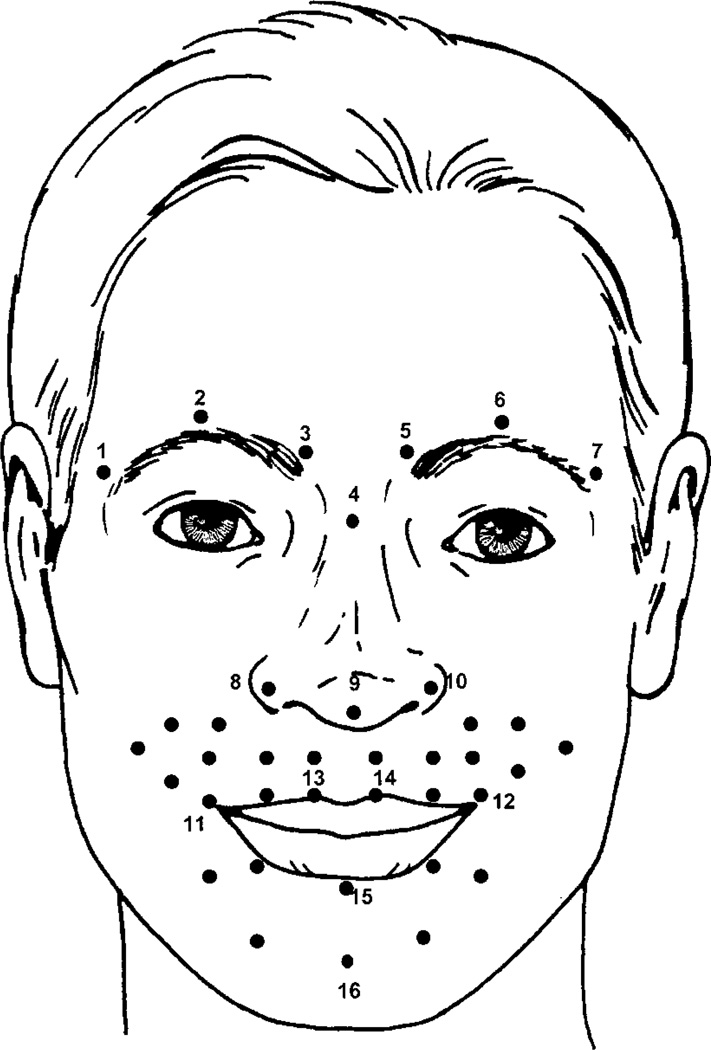
A video-based tracking system (Motion Analysis, Motion Analysis Corp., Santa Rosa, CA) was used to measure the circumoral movements of each subject. This system tracks retro-reflective markers secured to specific facial landmarks, and has been described extensively in previous publications (Trotman et al., 1998, 2000; Weeden et al., 2001). Thirty-eight hemispherical retro-reflective markers, each with a diameter of 2 mm, were attached by means of eyelash adhesive to specific sites on the facial skin of each subject (Fig. 1). Each subject then was positioned within the tracking area and instructed to make five maximum facial animations from rest: smile, cheek puff, grimace, lip purse, and mouth opening. The subjects also performed a natural smile that was elicited in response to the research assistant’s smile. For all animations except the natural smile, the three-dimensional movement of each marker was captured in real time by the tracking system at a rate of 60 frames per second for 3 seconds; the natural smile was captured for 5 seconds. The different animations served to represent the range of movements expected in the lower facial regions during expressive behavior. Before data collection, all animations were practiced with each subject. Then, five trials of each animation were recorded for each subject at the same sitting.
FIGURE 1.
A grid of 38 landmarks on the facial and circumoral regions was established relative to the following landmark locations. 1 and 7, right and left lateralciliary points located above most lateral aspect of eyebrows; 2 and 6, right and left superciliary points located above most superior aspect of eyebrows; 3 and 5, right and left interciliary points located above medial aspect of eyebrows; 4, midnose point located on midline of nasal bridge in line with medial canthi; 8 and 10, right and left lateral alar points located on lateral alar rims; 9, nasal tip point located on the tip of the nose in the facial midline; 11 and 12, right and left commissure points located on the right and left commissures; 13 and 14, right and left upper-lip points located on peaks of Cupid’s bow; 15, mid–lower-lip point; and 16, midchin point located 2 cm below point 15.
Data Processing of Dynamic Movements
To demonstrate the facial movements, a software viewer was constructed to display the dynamic movements (see Appendix A). This viewer has six Exhibits in which the face can be viewed from any angle. In the examples in Exhibit 1—F1, differences due to head motion and timing of movement by the subjects are demonstrated. (Please see Appendix A for a description of how to obtain and operate the viewing software. It is important to view the motion from the side as well as from the front.) Consider the smile movement of two subjects. Three important comparisons of these smiles are displayed: (1) Because head motion was not restricted, the initial position of the head during a smile was not aligned the same for a given subject or among subjects; (2) the smiles occurred over different lengths of time during the 3-second period, that is, one subject completed the first smile movement quickly within 3 seconds whereas the other subject used the entire time; and (3) a small amount of noise due to measurement error was visible as the movements were made. These errors also can be seen on viewing the other movements in Exhibit 1—F1. To model the average facial movements and conduct further analyses of these data, these errors were removed as explained below.
Shape Description
From a statistical perspective, the configuration of the 38 landmarks on the facial soft tissue constituted a shape (Bookstein, 1991; Dryden and Mardia, 1998), and this static facial shape differed among subjects in the study (e.g., prognathic versus retrusive facial shapes or profiles of subjects). The focus of this study, however, was on how the facial soft tissue shape changed during facial movements or animations and not on the static facial shape. Thus, the intent was to measure movement independent of the static shape. Therefore, analytical techniques were developed to model these movements.
These techniques were based on the change in distances between pairs of facial landmarks (Trotman and Faraway, 1998, 2004). Let dij(t) be the distance between landmarks i and j at time t. Then, let rij(t) = (dij(t)/(dij(0))) − 1 represent the relative change in the distance from rest. This measure has several desirable properties: (1) It is invariant to motion of the head; (2) because of the relative scaling, it is approximately invariant to small variations in the placement of markers on facial landmarks; and (3) it is not dependent on the subjects’ facial shape. For example, consider the distance between the commissures (e.g., Fig. 1; landmarks 11 and 12). This distance will be larger in some individuals because they have wider mouths. However, the focus is not on this distance “at rest” but on how it changes during movement (e.g., a smile). By scaling to the initial at-rest distance, much of the difference in shape is removed.
The Euclidean Distance Matrix Analysis, a method of analysis of static shape differences based on all pairwise distances, is described in Lele and Richtsmeier (2000). However, for the analysis of dynamic shapes, the average of several distance matrices is not an exact valid distance matrix, but classic multidimensional scaling was used to find a distance matrix close to this average. For these data, when averaging across time points, it was important to ensure that successive frames were continuously aligned. This alignment was achieved by rotating the frames so that the nose was upright and forward.
Registration of Animations and Standardization in Time
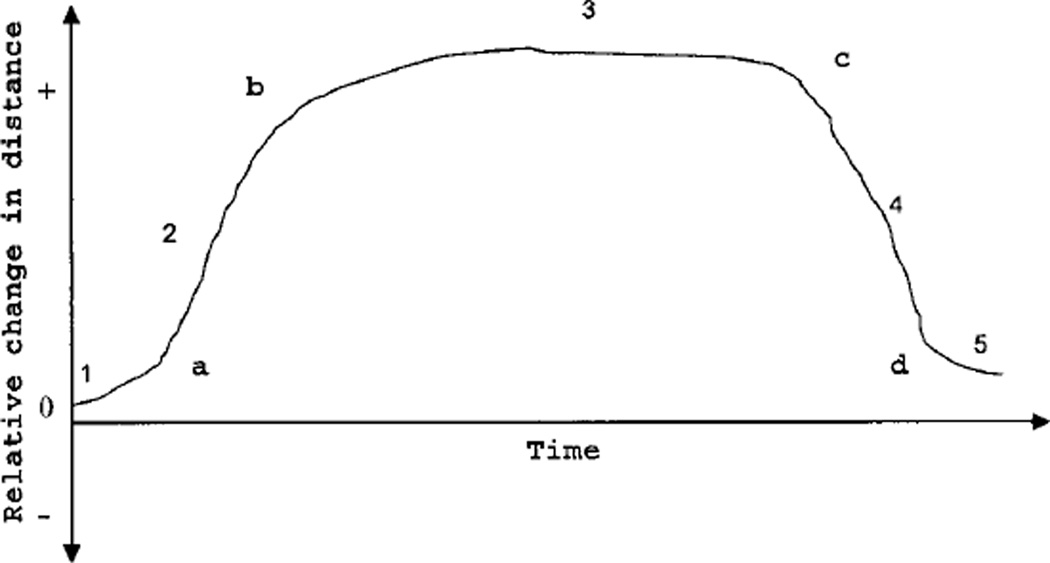
The subjects were instructed to perform a particular movement from a rest position. For example, for the smile movement, the movement started from the rest position, moved to a maximum position of the smile, and then relaxed to a rest position. Each movement was completed within 3 seconds except for the natural smile, which was tracked for 5 seconds. Five phases to the movement were recognized (Fig. 2): (1) at-rest phase, (2) movement phase to the maximum position, (3) holding phase at maximum position, (4) relaxation movement phase from the maximum position, and (5) at-rest phase.
FIGURE 2.
Relative increase in a landmark-pair distance during a smile animation. Five phases of movement: 1 = at-rest phase, 2 = movement phase to the maximum position, 3 = holding phase at maximum position, 4 = relaxation movement phase from the maximum position, and 5 = at-rest phase. Transition times are represented by points a, b, c, and d.
These five phases resulted in four transition times (a to d) that were identified in each individual movement (Fig. 2). The movements then were rescaled so that the transition points for repeated movements occurred at the same corresponding time. These rescaled movements then were averaged.
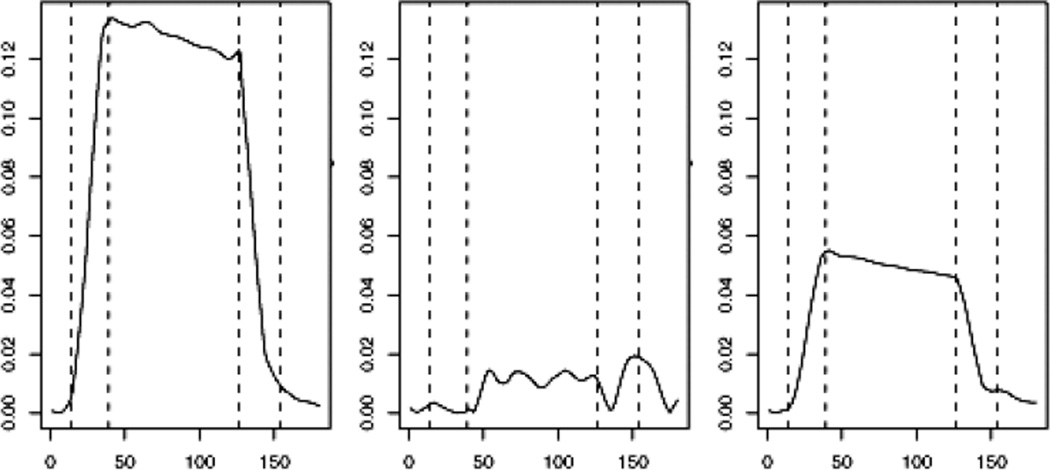
These issues are illustrated in Figure 3. Information from a smile is depicted. The first panel in Figure 3 shows a smoothed r13,14(t), which represents the distance between landmarks 13 and 14 on the upper lip. The five phases of this distance during the movement are clearly identifiable, though the transitions are somewhat imprecise. The center panel in Figure 3 shows r4,5(t), which represents the distance between landmarks 4 and 5 above the eye. In this case the phases are not identifiable. As might be expected, this distance does not show much movement during a smile because most of this movement is confined to the lower part of the face. It is clear that to choose the transitions, the plot in the first panel would be preferred.
FIGURE 3.
Selected relative change from rest for a smile. Left: 13 to 14 (upper lip). Center: 4 to 5 (eyebrow). Right: average of pairwise distances. Transitions selected are shown by the broken lines.
Unfortunately, these patterns differ among animations and among individuals, and a pairwise distance that is appropriate to select the transitions for one movement might be different for another movement. Therefore, a small number of pairwise distances that exemplify the movement for the particular animation were identified, and the average rij(t) was calculated as shown in the right panel of Figure 3. These averages were used to select the transitions that were identified manually by one investigator (J.J.F.). Also, to avoid bias in transition selections, the investigator was blinded to the data: all subjects were coded so that identification by group, that is, cleft or noncleft, was not possible. Manual selection also allowed the detection of aberrant measures that then were corrected or excluded.
B-Spline Representation
Standard cubic B-splines were used to model the curves shown in Figure 3. The angle curves were represented as linear combinations of the following basis functions, Bj(t) for j = 1,…,m. The ith curve ri(t) is represented as
where the coefficients Rij are found by minimizing a least squares criterion
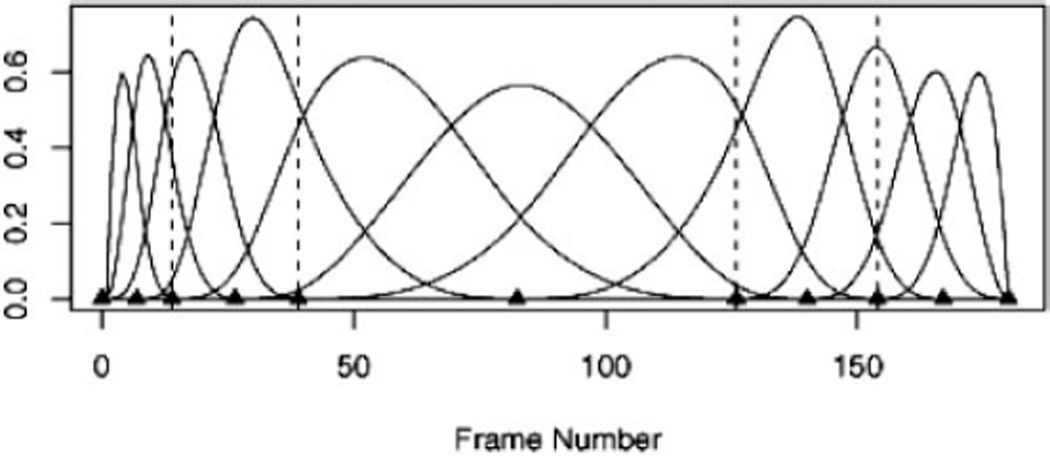
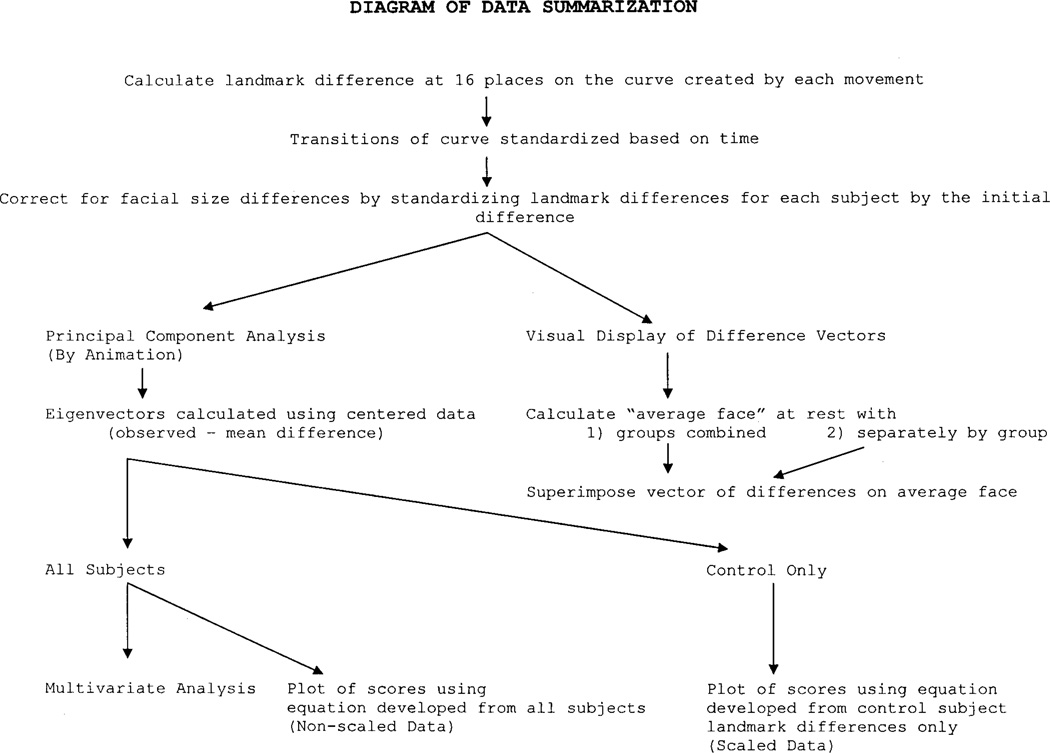
The particular B-spline basis was determined by the choice of knot location. The knots were evenly spaced within the five phases described above. Furthermore, because it is known that ri(0) = ri(end) = 0, this restriction could be imposed directly by omitting the first and last B-spline basis functions. The B-spline basis functions with just one interior knot for each phase that corresponded to Figure 3 are shown in Figure 4. Because the transition points differed among the movements, the placement of the knots also were different; however, the statistics Rij on the coefficients were compared and computed with the assurance that Ri1j and Ri2j represented the same part of the movement. The positions of the knots ensured appropriate registrations of the curves. An m of 16 was chosen, which allowed for six knots at the endpoints and transitions and two interior knots in the phases. Figure 5 provides a summary of the steps in both the numerical and the graphical analyses.
FIGURE 4.
B-spline basis functions corresponding to transitions in Figure 3. Knot locations are shown on the horizontal axis. Note the zero values at the two endpoints.
FIGURE 5.
Schematic providing a flow chart and summary of the steps in both the numerical and the graphical analyses.
Statistics
For convenience, the matrix Rij was unrolled into a vector Rk where k = 1,…,m(3n − 6) represented one complete movement. For an m = 16 and n = 38, the result is a vector of length 11,248. Also, the distance between the landmarks at rest, dij(0), was unrolled into a vector dk where k = 1,…,(3n − 6) represented the face at rest. Then, to reconstruct the whole movement, dij(t) = dij(0)(1 + Rij(t)) was computed.
Means
Means for each of the six movements were calculated separately for the patient groups and noncleft control groups. For example, for each group, the average smile was calculated on the average face of all the subjects within the group by averaging Rk and dk over all the smiles. To calculate this smile movement in addition to the other movements, the timing of the four transitions had to be specified. The means of the transitions were calculated; however, for ease of comparison between different displays, these transitions were set at t = 1/6, 2/6, 4/6, and 5/6. An example of this average smile, as well as the other movements, is shown in the Exhibit 2—F2 (Appendix A). This Exhibit shows a comparison of the average movements of noncleft subjects on the average of the noncleft group’s own face with the average movements of the patients on the average of the patient group’s own face. Clear differences are seen in the sizes of the two average faces and in the movement; however, it is unknown whether these differences are because of a different average static facial soft tissue size and shape between the groups (cleft patients mean age = 10 years versus noncleft subjects mean age = 13 years) or because of differences in the particular movement.
In the Exhibit 3—F3 (Appendix A), a comparison was made of the average movements of the noncleft subjects superimposed on the average face of both groups with the average movements of the patients superimposed on the same average face of both groups. The average face calculated from all the participants was arbitrarily chosen as a “standard face.” Because the movements were superimposed on the same “standard,” the differences observed are due to just the particular movement. Thus, this Exhibit demonstrated the movements once the faces were scaled to the same size. The superimpositions demonstrated that although some minor average differences in movement between the groups can be detected for certain animations in Exhibit 3, the large differences in movement that were noted in Exhibit 2 now appeared less substantial.
Variance
Substantial natural variation exists in facial movement. The nature of this variation over all the subjects can be described with a principal components (PCs) analysis on the Rk. This study has 11,248 variables, but if any one movement is considered (e.g., the smile) and counted separately, then there are only 120 cases (24 subjects and five repetitions per subject). Nevertheless, the PCs can be calculated. The percentage of variation explained by the first five PC scores for the smile are 30.14%, 10.31%, 5.78%, 5.34%, and 4.49% (Table 1), and is calculated where si and vi are the ith eigenvalue and eigenvector, respectively. The direction of movement summarized by each of the first three PCs for each movement (e.g., smile, lip purse, and so on) is shown in Exhibits 4—F4, 5— F5, and 6—F6 of Appendix A, respectively. These directions are displayed as “the average movement plus two standard deviations” superimposed on the average face compared with “the average movement minus two standard deviations” also superimposed on the average face.
TABLE 1.
Percentage (%) Variation in Movement Explained by Principal Component 1 to 5
| Percentage (%) explained variance |
|||||
|---|---|---|---|---|---|
| Animations | PC1 | PC2 | PC3 | PC4 | PC5 |
| Smile | 30.14 | 10.31 | 5.78 | 5.34 | 4.49 |
| Lip purse | 23.85 | 16.96 | 7.10 | 5.02 | 4.83 |
| Cheek puff | 15.53 | 12.09 | 9.72 | 8.35 | 5.89 |
| Grimace | 26.04 | 12.70 | 9.00 | 5.44 | 3.99 |
| Mouth opening | 39.07 | 13.32 | 7.77 | 4.89 | 3.67 |
| Natural smile | 34.67 | 16.25 | 12.19 | 4.60 | 3.21 |
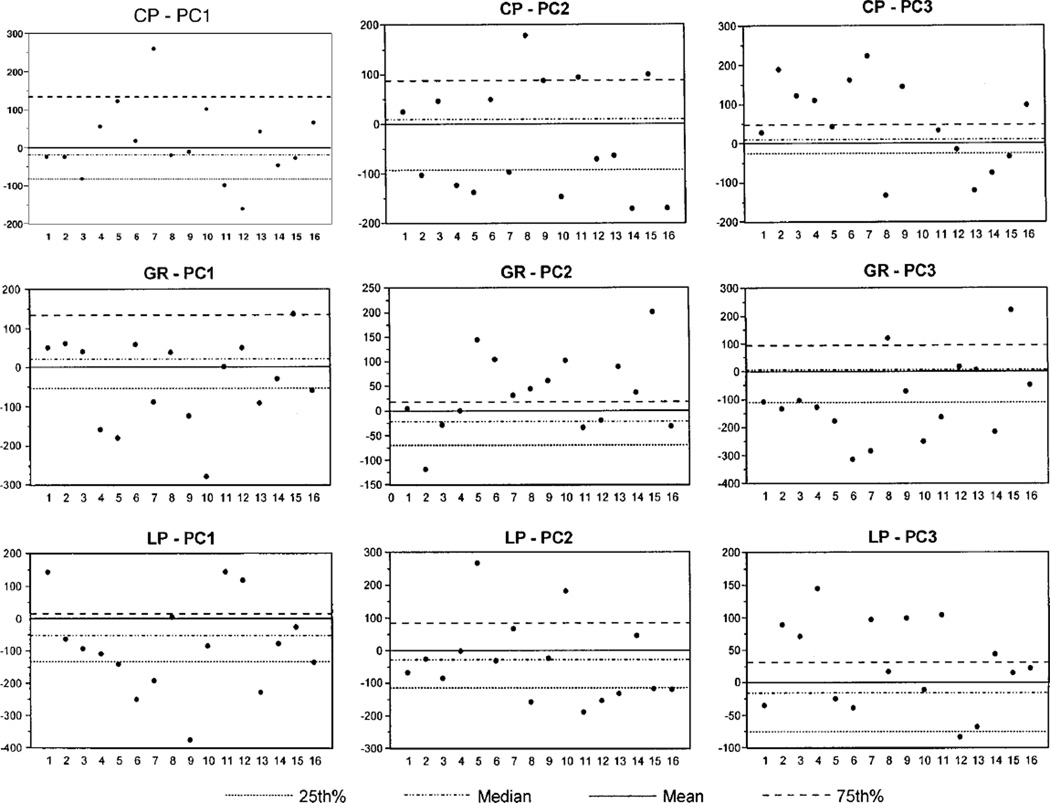
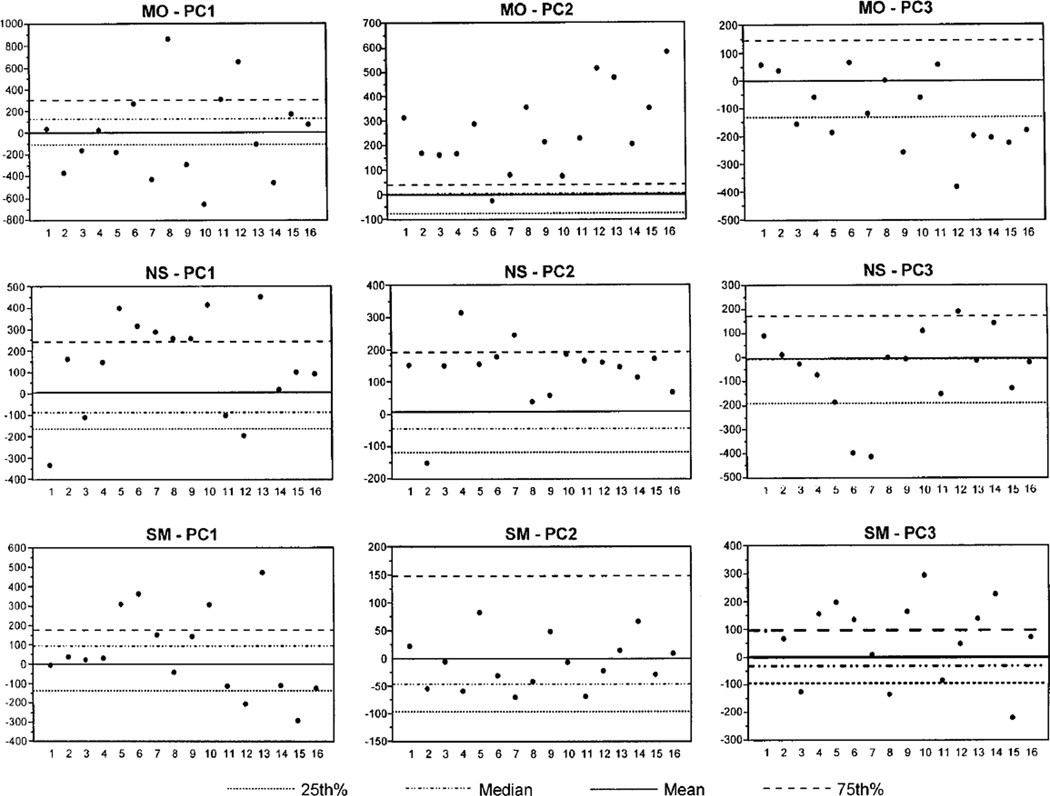
In Figure 6, the quartiles and mean values for the noncleft groups PC1, PC2, and PC3 are plotted for each animation. Then, mean PC values for each of the 16 cleft patients are plotted relative to this “descriptive statistic” scale of the noncleft group. To illustrate how the PCs of a cleft patient can indicate a potential problem, a dynamic modeling of a cleft patient (patient 7) relative to the averaged noncleft group animation is shown in the second viewer (see Exhibit, Appendix B). This viewer has seven Exhibits. (Please see Appendix B for a description of how to obtain and operate the viewing software. It is important to view the motion from the side as well as from the front.)
FIGURE 6.
Plots of PC1, PC2, and PC3. For each animation, the baseline scale and quartiles were based on the noncleft PC scores. Each patient’s scores, numbered 1 to 16, were then superimposed on the noncleft scale for comparison. CP = cheek puff; GR = grimace; LP = lip purse; MO = mouth opening; NS = natural smile; SM = smile.
Inference
The standard techniques of multivariate analysis (Johnson and Wichern, 1992) could have been applied to this analysis. However, because of the large dimension (11,248 in our example), the tests would be overpowered and unimportant differences between the groups would be detected. Instead, the inferences were performed on the first few PC scores. A linear mixed-effects model for the jth replicate of subject i was fitted:
where k = 1 or 2 depending on whether the group was composed of patients or control subjects. Also, γi was the random subject effect with variance σ2γ, whereas within-subject variation εij had variance σ2ε. Within-subject consistency in movement was assessed by the intraclass correlation coefficients (ICCs) for the first three PC scores (Table 2): ICC = (σ2 among subjects)/(σ2 among subjects + σ2 error). To assess the difference in consistency of movement between the patient groups and the noncleft groups for each animation, the following ratios were calculated for PC1, PC2, and PC3: the ratio of the within-subject PC variances of the patient group relative to the control group (Table 2), and the ratio of the among-subject PC variances of the patient group relative to the control group (Table 3).
TABLE 2.
Ratio of the Patient Group to the Control Group Within-Subject Variance for Each Animation and for Each of the First Three Principal Component (PC) Scores (PC1, PC2, PC3)
| Variance ratio (patient : control) |
|||
|---|---|---|---|
| Animations | PC1 | PC2 | PC3 |
| Smile | 0.91 | 0.85 | 0.70 |
| Lip purse | 0.76 | 0.58 | 1.00 |
| Cheek puff | 1.19 | 0.92 | 0.73 |
| Grimace | 1.48 | 1.33 | 0.92 |
| Mouth opening | 0.87 | 0.93 | 1.15 |
| Natural smile | 0.79 | 0.75 | 0.70 |
TABLE 3.
Means and SDs of the First Three Principal Component (PC) Score for Each Animation and Each Group of Subjects (Cleft and Noncleft)
| Group PCs |
|||||
|---|---|---|---|---|---|
| Cleft (n = 16) |
Noncleft (n = 8) |
Variance ratio (cleft : noncleft) |
|||
| Animations | Mean | SD | Mean | SD | |
| Smile | |||||
| PC1 | 25.03 | 333.75 | −50.06 | 177.40 | 3.54 |
| PC2 | 13.20 | 170.88 | −26.41 | 86.76 | 3.88 |
| PC3 | 2.91 | 82.35 | −5.83 | 162.54 | 0.26 |
| Lip purse | |||||
| PC1 | 24.66 | 180.73 | −47.14 | 218.61 | 0.68 |
| PC2 | 28.38 | 126.54 | −57.15 | 162.37 | 0.61 |
| PC3 | −1.31 | 114.97 | 6.61 | 45.60 | 6.36 |
| Cheek puff | |||||
| PC1 | −24.73 | 175.02 | 49.43 | 87.46 | 4.01 |
| PC2 | 19.36 | 155.51 | −42.40 | 51.04 | 9.28 |
| PC3 | 10.60 | 141.17 | −14.00 | 83.51 | 2.83 |
| Grimace | |||||
| PC1 | 73.63 | 250.08 | −116.19 | 90.17 | 7.69 |
| PC2 | −4.17 | 167.74 | 12.50 | 118.88 | 1.99 |
| PC3 | 23.62 | 155.72 | −40.58 | 87.00 | 3.20 |
| Mouth opening | |||||
| PC1 | −16.70 | 443.67 | 28.34 | 477.38 | 0.86 |
| PC2 | 95.80 | 228.15 | −201.41 | 241.71 | 0.89 |
| PC3 | −21.40 | 146.23 | 42.77 | 192.80 | 0.58 |
| Natural smile | |||||
| PC1 | 55.42 | 260.83 | −102.23 | 201.35 | 1.68 |
| PC2 | −30.84 | 175.90 | 54.48 | 184.22 | 0.91 |
| PC3 | −33.15 | 121.43 | 61.45 | 196.37 | 0.38 |
Results
Table 1 gives the percentage of the variation explained by the first five PCs. It can be seen that, apart from the natural smile, the first two PCs explained most of the variation. Given that the motion is described by a vector of dimension 11,248, it is remarkable that approximately 55% of the variation is explained by just 5 PCs. These results are very good and far better than expected given the high dimensionality of the movements. The ICCs provided in Table 4 show that, overall, the variability among subjects was greater than the variability observed when a subject repeated an animation. In general, the ICCs for the first PC indicated very good to excellent agreement, and the ICCs of the first PC were better than the ICCs for the second or third PCs. The consistency in movement was different for the various animations. The grimace appeared to have the best consistency in movement.
TABLE 4.
Intraclass Correlation Coefficients (ICCs) for the Principal Component 1, 2, and 3 of Each Movement
| ICCs |
|||
|---|---|---|---|
| Animations | PC1 | PC2 | PC3 |
| Smile | 0.87 | 0.58 | 0.53 |
| Lip purse | 0.71 | 0.38 | 0.61 |
| Cheek puff | 0.68 | 0.57 | 0.58 |
| Grimace | 0.82 | 0.82 | 0.84 |
| Mouth opening | 0.76 | 0.77 | 0.50 |
| Natural smile | 0.48 | 0.56 | 0.49 |
Table 2 gives the results for the ratio of the within-subject variances (patient:noncleft). Values greater than 1 indicated greater variability for the repeated animations in the patient (cleft group) PC scores. The ratio of the variances in movement show that, generally, the patients with cleft lip and palate were less variable when they repeated their movements than were the noncleft subjects with the exception of a few movements such as the grimace.
The results of the linear mixed-effects model for group differences in movement showed that only the second PC for mouth opening demonstrated a significant (p = .007) difference. The means of the first PCs (Table 3) suggested that, on average, the axial directions of the animations summarized by the PCs are different for the cleft and noncleft groups, but the dispersion of PC values among subjects for each group, illustrated by the SDs, is quite large. The ratio of the variances (Table 4) shows that the variability among the cleft subjects was greater than the variability in the noncleft group for all the animations except lip purse and mouth opening.
Discussion
In this study, facial movement comparisons were modeled for visual display and statistical analysis. The specific mean movements were isolated and superimposed on a standard face to eliminate the effects of different facial shapes and sizes. This superimposition of movements can be made on any face, including an individual’s own face. Once this adjustment was made, virtually no differences were evident in facial movement between the patients with cleft lip and palate and the noncleft subjects according to the differences in mean PC scores. A nonsignificant difference in group means, however, can be caused by any one of the following: (1) a true lack of difference in mean values, (2) a mean difference that is not detectable because of the variability present, or (3) a lack of difference in mean values because the two groups have different distributions (bimodal versus unimodal) of the values.
Therefore, to further investigate this possibility, plots of each patient’s PC scores relative to the scores of the noncleft subjects (Fig. 6) were generated for each animation. The baseline scale and the quartiles (25%, 50%, 75%, as well as the mean) were based on the noncleft PC scores. Each patient’s scores, numbered 1 to 16, then were superimposed on the noncleft scale for comparison. The assumption was made a priori that the noncleft subjects would have normal movements. To demonstrate the findings with this approach, patient 7 was chosen. Close examination of the plots showed that for this patient, the PC scores were either close to or outside the lower 25% and upper 75% percentiles of the noncleft subjects for the cheek puff, grimace, lip purse, mouth opening, and natural-smile animations. For this illustration, PC scores that fall above the upper 75% percentile or below the lower 25% percentile will be an indication of impaired movement.
In Exhibit 1 of Appendix B, the difference between the mean animations of patient 7 and the noncleft control animations are presented. Specific attention should be paid to the animations that demonstrate a difference in the plots of Figure 6. The function keys (F2 to F7) show the comparisons of the extremes of movement for each of the three PC scores. Thus, for the cheek-puff animation, the comparisons in F2 and F3 are equivalent to comparing the mean patient movement with the mean + 2 SDs (F2) and the mean patient movement with the mean − 2 SDs (F3) on the PC1 noncleft scale. The plots showed that the patient’s movement was closer to the noncleft mean + 2 SDs. On viewing the noncleft vector of movement for PC1 in F2 (key “a”), the vector of movement was mainly outward and horizontal. When the patient’s movements were superimposed (F2, key “c”), the patient showed much greater vertical movement of the upper and lower lips compared with the noncleft control vector.
The same process was repeated for PC2 (F4 and F5) and PC3 (F6 and F7) of the cheek-puff animation. In this instance, PC2 was very close to the lower 25% percentile. In the plots, that is close to the mean − 2 SDs (F5). The noncleft vector for PC2 can be described as an outward movement of the lips and cheeks with a rounding movement of the lips. When the patient’s movement was superimposed, a very marked vertical movement of the circumoral muscles occurred compared with the noncleft control vector. Finally, the patient’s PC3 scores were above the upper 75% percentile of the noncleft scale. On viewing the comparisons for PC3, the differences in movement were very similar to those for PC1 and PC2. These findings may imply a restricted antero-posterior movement of the upper lip in the patient and greater movement of the lower lip and chin regions to compensate for this upper-lip impairment.
The following is a summary of the findings for the grimace, lip-purse, and natural-smile animations by using the analytical approach described above. The grimace animation is designed to show movement of the nose and alar base region. Compared with the noncleft subjects, patient 7 showed a restricted vertical movement of the alar base and nasal tip; however, there was enhanced vertical movement of the other circumoral regions suggestive of compensatory-type movements. A lack of movement of the alar region is often observed in these patients. For the lip-purse movement, the comparisons show that the patient had more of a vertical movement of the upper and lower lips compared with the noncleft movement that was more horizontal. During the natural smile, the patient had a vertical and outward movement of the mouth corners and cheeks, with increased vertical movement of the lower lip and chin.
Given these considerations, the implication of the findings as they relate to patient 7 may be that the surgeon could design the lip-revision surgery to increase the antero-posterior vector of upper-lip movement. Freeing the labial tissues so that movement could occur in this direction may help limit compensatory movements of the other circumoral tissues. Compensatory mechanisms in patients with cleft lip and palate have been described for speech (Warren, 1986), and similar mechanisms may be operational for facial movements. Thus, it may be hypothesized that although facial movements are functionally adaptive and compensatory, these adaptations and compensations may serve to undermine rather than enhance function and aesthetics.
It should be noted that with this approach to analysis, each patient’s facial movement at a particular point in time could be quantified relative to a scale of normal movement; in this case, the scale was based on the movement of noncleft subjects. One time point for analysis would be before lip-revision surgery. Another time point would be after surgery when the patient’s movement would be measured again on the same scale to determine whether any meaningful or beneficial change occurred. Thus, the analysis is specific to the individual subject. Several important caveats to the present analytical approach should be noted. The first is that a greater number of noncleft control subjects are required for definitive results. Recall that the aim of this study was to demonstrate an approach for the analysis of impaired facial movement in patients with cleft lip and palate. The analyses presented here were based on a noncleft comparison group of only eight subjects and should not be used to draw definitive conclusions. Second, in this approach, there was an a priori assumption that the control group had normal facial movements—an assumption that has important implications for the statistical analyses. Third, it is important to emphasize that any approach to the analysis of facial movement it not a “stand alone” assessment but should be used in conjunction with the clinician’s subjective assessments of the patients’ movements.
Acknowledgments
This study was supported by grant DE13814–01A1 from the National Institute of Dental Research.
The authors wish to thank Ms. Lyna Rogers, Bethany Harris, and Debbie Price for their assistance in the preparation of this manuscript.
APPENDIX A
A viewer has been constructed to display facial movements at any angle. The viewer may be downloaded from:
| http://www.stat.lsa.umich.edu/~faraway/face/visclef.html |
| E-mail: faraway@umich.edu |
| The facial motion program has the following keyboard controls: |
| Function keys F1–F6 load Exhibit 1–6, respectively. |
| F1—Two raw data examples |
| F2—Average motion |
| F3—Average of noncleft motions compared with cleft motions both on the average face |
| F4—Motions above and below the average by two SDs in the direction of the first principal component weighted on the mouth markers |
| F5—Same as F4 but on principal component (PC) 2 |
| F6—Same as F4 but on principal component (PC) 3 |
| Arrow keys rotate the view |
| a—show first (or only) face moving |
| b—show second (if available) face moving |
| c—show both (if available) faces moving |
| m—toggle the animation between smile, cheek puff, lip purse, grimace, mouth open, and natural smile |
| shift < and shift >—increase/decrease face size |
| How fast the animation displays depends on your hardware and particularly whether a three-dimensional video card with OpenGL acceleration is installed. This is just a demonstration program. No warranty is given or implied. |
APPENDIX B
A viewer has been constructed to display the facial movements at any angle. The viewer may be downloaded from:
| http://www.stat.lsa.umich.edu/~faraway/face/visclef.html |
| E-mail: faraway@umich.edu |
| The facial motion program has the following keyboard controls: |
| Function keys F1–F7 load Exhibit 1–7, respectively. All show a comparison of the average motion of the patient with one of the following: |
| F1—control average |
| F2—control average + 2 SDs in direction of principal component (PC) 1 |
| F3—control average − 2 SDs in direction of PC1 |
| F4—control average + 2 SDs in direction of PC2 |
| F5—control average − 2 SDs in direction of PC2 |
| F6—control average + 2 SDs in direction of PC3 |
| F7—control average − 2 SDs in direction of PC3 |
| Arrow keys rotate the view |
| a—show control face moving |
| b—show patient face moving |
| c—show both faces moving |
| m—toggle the animation between smile, cheek puff, lip purse, grimace, mouth open, and natural smile |
| shift < and shift >—increase/decrease face size |
| How fast the animation displays depends on your hardware and particularly whether a three-dimensional video card with OpenGL acceleration is installed. This is just a demonstration program. No warranty is given or implied. |
Footnotes
This paper was presented at the 2004 American Cleft Palate–Craniofacial Association meeting in Chicago.
Contributor Information
Carroll-Ann Trotman, Department of Orthodontics, University of North Carolina at Chapel Hill, Chapel Hill, North Carolina..
Julian J. Faraway, Department of Statistics, University of Michigan, Ann Arbor, Michigan..
Ceib Phillips, Department of Orthodontics, University of North Carolina at Chapel Hill, Chapel Hill, North Carolina..
References
- Bookstein F. Morphometric Tools for Landmark Data: Geometry and Biology. Cambridge, UK: Cambridge University Press; 1991. [Google Scholar]
- Dryden I, Mardia K. Statistical Shape Analysis. Hoboken, NJ: J Wiley; 1998. [Google Scholar]
- Faraway JJ. Modeling continuous shape change for facial animation. Statistics and Computing. 2004;14:357–363. [Google Scholar]
- Johnson R, Wichern D. Applied Multivariate Statistical Analysis. 3rd ed. Upper Saddle River, NJ: Prentice Hall; 1992.. [Google Scholar]
- Lele S, Richtsmeier J. An Invariant Approach to Statistical Analysis of Shapes. Norwell, MA: Chapman & Hall; 2000. [Google Scholar]
- Ritter K, Trotman C-A, Phillips C. Validity of subjective evaluations for the assessment of lip scarring and impairment. Cleft Palate Craniofac J. 2002;39:587–596. doi: 10.1597/1545-1569_2002_039_0587_voseft_2.0.co_2. [DOI] [PubMed] [Google Scholar]
- Trotman C-A, Faraway JJ. Sensitivity of a method for the analysis of facial mobility. II. Interlandmark separation. Cleft Palate Craniofac J. 1998;35:142–153. doi: 10.1597/1545-1569_1998_035_0142_soamft_2.3.co_2. [DOI] [PubMed] [Google Scholar]
- Trotman C-A, Faraway JJ. Modeling facial movement: I. A dynamic analysis of differences based on skeletal characteristics. J Oral Maxillofac Surg. 2004;62:1372–1379. doi: 10.1016/j.joms.2004.03.014. [DOI] [PubMed] [Google Scholar]
- Trotman C-A, Faraway JJ, Essick GK. 3-D nasolabial displacement during movement in repaired cleft lip and palate patients. Plast Reconstr Surg. 2000;105:1273. doi: 10.1097/00006534-200004040-00003. [DOI] [PubMed] [Google Scholar]
- Trotman C-A, Faraway JJ, Silvester KT, Greenlee GM, Johnston LE., Jr Sensitivity of a method for the analysis of facial mobility. I. Vector of displacement. Cleft Palate Craniofac J. 1998;35:132–141. doi: 10.1597/1545-1569_1998_035_0132_soamft_2.3.co_2. [DOI] [PubMed] [Google Scholar]
- Trotman C-A, Phillips C, Faraway JJ, Ritter K. Association between subjective and objective measures of lip form and function: An exploratory analysis. Cleft Palate Craniofac J. 2003;40:241–248. doi: 10.1597/1545-1569_2003_040_0241_absaom_2.0.co_2. [DOI] [PubMed] [Google Scholar]
- Warren DW. Compensatory speech behaviors in individuals with cleft palate: a regulation/control phenomenon? Cleft Palate J. 1986;23:251–260. [PubMed] [Google Scholar]
- Weeden JC, Trotman C-A, Faraway JJ. Three-dimensional analysis of facial movement in normal adults: influence of sex and facial shape. Angle Orthod. 2001;71:132–140. doi: 10.1043/0003-3219(2001)071<0132:TDAOFM>2.0.CO;2. [DOI] [PubMed] [Google Scholar]


