

Abstract
We report findings on the current state of pain care in hospitals for end-of-life (EOL) patients using longitudinal data from eight diverse medical-surgical units located in 4 different Midwestern hospitals over 24 months. We identified 1,425 EOL care episodes, 596 (41.3%) of which had a pain diagnosis. The percentage of EOL patients with pain varied significantly across units (p<.001), and was even lower (27.7%) for those with “acute confusion.” Additionally, 30% of EOL patients had severe or significant pain at death or discharge to hospice and only 42.7% actually met the expected pain related outcome ratings. Pain often improved within 48 hours of admission (p<.005), the improvement, however, stagnated following this initial time period (p=.92). A sizable gap between pain science and clinical practice continues.
INTRODUCTION
A major finding of the 15-year-old landmark SUPPORT study,1 showed that pain was not controlled sufficiently for hospitalized patients. Subsequently, physicians have tested interventions to improve the quality of pain care for the dying, but success has been elusive.2 Although nurses play an important role in pain management of hospitalized patients, large studies are not yet available of nursing interventions to improve pain outcomes of dying hospitalized patients. One reason for this research gap is the lack of electronic health records that adequately represent nursing care of hospitalized patients with standardized language. Based on a decade of development and testing, the web-based HANDS system built with standardized terminologies, there now exists an important tool and method for advancing practice-based knowledge3 for end-of-life (EOL) care among hospitalized patients. In this paper, we report findings on the state of pain care from admission to the study unit until death or discharge to hospice within and across diverse medical or surgical units using data collected with HANDS during routine clinical care of hospitalized EOL patients during a three-year study conducted at four Midwestern medical centers (R01 HS01505402, 2005–2008).4 This study provides an important snapshot of pain outcomes in the dying and provides an opportunity to discover from actual practice a variety of predictors of pain outcomes that could serve as benchmarks for quality improvement and decision support for clinicians at the point of care.
METHODS
Design, Sample, and Procedures: Primary Study
The data and analyses reported in this manuscript were derived from a longitudinal study of the HANDS system on 8 diverse medical-surgical units in the Midwest. The HANDS system is an electronic application and database that nurses use to enter and track patients’ clinical diagnoses, outcomes, and interventions within and across episodes of care. A care episode (continuous patient stay in a single hospital unit) consists of the plans of care that nurses document at every formal handoff (admission, shift-change update, or discharge) into the electronic HANDS system. The main attributes available in the database for each plan of care include patient demographics, nurse demographics, all nursing diagnoses, associated outcomes and their ratings at the time of each handoff, and interventions coded with American Nurses Association-approved standardized terminologies. Nursing diagnoses are coded with North American Nursing Diagnosis Association-International (NANDA-I)5 terms, outcomes are coded using terms and rating scales from the Nursing Outcomes Classification (NOC),6 and interventions are coded with terms from the Nursing Intervention Classification (NIC).7 The nurse records an expected outcome rating (goal at discharge from a unit) on the plan of care when each NOC is first entered. The nurse enters the patient’s discharge disposition into the database at the end of each care episode.
The primary investigators employed representative convenience sampling to ensure broad representation and generalizability of findings given the constraints of “real time” testing of HANDS as part of the electronic health record. There were 3 primary unit inclusion criteria; 1) willingness to participate in the study, 2) stable unit staffing, and 3) agreement that all nurses employed on a unit would use the HANDS system to document and communicate about care at every handoff for the duration of the study. The additional unit selection criteria included variation on geographical location, organizational infrastructure, unit size, unit layout, adult medical-surgical patient types, intensity of care, and staffing model.
Based on this sampling plan, the primary investigators recruited 8 study units to participate for 12 months (4 units) or 24 months (4 units) in the multi-site longitudinal study.3 The units were located in 4 hospitals (2 large community hospitals (LCH), 1 university hospital (UH), and 1 small community hospital (SCH) in the Midwest that housed from 85 to 865 in-patient beds (Table 1). All but one of four hospitals had a palliative care service at the time of the study. As part of routine clinical practice, the nurses working on the 8 study units entered a total of 34,641 unique medical surgical patients with 40,747 total care episodes into the HANDS database over the 12- to 24-month data collection period (Table 1).
Table 1. All EOL Episodes and those with NANDA-I Pain diagnoses.
Number of EOL patients as a percentage of all patients and the number of EOL patients with a pain diagnosis as a percentage of all EOL patients in the HANDS database from 2005 to 2007.
| Hospital | Unit | Unit Type | Total Number of Episodes of Care | Total Number of EOL Episodes | % EOL Episodes | Number of EOL Episodes with Pain | % Pain of EOL Episodes |
|---|---|---|---|---|---|---|---|
| LCH1 | 1 | General Medical | 5,640 | 189 | 3.4 % | 72 | 38.1 % |
| LCH1 | 2 | Medical ICU | 1,228 | 163 | 13.3 % | 69 | 42.3 % |
| LCH1 | 3 | Gerontology | 9,565 | 519 | 5.4 % | 113 | 21.8 % |
| UH | 4 | Cardiac Surgical | 6,112 | 51 | 0.8 % | 33 | 64.7 % |
| UH | 5 | Neuro-Surgical | 8,216 | 97 | 1.2 % | 65 | 67.0 % |
| LCH2 | 6 | Medical Gerontology | 1,673 | 116 | 6.9 % | 71 | 61.2 % |
| LCH2 | 7 | General Medical | 3,432 | 156 | 4.5 % | 104 | 66.7 % |
| SCH | 8 | Medical Surgical | 4,881 | 134 | 2.7 % | 69 | 51.5 % |
| Total | 40,747 | 1,425 | 3.5 % | 596 | 41.8 % | ||
LCH1 = Large community hospital; UH= University hospital; LCH2 = Large community hospital; SCH = Small community hospital, all in the Midwest. Copyright 2012 HANDS Team, used by permission.
Design and Sample: Current Study
The current study was a focused analysis of a subset of the entire dataset. To examine the pain care of EOL patients, we first identified the episodes of care from the total 40,747 in which any of the following were present: 1) NOC outcome: Comfortable Death; 2) NOC outcome: Dignified Life Closure; 3) NIC intervention: Dying Care; 4) Discharged to hospice medical facility; 5) Discharged to hospice home care; or 6) Expired (Table 1). We identified a total of 1,425 EOL episodes (1,394 unique patients; one patient had 3 episodes and 29 had 2 episodes). In this subsample, the patients’ average age was 77.5 years (median=83, SD=12.8). Since race and gender were not required fields (appeared elsewhere on a patient’s record), not all episodes included this information. Of the 413 with gender information, 55% were females and 45% were males. Of the 187 with race information, 87% were white, 11% were black, 1% were Asians, and 1% were other. From the 1,425 episodes, we next identified those episodes with at least one NANDAI pain diagnosis (Chronic Pain or Acute Pain). A total of 596 EOL episodes met this criteria and were the source of data analyzed in this study.
Procedure
An episode in the HANDS database consists of a set of plans of care (POC), one submitted at every formal handoff (typically end of shift) to reflect the care provided during the previous shift and the status of outcomes at shift change. The nurse entered the first plan of care for an episode (admission plan) at the first handoff and it included all of the pertinent nursing diagnoses, outcomes, and interventions (coded with the corresponding NANDA-I, NOC, or NIC (NNN) labels and codes) that the nurse addressed during the admission shift. Each subsequent plan (updates/discharge) built on the previous and included all changes (additions, deletions, resolutions to NNNs) that occurred during the time period since the last plan submission. At every handoff, the nurse rated (or re-rated) the status of all NOC outcomes on a POC. The nurse entered an expected NOC rating (goal at discharge from a unit) only once, on the POC to which this NOC was first added. The entry of the NOC status and expected outcome ratings make it possible to monitor progress toward outcome goals during an episode and to assess goal attainment (met/not met) at discharge from a unit. All NOC outcomes had a rating scale that ranges from 1 to 5 with unique anchors for each NOC. A rating of 1 was the lowest or worst possible rating and 5 was the best possible rating. A 5 reflected the score that a healthy person of the same age, sex, and cognitive ability would score on the specified outcome. In previous studies, investigators showed adequate evidence of reliability and validity of the NOC outcome ratings, including in the primary study on all the units.8–11
Analyses
The analyses conducted for this study specifically focused on describing and contrasting the pain-linked NOC outcomes and respective ratings (at all handoffs and expected goal at unit discharge) for EOL patients with pain diagnoses. The specific analyses pertain to episodes of care for EOL patients with NANDA diagnoses of Acute Pain or Chronic Pain: 1) a description of the NOC outcomes linked to the NANDA diagnoses Chronic Pain and Acute Pain; 2) comparison to EOL patients without NANDA pain diagnoses; 3) contrasting expected ratings (goal at discharge/end of episode) of NOC outcomes linked to the NANDA pain diagnoses; and 4) contrasting the patterns or trajectories of ratings across handoffs for NOC outcomes linked to NANDA pain diagnoses. We used chi-squared tests for group comparisons and Wald tests to draw statistical inferences on the NOC trajectories. We considered p< .05 as statistically significant.
Results
Pain Sample
Of the 596 episodes with a documented pain diagnosis, there were 587 unique patients. For those with demographic data recorded, the mean age was 74.44 (SD=15.3), 77 were men, and 122 were women. For those 87 patients with ethnicity recorded, 77% were white, 9% were black, and 1 was Asian.
NOC Outcomes Linked to Pain Diagnoses for EOL Patients
To measure the outcomes of pain care, we isolated the range of NOC outcomes that nurses selected to monitor patients with pain diagnoses. Figure 1 shows the histogram of NOC labels that nurses linked to pain diagnoses. The top four NOC outcomes were; 1) Pain Control, 2) Pain Level, 3) Client Satisfaction: Symptom Control, and 4) Comfort Level.
Figure 1.

Nursing Outcomes Classification (NOC) outcome labels linked to North American Nursing Diagnosis Association (NANDA) pain diagnoses in EOL patient episodes.
EOL Patients with and without Pain Diagnoses
Table 1 shows the percentage of EOL episodes that include pain diagnosis for the eight units that participated in the study. The first striking fact was that out of 1,425 EOL episodes, only 41.3% included a Pain NANDA in their care plans. Even for the surgical units, the percentages were all below 70%. Closer examination revealed that the percentage of pain diagnosis among EOL patients was significantly lower in one large community hospital (LCH1). For example, for the Gerontology unit of LCH1, only 21.8% of EOL patients were diagnosed with pain, in contrast with over 60% of EOL patients for the Gerontology unit of the second large community hospital (LCH2). Even in the intensive care unit of LCH1, the percentage of dying patients with a pain diagnosis was only 42.3%. The difference between LCH1 and the other 3 hospitals was statistically significant (p<.0005). Our analysis also found that among EOL patients suffering from acute confusion, only 27.7% were diagnosed with pain. This low percentage was significantly lower than for patients without acute confusion (p<.003).
Nurses’ Expected Outcomes for EOL Patients with Pain Diagnoses
Figure 2 shows the distribution of the expected outcome ratings (goals at discharge) for EOL patients at the end of a unit episode; expired, discharged, and all. We observed that there was no discernible difference in the expected pain outcomes of patients that expired and those that were discharged (to hospice care). There are around 5% of patients with expected rating of 3, which means that these patients would still experience fairly severe pain at the end of the episode, which should not be acceptable. Although quite rare, there were 9 instances where the patients were expected to endure very severe pain (expected rating of 1 [n = 3] or 2 [n = 6]) at the end of the episode. None of these 9 cases were from ICU, but 5 were from one gerontology unit and one each for four other units.
Figure 2.
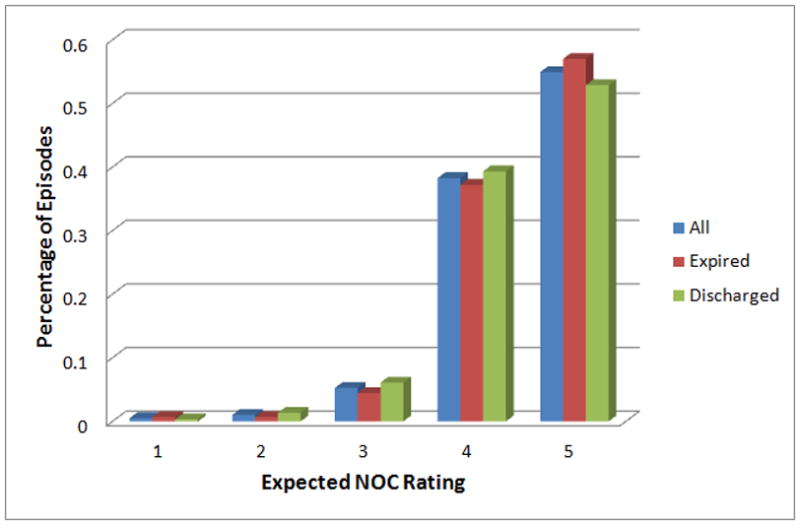
Expected outcome ratings (goals at discharge) for end-of-life patients with pain diagnoses.
Figure 3 shows the histogram of the actual pain outcome rating achieved by EOL patients at the end of an episode. We observed that roughly 10% of patients suffered from severe pain (rating of 1 or 2) at discharge and an additional 20% still had significant pain (rating of 3) at discharge. The difference between Figures 2 and 3 suggests that a large portion of the EOL patients do not meet the expected pain outcome at final discharge. Indeed, only 42.7% of the episodes met the expected outcome related to pain at the end of an episode. Taking into account the episodes that set the expected rating (goal) too low, the percentage of episodes with an acceptable pain management outcome was even lower.
Figure 3.

Actual final Nursing Outcomes Classification (NOC) outcome ratings for end-of-life patients with pain diagnoses.
Trajectory Analyses of NOC Outcome Ratings for EOL Patients with Pain Diagnoses
Although the final NOC ratings and whether or not each met the designated expected rating were important indicators of the quality of pain management, the trajectory of a patient’s NOC ratings related to pain over the duration of a patient’s stay was of equal importance. As seen in Figure 4, roughly 60% of EOL patients diagnosed with pain stayed in the clinical unit for more than two days; roughly 5% of them stayed longer than 12 days. Because the objective of the pain management is to reduce the severity of the pain as quickly as possible after admission and then to maintain the low pain level throughout the stay, it is important to look beyond the final NOC rating to ensure that patients suffer little or no pain during their entire stay.
Figure 4.

Length of stay for end-of-life patients with pain diagnoses by the end-of-episode status.
To examine the progress of patients’ pain over time, we plotted in Figure 5 the trajectory of the average NOC rating as well as the percentage of episodes that met the expected rating. We observed that the trajectories of both metrics showed a similar trend: there was a significant improvement in the first 48 hours and after that there was almost no improvement although a majority of patients had not reached the expected outcome and many were still experiencing significant pain. To verify our observation, we performed linear regression of both metrics versus time for the first 48 hours. A test of model utility yields a statistically significant (p<.0005) improvement in the patient pain condition during the first 48 hours. In contrast, linear regression of the average NOC rating versus time from hour 48 onward shows a slope slightly below zero. The slope for the percentage of meeting the expected outcome versus time after the first 48 hours is 0.11% of the slope for the first 48 hours and is non-significant (p=.92).
Figure 5.

NOC outcome ratings (linked to pain diagnoses in EOL episodes) over time. Both the percentage of meeting the expected outcome (left axis) and the average NOC rating (right axis) are shown. They combine to show the variation in pain levels over time.
Studying the trajectory of the NOC rating also produced benchmarks, against which clinicians and administrators can compare the progress of the individual patient’s condition as well as the performance of individual units and hospitals. In Figure 6, we show the average NOC rating trajectory (pattern) of each hospital in this study. The trajectories for all hospitals exhibit the same pattern of improvement at the beginning of an episode with ratings leveling off or decreasing across time. Clear differences occur among the four hospitals. UH seems to under-perform, which can probably be attributed to the fact that the two units from UH are both surgical units. LCH1 and LCH2 had largely similar average ratings after hour 84, but LCH1 clearly lagged behind LCH2 in the first few days. LCH1 had a substantially lower percentage of EOL patients with pain diagnosis as shown by the data in Table 1. To verify that the differences between hospitals were statistically significant, we plotted and compared the confidence intervals of the average NOC ratings of hospitals. For example, the 95% confidence interval plot (Figure 7) for LCH1 and LCH2 shows that the gap between them was highly unlikely to be the results of statistical variations. The p-value for rejecting the null hypothesis that there is no difference between the average NOC ratings in the first 48 hours was less than .05.
Figure 6.

Average Nursing Outcomes Classification (NOC) rating trajectories for end-of-life patients with pain diagnoses by hospital. We can observe similar trends of initial improvement followed by stagnation in pain control among all hospitals. We can also observe differences among hospitals in initial pain control.
Figure 7. Confidence intervals for the average NOC ratings over time for EOL patients with pain diagnoses.

Data are presented to contrast the marked differences in the outcome ratings in the first hours post admission for 2 hospitals. Large community hospital 2 (LCH2) in light color shows a significantly different pattern compared to LCH1 in dark color (p-value < 0.05). The pattern indicates better pain control is achieved earlier in LCH2 when compared to LCH1.
To determine if the difference between LCH1 and other hospitals could be attributed to the types of units in LCH1, we computed and compared units’ average outcome trajectory ratings. From Figure 8, we observed that while the existence of an intensive care unit partially contributed to the low rating of LCH1 in the first hours, other individual units in LCH1 also tended to lag behind similar units in other hospitals at the beginning of the admission.
Figure 8.

Average Nursing Outcomes Classification rating trajectories for end-of-life patients with pain diagnoses by unit. Aside from two units (LCH1: MICU and UH: Neuro Surg), where most episodes are too short for us see a trend, we can observe that the trend of initial improvement followed by stagnation holds true in the unit level. The difference in initial pain control among units is also apparent.
Comparisons of the gerontology units and the medical units of LCH1 and LCH2 are shown in Figure 9 and Figure 10, respectively. Both figures show a clear gap between a unit of LCH1 and a similar unit of LCH2 in the beginning of the hospital stay (p<.05 for both comparisons).
Figure 9.

Average Nursing Outcomes Classification (NOC) rating trajectories for end-of-life patients with pain diagnoses for the gerontology units of LCH1 and LCH2. The light- and dark-colored areas are 95% confidence intervals for the average NOC ratings of LCH1: Gerontology and LCH2: Gerontology units, respectively.
Figure 10.

Average Nursing Outcomes Classification (NOC) rating trajectories for end-of-life patients with pain diagnoses for the LCH1 and LCH2 medical units. The dark- and light-colored areas are 95% confidence intervals for the average NOC ratings of LCH1: General Medical and LCH2: General Medical units, respectively.
Finally, we investigated the feasibility of utilizing the NOC rating trajectory data to predict whether an EOL patient with a pain diagnosis would meet the expected NOC outcome rating (goal for discharge) at the end of an episode. Motivated by our observation that most of the improvement came at the start of the episode, we classified the EOL episodes with pain diagnosis into two groups based on the change in pain rating from hour 12 to hour 24 of a patient’s stay and examined the percentage meeting the expected outcome for each group. Our analysis revealed that an improvement in a patient’s pain from hour 12 to hour 24 indicated an above average chance in meeting the expected outcome before discharge or death. We found that 56.4% of the patients, whose pain improved during this period, met the expected outcome at the end of the episode. Among patients whose pain did not improve during this period, only 40.3% met the expected outcome. Chi square test yields a p-value of 0.025, indicating a significant gap between these two groups.
DISCUSSION
Our analysis of a relatively large EOL sample from recent, actual practice data reveals areas that need improvement in the current hospital pain care practice. Firstly, pain is under-diagnosed and documented in EOL patients, a group well known to be at high risk for pain. Secondly, the expected pain outcome is often set too low. Thirdly, the expected pain outcome is met for too few patients, despite availability of palliative care services. Findings of pain trajectories suggest that the EOL patients’ quality of life as they die needs to be improved through aggressive pain management in the initial hours of their hospitalization. These findings are disturbing given that they demonstrate lack of improvement in pain care for the dying in the nearly two decades since the SUPPORT study.1
The under-diagnosis and documentation of pain in EOL patients is a longstanding problem for which an adequate solution has not yet been implemented widely in clinical practice. The low rate of pain documented for this sample of EOL patients is disturbingly similar to prior research.1,12 The finding of only 70% of the episodes with pain documented on the POC for surgical units is particularly low given that nearly all patients undergoing surgery require pain care. Also, the low percentage of pain diagnosis suggests that pain in EOL patients is under-diagnosed, especially in LCH1. The cause of this under-diagnosis is not clear and needs further study. One possible cause is that nurses might have focused on symptoms that are perceived to be more life threatening and did not put high priority on pain alleviation. This hypothesis could be tested by comparing percentage of pain diagnosis among patients with life threatening conditions versus those without. Another possible cause could be that some EOL patients were not responsive and could not report their pain. Our novel finding that patient responsiveness significantly impacts inclusion of a pain diagnosis on the POC is important for alerting clinicians to an at risk group, those with acute confusion, for whom additional efforts need to be enacted to assure that they receive appropriate pain care at the EOL. This practice gap can be improved by emphasizing a higher priority on pain care and the high risk of pain in patients with serious illness. Evidence from the National Hospice Outcomes project indicate that clinicians should not be concerned with opioids hastening death in dying people.13 Also, it is important to develop pain diagnosis methods that do not rely on patient input for those not able to communicate their pain to others, such as facial pain recognition tools14 or other signs and behaviors associated with pain.15 These tools, however, should complement not replace verbal report of pain for EOL patients able to communicate their pain.
For the episodes with documented pain, there were expectations for excellent pain outcomes, but the actual pain outcome ratings indicated that sizable proportions of patients died or were discharged to hospice in moderate to severe pain with only 25% of the sample obtaining an optimal pain control outcome. This finding is inconsistent with patient and family preferences for comfort.16–21 That 25% of the patients who expired during the episodes died on the day of admission may reflect, as others have noted, transfers from nursing homes, home, or other units as death became more evident in those settings.22,23 The variability in outcome ratings by hospital and unit are consistent with other studies,23,24 but none have demonstrated the clarity of differences by institution and unit as we have done. Reasons for these differences are not readily apparent. It is possible that these differences reflect unmeasured institutional culture or the early phase of available palliative care services in these hospitals. Finally, additional research is needed to understand the pain outcomes in the hospitalized patients without a pain diagnosis as it is not clear from this study that they did or did not have pain.
The clear evidence supports the value of HANDS to benchmark unit and hospital outcomes, which could provide more evidence of effective palliative care at the system level.25 Researchers have called for “large multisite studies that have adequate power to detect meaningful differences in clinical and use outcomes, and that use well-defined and generalizable structures and evidence-based care processes, well-defined uniform outcome measures, and analyses that link the outcomes of interest to individual components of the interventions, to guide further development of the field.”25 HANDS provides such structures, outcome measures and allows outcomes to be linked to interventions and offers an opportunity for health services research to generate knowledge to improve palliative care, especially for the dying.
The rare instances of the patients being expected to endure severe pain (expected rating of 1 or 2) indicate a need for nurse education. These low expected NOC ratings (below 4) should not be acceptable in practice. It is possible, but unlikely, that the nurses reversed the scale for the outcome expectation, where 5 is optimal pain control and 1 is poor pain control. This scale is opposite to that of the pain scales used in most hospitals for which a larger value such as 10 indicates severe pain (or poor pain relief) rather than optimal pain relief as indicated in the HANDS system. Keenan and colleagues clearly documented through a series of validation studies that the nurse subjects used the HANDS diagnoses, interventions, and outcomes as intended with strong fidelity.8–11 Furthermore, all NOCs in the HANDS system are rated on a 5 point scale with 1 being the poorest score and 5 the best to avoid confusion. Moreover all nurses received extensive training with documented competency before using the system in actual practice. Though unlikely it is still possible the validation studies and training do not guarantee that every nurse in the study used the rating scale correctly. Given the importance of the appropriate expectation about pain control, however, additional research is needed to reduce this type of measurement error. If the issue is not a measurement artifact, then training is needed to improve nurses’ expectations about the likelihood of excellent pain control being achieved for patients at the EOL.
Our finding that patient pain control stagnated after improving over the first 48 hours is important. It is clear that there is a need to identify ways to break through this plateau, which could lead to a dramatic improvement in the quality of pain management among EOL patients. The lag in average NOC ratings between LCH1 and LCH2 may indicate that LCH1 does not place a high priority on pain alleviation from the start of a patient’s stay. Identifying differences in pain care by hospital is the first step to using benchmarks such as we identified in this study to improve pain outcomes and reduce the gap between hospitals. This type of health services research provides many insights.
In summary, evidence from HANDS, a practice-based electronic health record, strongly indicates the need for additional focus on pain diagnosis, interventions, and outcomes for hospitalized EOL patients. Despite availability of strong science to support pain management in some EOL populations, findings indicate the application of that science in practice still remains less than is needed to meet patient and family preferences for comfort. More than 15 years after the SUPPORT study,1 we document that pain care is inadequate for hospitalized patients who died or were discharged to hospice. Additional research is needed to effectively translate pain science into EOL practice, even at institutions with palliative care services. Interventions are desperately needed to do so. Practice-based research using large datasets of structured data such as HANDS may provide insights about practices that are associated with improved outcomes.
Contributor Information
Gail Keenan, Email: gmkeenan@uic.edu.
Fadi Al-Masalha, Email: falmas2@uic.edu.
Karen Dunn Lopez, Email: kdunnl2@uic.edu.
Ashfaq Khokar, Email: ashfaq@uic.edu.
Andrew Johnson, Email: ajohnson@uic.edu.
Rashid Ansari, Email: ransari@uic.edu.
Diana J. Wilkie, Email: diwilkie@uic.edu.
References
- 1.A controlled trial to improve care for seriously ill hospitalized patients. The study to understand prognoses and preferences for outcomes and risks of treatments (SUPPORT) The SUPPORT Principal Investigators. Jama. 1995 Nov 22–29;274(20):1591–1598. [PubMed] [Google Scholar]
- 2.Curtis JR, Nielsen EL, Treece PD, et al. Effect of a quality-improvement intervention on end-of-life care in the intensive care unit: a randomized trial. Am J Respir Crit Care Med. Feb 1;183(3):348–355. doi: 10.1164/rccm.201006-1004OC. [DOI] [PMC free article] [PubMed] [Google Scholar]
- 3.Keenan G, Yakel E, Yao Y, Xu D, Szalacha L, Chen J, Johnson A, Tschannen D, Ford Y, Wilkie DJ. Maintaining a consistent big picture: Meaningful use of a web-based POC EHR system. International Journal of Nursing Knowledge. doi: 10.1111/j.2047-3095.2012.01215.x. (In press) [DOI] [PMC free article] [PubMed] [Google Scholar]
- 4.Keenan G, Yakel E. HIT support for safe nursing care (7-R01 HS01 5054 02) Agency for Health Research and Quality (AHRQ); 2004–2008. [Google Scholar]
- 5.Ren AH, Zhang Y, Zhao YL, Zhao L, Liu XY, Zhao SF. Comparative study of differentially expressed genes in mouse bone marrow and fetal liver cells. Zhongguo Shi Yan Xue Ye Xue Za Zhi. 2003 Oct;11(5):444–449. [PubMed] [Google Scholar]
- 6.Moorhead S, Johnson M, Maas M. Nursing outcomes classification (NOC) St. Louis, Mo: Mosby; 2004. Iowa Outcomes Project. [Google Scholar]
- 7.Dochterman JM, Bulechek GM. Nursing interventions classification (NIC) St. Louis, Mo: Mosby; 2004. [Google Scholar]
- 8.Keenan G, Barkauskas V, Johnson M, Maas M, Moorhead S, Reed D. Establishing the validity, reliability, and sensitivity of NOC in adult care nurse practitioner clinics. Outcomes Manag. 2003;7(7):74–83. [PubMed] [Google Scholar]
- 9.Keenan G, Stocker J, Barkauskas V, et al. Assessing the reliability, validity, and sensitivity of nursing outcomes classification in home care settings. J Nurs Meas. 2003 Fall;11(2):135–155. doi: 10.1891/jnum.11.2.135.57285. [DOI] [PubMed] [Google Scholar]
- 10.Keenan G, Tschannen GD, Wesley M. Standardized nursing terminologies can transform practice. J Nurs Admin. 2008;38(3):103–106. doi: 10.1097/01.NNA.0000310728.50913.de. [DOI] [PubMed] [Google Scholar]
- 11.Keenan G, Yakel E. Promoting safe nursing care by bringing visibility to the disciplinary aspects of interdisciplinary care. AMIA Annu Symp Proc. 2005:385–389. [PMC free article] [PubMed] [Google Scholar]
- 12.Goodlin SJ, Winzelberg GS, Teno JM, Whedon M, Lynn J. Death in the hospital. Arch Intern Med. 1998 Jul 27;158(14):1570–1572. doi: 10.1001/archinte.158.14.1570. [DOI] [PubMed] [Google Scholar]
- 13.Portenoy RK, Sibirceva U, Smout R, et al. Opioid use and survival at the end of life: a survey of a hospice population. l Pain Symptom Manage. 2006 Dec;32(6):532–540. doi: 10.1016/j.jpainsymman.2006.08.003. [DOI] [PubMed] [Google Scholar]
- 14.Chen Z, Ansari R, Wilkie DJ. Automated Detection of Pain from Facial Expressions: A Rule-Based Approach Using AAM. SPIE Medical Imaging; San Diego, CA. 2012. in press. [DOI] [PMC free article] [PubMed] [Google Scholar]
- 15.McGuire DB, Reifsnyder J, Soeken K, Kaiser KS, Yeager KA. Assessing pain in nonresponsive hospice patients: development and preliminary testing of the multidimensional objective pain assessment tool (MOPAT) J Palliat Med. 2011 Mar;14(3):287–292. doi: 10.1089/jpm.2010.0302. [DOI] [PMC free article] [PubMed] [Google Scholar]
- 16.Teno JM, Clarridge BR, Casey V, et al. Family perspectives on end-of-life care at the last place of care. Jama. 2004 Jan 7;291(1):88–93. doi: 10.1001/jama.291.1.88. [DOI] [PubMed] [Google Scholar]
- 17.von Gunten CF. Interventions to manage symptoms at the end of life. J Palliat Med. 2005;8 (Suppl 1):S88–94. doi: 10.1089/jpm.2005.8.s-88. [DOI] [PubMed] [Google Scholar]
- 18.Connor SR, Teno J, Spence C, Smith N. Family evaluation of hospice care: results from voluntary submission of data via website. J Pain Symptom Manage. 2005 Jul;30(1):9–17. doi: 10.1016/j.jpainsymman.2005.04.001. [DOI] [PubMed] [Google Scholar]
- 19.Teno JM, Kabumoto G, Wetle T, Roy J, Mor V. Daily pain that was excruciating at some time in the previous week: prevalence, characteristics, and outcomes in nursing home residents. J Am Geriatr Soc. 2004 May;52(5):762–767. doi: 10.1111/j.1532-5415.2004.52215.x. [DOI] [PubMed] [Google Scholar]
- 20.Somogyi-Zalud E, Zhong Z, Lynn J, Hamel MB. Elderly persons’ last six months of life: findings from the Hospitalized Elderly Longitudinal Project. J Am Geriatr Soc. 2000 May;48(5 Suppl):S131–139. doi: 10.1111/j.1532-5415.2000.tb03122.x. [DOI] [PubMed] [Google Scholar]
- 21.Somogyi-Zalud E, Zhong Z, Lynn J, Dawson NV, Hamel MB, Desbiens NA. Dying with acute respiratory failure or multiple organ system failure with sepsis. J Am Geriatr Soc. 2000 May;48(5 Suppl):S140–145. doi: 10.1111/j.1532-5415.2000.tb03123.x. [DOI] [PubMed] [Google Scholar]
- 22.Gruneir A, Mor V, Weitzen S, Truchil R, Teno J, Roy J. Where people die: a multilevel approach to understanding influences on site of death in America. Med Care Res Rev. 2007 Aug;64(4):351–378. doi: 10.1177/1077558707301810. [DOI] [PubMed] [Google Scholar]
- 23.Trask PC, Teno JM, Nash J. Transitions of care and changes in distressing pain. J Pain Symptom Manage. 2006 Aug;32(2):104–109. doi: 10.1016/j.jpainsymman.2006.03.007. [DOI] [PubMed] [Google Scholar]
- 24.McCarthy EP, Phillips RS, Zhong Z, Drews RE, Lynn J. Dying with cancer: patients’ function, symptoms, and care preferences as death approaches. J Am Geriatr Soc. 2000 May;48(5 Suppl):S110–121. doi: 10.1111/j.1532-5415.2000.tb03120.x. [DOI] [PubMed] [Google Scholar]
- 25.Morrison RS. Health care system factors affecting end-of-life care. J Palliat Med. 2005;8 (Suppl 1):S79–87. doi: 10.1089/jpm.2005.8.s-79. [DOI] [PubMed] [Google Scholar]