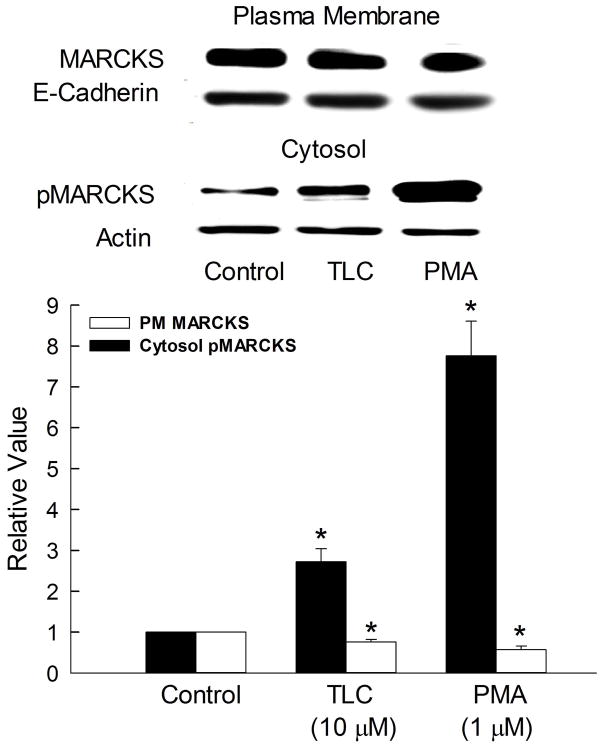
Figure 4.
TLC increases cytosolic pMARCKS. HuH-NTCP cells were treated with 10μM TLC or 1μM PMA for 15 min followed by biotinylation of cell surface proteins and immunoblot analysis of biotinylated plasma membrane MARCKS and E-cadherin or isolation of cytosol (100,000xg supernatant) and determination of phospho-MARCKS (pMARCKS). Typical immunoblots are shown in the upper panel and results of densitometric analysis (Mean±SEM, n=3) are shown in the bar graph. *Significantly different (p < 0.05) from control (con) values.

