

Abstract
Neurons in layer VI of visual cortex represent one of the largest sources of nonretinal input to the dorsal lateral geniculate nucleus (dLGN) and play a major role in modulating the gain of thalamic signal transmission. However, little is known about how and when these descending projections arrive and make functional connections with dLGN cells. Here we used a transgenic mouse to visualize corticogeniculate projections to examine the timing of cortical innervation in dLGN. Corticogeniculate innervation occurred at postnatal ages and was delayed compared with the arrival of retinal afferents. Cortical fibers began to enter dLGN at postnatal day 3 (P3) to P4, a time when retinogeniculate innervation is complete. However, cortical projections did not fully innervate dLGN until eye opening (P12), well after the time when retinal inputs from the two eyes segregate to form nonoverlapping eye-specific domains. In vitro thalamic slice recordings revealed that newly arriving cortical axons form functional connections with dLGN cells. However, adult-like responses that exhibited paired pulse facilitation did not fully emerge until 2 weeks of age. Finally, surgical or genetic elimination of retinal input greatly accelerated the rate of corticogeniculate innervation, with axons invading between P2 and P3 and fully innervating dLGN by P8 to P10. However, recordings in genetically deafferented mice showed that corticogeniculate synapses continued to mature at the same rate as controls. These studies suggest that retinal and cortical innervation of dLGN is highly coordinated and that input from retina plays an important role in regulating the rate of corticogeniculate innervation.
Introduction
In the dorsal lateral geniculate nucleus (dLGN), retinal projections provide the primary excitatory drive for thalamocortical relay cells. However, these inputs account for <10% of all synapses in dLGN (Sherman and Guillery, 2002; Bickford et al., 2010). The majority of synapses are formed by nonretinal projections that arise from thalamic reticular nucleus, brainstem nuclei, and layer VI of visual cortex. Neurons in cortical layer VI are one of the largest sources of nonretinal input to dLGN (Erișir et al., 1997a,1997b) and have a major impact on thalamic signal transmission, sharpening receptive field properties of relay cells, influencing the gain of retinogeniculate transmission, and synchronizing network activity in a stimulus-specific manner (Sherman and Guillery, 2002; Briggs and Usrey, 2008).
Despite the enormity of this projection and its extensive influence on thalamic signal transmission, virtually nothing is known about how and when the corticogeniculate pathway develops or how it might be coordinated with the development and remodeling of retinal projections to dLGN. Visualizing corticogeniculate projections and isolating them for experimental manipulation has been a challenge. For example, it is difficult to label large regions of visual cortex while at the same time restricting tracers to layer VI. In addition, it is hard to examine their initial targeting because exogenous labeling techniques require in utero manipulations and/or relatively long incubation times to resolve terminal labeling in dLGN. To overcome these limitations, we used a transgenic mouse in which a golli promoter element of the myelin basic protein gene is used to express tau-enhanced green fluorescent fusion protein (τ-GFP) in the cell bodies and processes of layer VI cortical neurons (Jacobs et al., 2007; Grant et al., 2012). Although the use of this mouse has revealed that cortical projections innervate thalamic nuclei sequentially in a ventrolateral to dorsomedial fashion, a detailed examination of corticothalamic innervation and how it relates to the arrival and remodeling of retinal projections in dLGN is lacking. Moreover, if innervation is coordinated, this suggests that the retina could play a role in regulating corticogeniculate innervation. To address these issues, we first examined corticogeniculate innervation in relation to the development and remodeling of the retinogeniculate pathway by labeling retinal projections with cholera toxin subunit B (CTB) in golli-τ-GFP mice. To examine the functional state of corticogeniculate synapses, we conducted in vitro whole-cell recordings using a slice preparation that preserves corticothalamic axons and their connections to dLGN relay cells. Finally, to explore whether retinogeniculate innervation plays a role in regulating corticogeniculate innervation, we removed retinal input before the arrival of corticogeniculate projections by enucleation at birth or by making use of a mutant (math5−/−) in which retinal progenitors fail to differentiate into retinal ganglion cells (RGCs; Brown et al., 1998; Wang et al., 2001).
Materials and Methods
Subjects.
Experiments were performed on C57BL/6 mice (Taconic Farms) and two different transgenic strains, golli-τ-GFP mice (Jacobs et al., 2007) and golli-τ-GFP mice crossed with math5−/− mutants of either sex ranging in age from postnatal day 0 (P0) to P45. For transgenic strains, founder lines were on a pigmented background (mixed inbred line; C57BL/6 and 129/SvEv mixed background). For the bulk of our studies, we mated golli-τ-GFP+/+/math5−/− mice to each other to secure sufficient numbers of transgenic mutant offspring from each litter.
For PCR genotyping, the oligonucleotides Neo-R (CATTGAACAAGATGGATTGCA), Neo-F (GCCGGCCACAGTCGATGAATC), Math5-F1 (ATGGCGCTCAGCTACATCAT), and Math5-R1 (GGGTCTACCTGGAGCCTAGC) were used. The PCR amplification was performed in 35 cycles by denaturation at 94°C for 30 s, annealing at 59°C for 30 s, and elongation at 72°C for 45 s. Genotyping for τ-GFP was not necessary because the brains of these transgenic mice fluoresce green under illumination of blue (488 nm) light. For all surgical procedures, animals were deeply anesthetized with isoflurane vapors. All experiments were conducted under the guidelines of the Institutional Animal Care and Use Committee at Virginia Commonwealth University.
Intravitreal eye injections.
Eye injections of the anterograde tracer CTB were conducted (Jaubert-Miazza et al., 2005). For neonates, fused eyelids were separated or cut to expose the temporal region of the eye. The sclera was pierced with a sharp-tipped glass pipette and excess vitreous was drained. Another pipette filled with a 1% solution of CTB conjugated to different Alexa Fluors (e.g., 594, 555, 488; Invitrogen) dissolved in distilled water was inserted into the hole made by the first pipette. The pipette containing the CTB was attached to a picospritzer and a prescribed volume (1–4 μl at ages P0–P10 and 5–8 μl for ages >P10) of solution was injected into the eye. After a 24–48 h survival period, animals were transcardially perfused with PBS followed by 4% paraformaldehyde in 0.1 m phosphate buffer for anatomical studies. The brains were postfixed overnight and sectioned at 70 μm in the coronal plane using a Vibratome (VT1000S; Leica). Sections were mounted in either ProLong Gold antifade reagent (Invitrogen) or ProLong Gold antifade reagent with DAPI (Invitrogen) and imaged with epifluorescence microscopy.
Enucleation.
Monocular or binocular enucleations were performed on golli-τ-GFP mice 6–18 h after birth. Under deep anesthesia, the palpebral fissure was opened and the eyeball was isolated using a pair of curved forceps. The optic nerve and the ophthalmic artery were then cut and the eye was carefully removed. The orbit was filled with Gelfoam (Upjohn) to avoid hemorrhaging. For monocular enucleation, the spared eye was injected with CTB conjugated to Alexa Fluor 594. Animals were allowed to recover on a heating pad and were then returned to their home cages.
Image analysis.
Images of dLGN were acquired with a Photometrix Coolsnap camera attached to a Nikon Eclipse epifluorescence microscope using a 10× objective (0.3 numerical aperture). Fluorescent images of labeled sections were acquired and digitized separately (1300 × 1030 pixels/frame) using the following filter settings: Alexa Fluor 488: Exciter 465-495, DM 505, BA 515-555; Alexa Fluor 594: Exciter 528-553, DM 565, BA 600-660; DAPI: Exciter 330-380, DM 400, BA 435-485. To determine the spatial extent of retinogeniculate and corticogeniculate projections in the dLGN, threshold imaging protocols were used (Jaubert-Miazza et al., 2005; Demas et al., 2006). All analyses associated with these protocols were conducted in a blind fashion. Briefly, background fluorescence was subtracted and grayscale images were normalized (0–255) using MetaMorph (Molecular Devices) and Photoshop (Adobe) software. The boundaries of dLGN were delineated so as not to include label from the optic tract, intergeniculate leaflet, or ventral lateral geniculate nucleus (vLGN). To define the borders of dLGN in deafferented mice, we used a DAPI stain along with the τ-GFP fluorescence. A threshold value was chosen that corresponded to a location within the grayscale histogram where there was a clear distinction between signal and residual background fluorescence. Because of differences in background fluorescence, these values varied from animal to animal (50–75), but were approximately the same across sections within a single animal (Jaubert-Miazza et al., 2005; Demas et al., 2006). The total number of pixels in the defined area of dLGN representing either green or red fluorescence was measured. The spatial extent of retinogeniculate and corticogeniculate projections was estimated by summing the area across three to five successive sections through the middle of dLGN and then expressed as a percentage of the total area. In some cases, we also examined a range of threshold values that fell above and below the levels (60–68) obtained in layer VI of visual cortex of control and experimental mice. Such precaution ensured that our estimates of spatial extent were unaffected by the choice of a single threshold value (Torborg and Feller, 2004).
Immunohistochemistry.
Animals were perfused as described above. Brains were postfixed overnight, cryopreserved in 25% sucrose (in PBS), and coronally sectioned (20 μm) using a cryostat. Sections were dried on Superfrost plus slides and were then preincubated for 1 h in blocking solution (5% NGS, 2.5% BSA, 0.1% Triton in PBS). Sections were treated with primary antibodies (mouse anti-VGlut1, 1:100, NeuroMab; rabbit anti-GFP, 1:250, Invitrogen) diluted in blocking solution, and incubated overnight at 4°C. The following day, the tissue was washed with PBS and incubated at room temperature for 1 h in blocking solution containing a 1:1000 dilution of secondary antibodies (Alexa Fluor 594 goat anti-mouse IgG1; Alexa Fluor 488 goat anti-rabbit; Invitrogen). The tissue was washed with PBS and mounted in Vectashield (Vector Laboratories).
Recording procedures.
To determine when functional corticogeniculate synapses develop in dLGN, we made use of a parasagittal slice preparation in which corticothalamic fibers innervating dorsal thalamus are maintained (Turner and Salt, 1998; Krahe and Guido, 2011; Fig. 5E). Individual (300 μm thick) slices containing dLGN were placed into a recording chamber and maintained at 32°C and perfused continuously at a rate of 2 ml/min with oxygenated ACSF containing the following (in mm): 124 NaCl, 2.5 KCl, 1.25 NaH2PO4, 2 MgSO4, 26 NaHCO3, 10 glucose, and 2 CaCl2 (saturated with 95% O2/5% CO2), pH 7.4. In vitro recordings were done in the whole-cell current-clamp configuration with the aid of differential interference contrast and fluorescence optics on a fixed stage, visualized recording apparatus (EX51WI; Olympus). Patch electrodes (3–5 MΩ) made of borosilicate glass were filled with a solution containing the following (in mm): 140 K-gluconate, 10 HEPES, 0.3 NaCl, 2 ATP-Mg, and 0.1 GTP-Na, pH 7.25. Pipette capacitance, series resistance, and whole-cell capacitance were carefully monitored and compensated electronically during the recording. To evoke synaptic activity in dLGN, square-wave pulses (0.1–0.3 ms, 0.1–1 mA) were delivered through a pair of thin-gauge tungsten wires (0.5 MΩ) positioned in the thalamic reticular nucleus adjacent to the internal capsule. At the mature corticothalamic synapse, the EPSPs/EPSCs increase in amplitude in response to repetitive stimulation (Turner and Salt, 1998; Granseth et al., 2002; Granseth and Lindström, 2003; Alexander and Godwin, 2005; Kielland et al., 2006). To assess such facilitation, pairs of electrical stimuli were delivered with interstimulus intervals (ISIs) ranging from 100 to 1000 ms at stimulus intensities that were close to levels that evoked maximal amplitudes (Granseth et al., 2002; Granseth and Lindström, 2003; Krahe and Guido, 2011). The degree of facilitation was determined by calculating the paired pulse ratio (PPR), which is the amplitude of the second stimulus EPSP response (EPSP2) divided by the amplitude of the first stimulus EPSP response (EPSP1). The amplitude of EPSP1 was measured from a baseline value just before stimulation, whereas the amplitude of EPSP2 was measured from the onset of the second EPSP. All ratios were based on an average of five responses. GABA antagonists, bicuculline (25 μm, Tocris Bioscience), and CGP (10 μm, Tocris Bioscience) were bath-applied to block GABAA- and GABAB-mediated activity. Neuronal activity was digitized (10–20 kHz) through an interface unit (National Instruments), acquired and stored directly on the computer, and analyzed by using commercial software (Strathclyde Electrophysiology Software, Whole Cell Analysis Program, WinWCP V3.8.2).
Figure 5.

Development of functional corticogeniculate synapses in dLGN. A–D, Coronal sections showing VGlut1 immunofluorescence and τ-GFP expressing corticogeniculate projections in dLGN at P7 (A,B) and P14 (C,D). Left panels in A and C show merged images of τ-GFP (green) and VGlut1 (red). τ-GFP and VGlut1 are shown separately in the middle and right panels. Scale bar, 200 μm. B, D, High-magnification confocal images of VGlut1 staining from A, C, respectively. The image in B corresponds to a region in dLGN that was occupied by τ-GFP expressing axons. Scale bar, 35 μm. E, Acute in vitro thalamic slice preparation. Left: Example of a 300-μm-thick parasagittal slice of dLGN from a golli-τ-GFP mouse. Images are from the same section that was postfixed overnight after in vitro recording and show corticogeniculate projections expressing τ-GFP (top, green) and retinogeniculate projections labeled with CTB (bottom, red). Right: Schematic of the slice preparation. Also shown is the recording electrode (white) in dLGN and bipolar stimulating electrode (black) placed in the thalamic reticular nucleus (TRN), where corticothalamic axons pass before innervating dLGN. D indicates dorsal; A, anterior; OT, optic tract; M, medial geniculate nucleus. Scale bar, 100 μm. F, Examples of EPSPs evoked by paired electrical pulses delivered to corticothalamic fibers at three different age groups. G, Plots showing the mean PPR at different ISIs for P7 (n = 10), P15–P16 (n = 10), and P21–P45 (n = 15) cells. Error bars represent SEM. H, Summary plot showing the average PPR seen with an ISI of 100 ms during the first few postnatal weeks. The degree of facilitation was significantly higher at the second and third postnatal weeks compared with the first postnatal week (*p < 0.01). Error bars represent SEM.
Results
Figure 1A, B shows the τ-GFP expression in layer VI neurons in a coronal section of neocortex from a P14 golli-τ-GFP mouse. Most notable was the high density of τ-GFP expressing neurons restricted almost exclusively to layer VI (Jacobs et al., 2007). Apical dendrites of pyramidal neurons can also be seen projecting to the superficial layers of cortex. Descending axonal arbors and terminals of layer VI neurons were evident throughout dLGN, as well as other first-order sensory nuclei such as the ventrobasal complex (VB; Fig. 1D,G). Note that the areas devoid of τ-GFP in dLGN depict the location of somata (Fig. 1C–E). Indeed, we saw no evidence of cellular labeling throughout the thalamus (Jacobs et al., 2007). Finally, vLGN, which lies just ventral to dLGN, showed very little innervation of τ-GFP-expressing arbors (Fig. 1D), a result that is consistent with previous reports indicating this nucleus receives descending projections from layer V and not VI (Cosenza and Moore, 1984; Bourassa and Deschênes, 1995).
Figure 1.
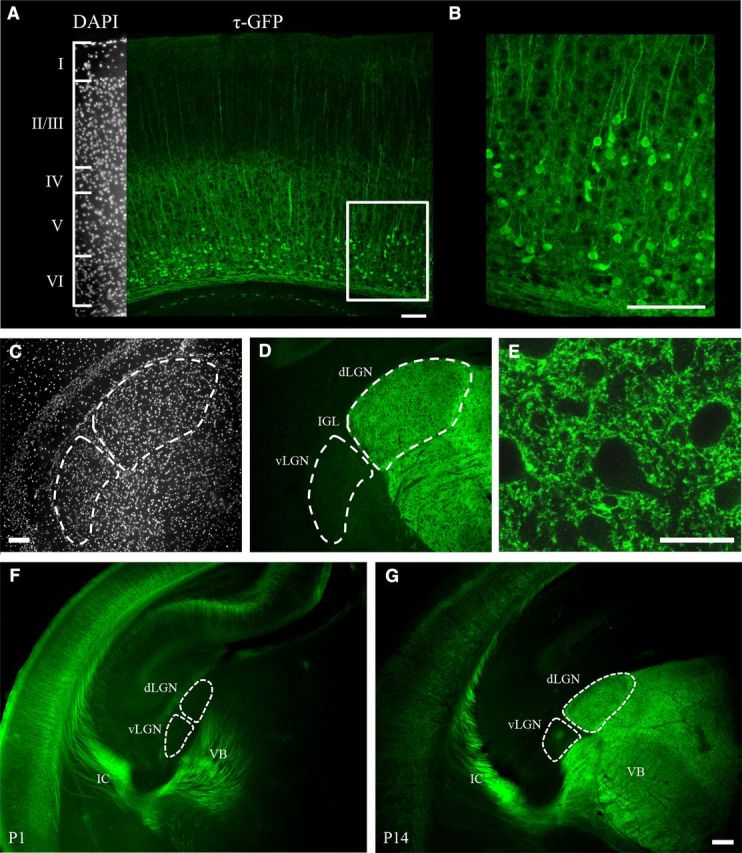
τ-GFP expression in neocortex and dLGN of golli-τ-GFP mice. A, Coronal section of visual cortex at P14 shows the distribution of neurons expressing τ-GFP (green). Inset on the far left is DAPI stain of the same section and is used to illustrate the boundaries of cortical layers. τ-GFP-labeled neurons are restricted to layer VI. B, High-power image of τ-GFP expressing neurons for the outlined area in A. C–E, Coronal section of dLGN in the same P14 mouse. C, DAPI delineates the boundaries of dLGN from other adjacent nuclei. D, Image showing the corresponding corticogeniculate axon arbors and terminals expressing τ-GFP. Note the lack of τ-GFP fluorescence in vLGN. IGL indicates intergeniculate leaflet. Scale bars, 100 μm. E, High-power confocal image of τ-GFP expression in dLGN from D. The areas lacking label are the locations of dLGN cell bodies. Scale bar, 20 μm. F,G, The pattern of cortical innervation in thalamus is shown in coronal sections from P1 (F) and P14 (G) golli-τ-GFP mice. F, At P1, τ-GFP corticothalamic fibers are depicted as they course through the internal capsule and innervate nuclei in the ventrolateral part of thalamus. Note the lack of innervation in dorsomedial regions of thalamus and dLGN. G, At P14, corticothalamic innervation appears complete. IC indicates internal capsule. Scale bar, 200 μm.
Figure 1F, G shows the pattern of cortical layer VI innervation of thalamus at P1 (Fig. 1F) and P14 (Fig. 1G). Descending projections can be seen coursing through the internal capsule and innervating thalamus in a ventrolateral to dorsomedial direction (Jacobs et al., 2007; Grant et al., 2012). For example, at P1, cortical projections were readily apparent in VB but absent in dLGN. By P14, corticothalamic projections occupied all of the dorsal thalamus.
To examine corticogeniculate innervation of dLGN in relation to the development of the retinogeniculate pathway, we labeled retinal axons originating from one or both eyes in golli-τ-GFP mice with CTB conjugated to Alexa Fluor 594 (red). Figure 2 and Figure 3 provide examples of coronal sections through one hemisphere of dLGN at different postnatal ages. At P1–P2, cortical fibers were seen along the ventromedial edge of dLGN (Fig. 2A, left, Fig. 3A, left). By contrast, retinal axons had already entered the dLGN (Fig. 2A, middle, Fig. 3A, middle), with the large majority of processes arising from the contralateral eye (i.e., crossed projections). Retinal axons arising from the ipsilateral eye (i.e., uncrossed projections) were sparsely distributed and limited to the dorsal region of dLGN (Fig. 3A, middle). At P3–P4, cortical axons began to innervate the ventromedial border of dLGN (Fig. 2B, left, Fig. 3B, left), whereas uncrossed retinal axons terminated more diffusely throughout the anteromedial region (Fig. 3B, middle). As uncrossed terminal fields began to recede to form an eye-specific patch (Fig. 3C–E, middle), cortical axons continued to innervate (Fig. 2C, left, Fig. 3C,D, left), reaching the most dorsal aspect of dLGN (beneath the optic tract) by the time of natural eye opening (P12; Godement et al., 1984; McNeill et al., 2011; Fig. 2D, left, Fig. 3E, left). The spatial extent of these projections, expressed as a percent area of dLGN, is summarized in Figure 4. At P1, retinal projections occupy approximately 63% of the total area of dLGN. By P2–P3, retinogeniculate innervation peaked to values as high as 85–95%. Although these values were maintained throughout postnatal development, the spatial extent of uncrossed terminal fields exhibited a substantial degree of remodeling (Jaubert-Miazza et al., 2005). For example, at P3, they occupied as much as 54% of dLGN, but then between P4 and P8, terminal fields began to recede to occupy 12–15% of dLGN. Cortical fibers began to innervate dLGN between P3 and P4 (5–15%) and progressed gradually until P12, when fibers finally extended throughout the entire nucleus. At P7, when retinogeniculate eye-specific segregation is nearly finished, ∼50% of the total area of dLGN was occupied by cortical fibers. By eye opening and well after the period of eye-specific segregation, corticogeniculate innervation was complete and occupied 92–94% of the total area of dLGN.
Figure 2.
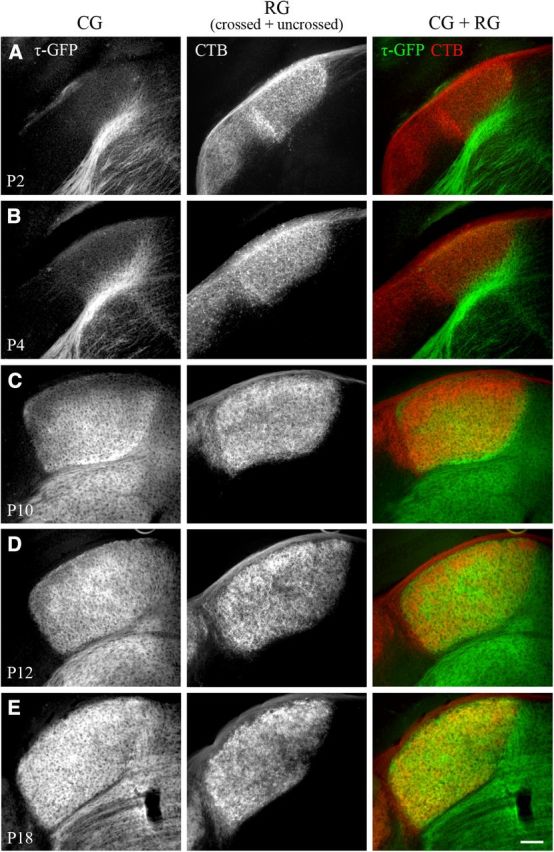
Innervation of dLGN by cortical and retinal projections. A–E, Coronal sections from golli-τ-GFP mice at different postnatal ages. Corticogeniculate projections were visualized with τ-GFP (left). Retinogeniculate projections were labeled by making eye injections of CTB conjugated to Alexa Fluor 594 in both eyes. Shown are the crossed and uncrossed retinal projections from one hemisphere of dLGN (middle). Right panel shows merged images of corticogeniculate (green) and retinogeniculate (red) projections. CG indicates corticogeniculate projections; RG, retinogeniculate projections. Scale bar, 100 μm.
Figure 3.
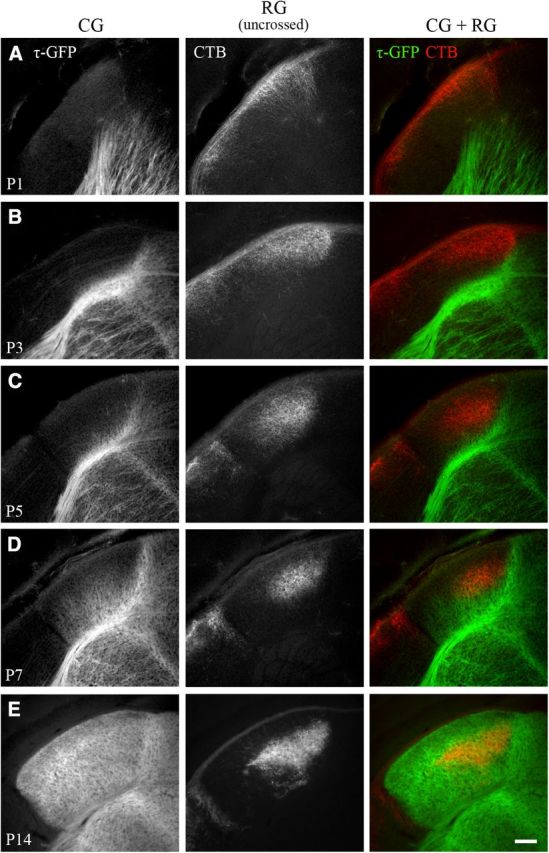
Innervation of dLGN by cortical and uncrossed retinal projections. A–E, Coronal sections from golli-τ-GFP mice at different postnatal ages. Corticogeniculate projections were visualized with τ-GFP (left). Retinogeniculate projections were labeled by making eye injections of CTB conjugated to Alexa Fluor 594 in one eye. Shown are the uncrossed retinal projections from one hemisphere of dLGN (middle). Right panel shows merged images of corticogeniculate (green) and uncrossed retinogeniculate (red) projections. CG inicates corticogeniculate projections; RG, retinogeniculate projections. Scale bar, 100 μm.
Figure 4.

Coordinated innervation of retinal and cortical projections in dLGN. Shown is a summary graph plotting the percent area in dLGN occupied by crossed and uncrossed retinogeniculate projections (red, filled circle), uncrossed retinogeniculate projections (red, open circle), and corticogeniculate projections (green, filled circle) as a function of age. Shown are means and SEMs (CTB, n = 2–6 hemispheres; GFP, n = 2–11). For each hemisphere, estimates of spatial extent were based on 3–5 successive 70-μm-thick sections through the middle of dLGN and are expressed as a percentage of the total area of dLGN. Corticogeniculate innervation was delayed compared with retinogeniculate innervation, with most of the innervation occurring after the recession and segregation of uncrossed retinogeniculate projections. Measurements of uncrossed retinogeniculate projections were obtained from wild-type C57BL/6 (n = 31 hemispheres) and golli-τ-GFP mice (n = 17 hemispheres). Because there was no difference in the spatial extent of ipsilateral retinogeniculate projections between these two strains (Kolmogorov–Smirnov, Z = 0.459, p = 1), data from both wild-type C57BL/6 and golli-τ-GFP mice were combined.
To determine when corticogeniculate synapses appear and mature, we first stained for vesicular glutamate transporter 1 (VGlut1), a vesicle-associated transporter (Bellocchio et al., 2000; Takamori et al., 2000; Wojcik et al., 2004) and known marker for corticogeniculate terminals within dLGN (Ni et al., 1995; Fujiyama et al., 2003; Land et al., 2004; Nakamura et al., 2005; Yoshida et al., 2009). Figure 5A–D shows VGlut1 immunofluorescence and τ-GFP expression in coronal sections of dLGN at P7 (Fig. 5A,B) and P14 (Fig. 5C,D). At P7, when approximately 50% of dLGN is innervated by corticogeniculate projections, little VGlut1 staining was apparent. At P14, there was robust staining for VGlut1 in dLGN that closely matched the spatial extent of τ-GFP expressing terminals.
To assess the functional state of corticogeniculate input to dLGN cells, we performed in vitro whole-cell recordings and measured the synaptic responses evoked by paired electrical pulses delivered to corticothalamic axons (Fig. 5E). Such protocols have been used to study paired pulse facilitation, a hallmark feature of mature corticothalamic synapses (Turner and Salt, 1998; Granseth et al., 2002; Alexander and Godwin, 2005). We studied paired pulse facilitation in a total of 35 cells at P7 (n = 10), P15–P16 (n = 10), and P21–P45 (n = 15). Figure 5F, G shows examples of EPSPs from the different age groups and the corresponding plots of the PPR at different ISIs. We found that at P7 in regions that exhibited τ-GFP expression, electrical stimulation of corticothalamic fibers readily evoked strong excitatory postsynaptic responses (83%, 10/12 cells). However, at this age, little if any facilitation was noted across a wide range of stimulus intervals. By P15, facilitation was prominent and resembled the adult profile with PPRs reaching a value of 2 or more (Granseth et al., 2002). At all ages, the largest degree of facilitation was observed with an ISI of 100 ms, consistent with results from others showing that shorter intervals (10–100 ms) yield the greatest degree of facilitation (Turner and Salt, 1998; Alexander and Godwin, 2005). The summary plot in Figure 5H shows the peak magnitude of paired pulse facilitation at an ISI of 100 ms during the first few postnatal weeks. The PPR was significantly higher at the second and third postnatal weeks compared with the first week (one-way ANOVA, F = 21.59, Bonferroni's post hoc test, p < 0.01). Finally, there was no significant difference in the amplitude of the first EPSP across the first few postnatal weeks (one-way ANOVA, F = 1.96, Bonferroni's post hoc test, p > 0.1; mean amplitude ± SEM; P7, 5.26 ± 1.38 mV; P15–P16, 3.60 ± 0.71 mV; P21–P45, 3.04 ± 0.38 mV; n = 10–15 cells for all groups), suggesting that the paired pulse facilitation is not likely brought about by a change in fiber excitability. These results suggest that functional corticogeniculate synapses are present during the early phase of innervation, but do not fully mature until sometime after the first postnatal week (Jurgens et al., 2012).
The coordination of retinal and cortical innervation of dLGN suggests that corticogeniculate innervation may be linked to the presence of retinogeniculate axons. To assess this, we examined the timing of corticogeniculate innervation in the absence of retinal input to dLGN. We used both binocular enucleation (BE) in golli-τ-GFP mice at birth and a form of genetic deafferentation in which golli-τ-GFP mice were crossed with math5−/− mutants. The deletion of math5, a transcription factor responsible for RGC differentiation, leads to a near complete loss of RGCs, the failure to form an optic nerve, and central targets that are devoid of retinal input (Brown et al., 2001; Wang et al., 2001; Wee et al., 2002; Brzezinski et al., 2005; Moshiri et al., 2008). Our rationale to employ the latter was to account for retinal signaling during embryonic ages (Godement et al., 1984) or inadvertent effects associated with mechanical damage or retinal degeneration (Eysel and Grüsser, 1978; Heumann and Rabinowicz, 1980; Dai et al., 2009; Lam et al., 2009). Figure 6A depicts coronal sections of dLGN from control, BE, and math5−/− mice showing corticogeniculate projections visualized with τ-GFP. Examples at P3 and P7 revealed that the removal of retinal input accelerated the rate of corticogeniculate innervation. At P3, in the absence of retinal input, cortical projections extended further into dLGN than in controls (Fig. 6A, top), and by P7, dLGN appeared to be completely innervated (Fig. 6A, bottom). These effects are summarized in the plot shown in Figure 6B, which compares the spatial extent of corticogeniculate projections in control, BE, and math5−/− mice at several postnatal ages. The rate of corticogeniculate innervation was significantly different in BE (Kolmogorov–Smirnov, Z = 1.442, p < 0.05) and math5−/− (Kolmogorov–Smirnov, Z = 1.525, p < 0.05) mice compared with controls. However, the experimental groups were not significantly different from each other (Kolmogorov–Smirnov, Z = 1.013, p > 0.2). In mice lacking retinal input, at P2–P3, there were clear signs of innervation with fibers occupying 5–25% of dLGN. Between P3 and P10, there was a substantial increase in the spatial extent of corticogeniculate innervation compared with controls. Most notable was the 2- to 3-fold increase during the first postnatal week. Between P10 and P14, innervation plateaued and the spatial extent was similar to controls (90–95%). Although the rate of innervation was affected, interareal targeting did not seem to be disrupted by the loss of retinal input, because τ-GFP expressing fibers continued to avoid the vLGN (Fig. 6A).
Figure 6.

Rate of corticogeniculate innervation in dLGN relies on retinogeniculate innervation. A, Coronal sections of dLGN showing corticogeniculate innervation (τ-GFP) at P3 (top) and P7 (bottom) in controls (left panels), after binocular enucleation (BE) at birth (middle panels), and in math5−/− mice (right panels). Scale bar, 100 μm. B, Summary graph plotting the mean percent area in dLGN occupied by corticogeniculate projections as a function of age in control (green), BE (magenta), and math5−/− (black) mice. Shown are means and SEMs (control, n = 4–11 hemispheres; BE, n = 4–12; math5−/−, n = 2–6). For each hemisphere, estimates of spatial extent were based on 3–5 successive 70-μm-thick sections through the middle of dLGN and are expressed as a percentage of the total area of dLGN. Compared with controls, the loss of retinal input accelerated the rate of corticogeniculate innervation. C, Summary graph for the multithreshold analysis plotting the mean percent area in dLGN occupied by corticogeniculate projections at P7 for control and math5−/− mice. Shown are means and SEMs (control, n = 5 hemispheres; math5−/−, n = 4).
To determine whether the difference in the spatial extent of corticogeniculate projections that we noted in the absence of retinal input was not due to the use of a single threshold value, we adopted a multithreshold approach. These results are summarized in the plot shown in Figure 6C, which compares the spatial extent of corticogeniculate projections in control and math5−/− mice at P7 using a range of threshold values that fell above and below the level of fluorescence measured in the cortex of control and experimental mice. Although the percent area of dLGN occupied by cortical projections varied at different threshold values, it was always significantly greater in math5−/− mice than in controls (one-way ANOVA, F = 24.40, Bonferroni's post hoc test, p < 0.02 for all comparisons), indicating that, even at different thresholds, mutants show an accelerated rate of innervation.
The comparisons described here for math5−/− and controls did not involve littermates, but instead aged-matched wild-type golli-τ-GFP mice. However, early on in the breeding process, we confirmed that wild-type littermates of our math5−/− mutants expressing τ-GFP had the same degree of corticogeniculate innervation as our control golli-τ-GFP mice. For example, at P2 and P7, wild-type littermates (golli-τ-GFP+/+/ math5+/+) had values of spatial extent that were virtually identical to those of golli-τ-GFP control mice (P2, mean 5.4 ± SEM 0.7%, n = 7; P7, mean 49.6 ± SDM 9.0%, n = 2).
To ensure that these changes could not be attributed to gross alterations in the overall size of dLGN potentially brought about by the removal of retinal input, we examined the area occupied by the pixels containing τ-GFP label. Indeed, we found a similar pattern in the rates of innervation, as shown in Figure 6B (Kolmogorov–Smirnov; control vs BE, Z = 2.403, p < 0.01; control vs math5−/−, Z = 1.442, p < 0.05; BE vs math5−/−, Z = 1.333, p > 0.05). For further confirmation, we examined the area of dLGN for math5−/− mice at representative ages spanning the first and second postnatal weeks in which there were large disparities in the rate of innervation (e.g., P6–P9) and found no significant differences in size between experimental (math5−/−) and control groups (t test, p > 0.05; mean area ± SEM; P6 control, 11.1 × 10⁴ ± 0.6 × 104 μm2 vs P6 math5−/−, 11.1 × 10⁴ ± 0.4 × 104 μm2; P7 control, 12.4 × 10⁴ ± 0.5 × 104 μm2 vs P7 math5−/−, 11.5 × 10⁴ ± 0.4 × 104 μm2; P8 control, 12.6 × 10⁴ ± 0.5 × 104 μm2 vs P8 math5−/−, 12.0 × 10⁴ ± 0.4 × 104 μm2; P9 control, 16.3 × 10⁴ ± 0.8 × 104 μm2 vs P9 math5−/−, 12.6 × 10⁴ ± 1.0 × 104 μm2; for all groups n = 3–11 hemispheres). During that time, there was also no significant difference in dLGN size of BE mice (one-way ANOVA, F = 2.77, Bonferroni's post hoc test, p > 0.1; mean area ± SEM; P7 control, 12.4 × 10⁴ ± 0.5 × 104 μm2 vs P7 math5−/−, 11.5 × 10⁴ ± 0.4 × 104 μm2 vs P7 BE, 11.3 × 10⁴ ± 0.2 × 104 μm2; for all groups n = 6–10 hemispheres, but see Heumann and Rabinowicz, 1980). These observations suggest that the reported differences in the percentage of dLGN territory occupied by corticogeniculate projections were not due to a change in the size of dLGN.
We also examined whether the accelerated innervation noted in the math5−/− mice influenced the timing of corticogeniculate synapse maturation. Figure 7A–D shows VGlut1 staining and τ-GFP expression in coronal sections of math5−/− dLGN at P7 (Fig. 7A,B) and P14 (Fig. 7C,D). At P7, a time when cortical inputs occupy nearly the entire dLGN, little VGlut1 staining was apparent in math5−/− mice and looked similar to the weak expression pattern noted in age-matched controls (Fig. 5A,B vs Fig. 7A,B). By P14, staining for VGlut1 in math5−/− dLGN was robust and closely matched levels detected in controls (Fig. 5C,D vs Fig. 7C,D). We also conducted whole-cell recordings in P7 and P14 mutants and examples of synaptic responses evoked by the delivery of paired pulse stimuli are shown in Figure 7E, F. As in controls, we were able to evoke strong postsynaptic activity in nearly all cells tested and found that facilitation emerged at the same time as noted in controls. Indeed, PPR values measured at an ISI of 100 ms were not significantly different from their age-matched controls (t test, p > 0.5; mean PPR ± SEM; P7 control, 1.50 ± 0.13 vs P7 math5−/−, 1.65 ± 0.22; P15-P16 control, 2.45 ± 0.18 vs P14 math5−/−, 2.15 ± 0.50; for all groups n = 6–15 cells). These data suggest that the increased rate of cortical innervation brought about by the elimination of retinal input did not appear to affect the maturation of corticogeniculate synapses.
Figure 7.

Development of functional corticogeniculate synapses in dLGN in the absence of retinal input. A–D, Coronal sections from P7 (A,B) and P14 (C,D) math5−/− mice showing VGlut1 staining and τ-GFP in dLGN. Left panels in A and C show merged images of τ-GFP (green) and VGlut1 (red). τ-GFP and VGlut1 are shown separately in the middle and right panels. Scale bar, 200 μm. B, D, High-magnification confocal images of VGlut1 staining from dLGN in A and C. Scale bar, 35 μm. The expression pattern of VGlut1 in math5−/− mice at P7 and P14 is comparable to that seen for age-matched controls (Fig. 5A–D). E, F, Example of EPSPs evoked by paired electrical pulses delivered to corticothalamic fibers in cells from math5−/− mice at P7 (E) and P14 (F).
Finally, we explored whether the rate of cortical innervation was affected by the partial loss of retinal input by performing monocular enucleation (ME). Such a perturbation not only reduces the total amount of retinal input to dLGN, but also disrupts the recession of uncrossed retinal projections, because ME leads to an expansion of projections from the spared eye (Lund et al., 1973; So et al., 1978; Manford et al., 1984; Hayakawa and Kawasaki, 2010). Figure 8A shows examples of coronal sections through both hemispheres of dLGN at P3 and P7 after ME at birth. Cortical projections are labeled by τ-GFP (Fig. 8A, bottom), whereas CTB was used to label projections from the spared eye (Fig. 8A, top). Figure 8B shows a summary plot comparing the percent area of dLGN occupied by corticogeniculate projections in control, BE, and both hemispheres of ME mice at P3, P4, P5, and P7. Similar to the effects associated with the removal of retinal input from both eyes, we noted that, after ME, the rate of corticogeniculate innervation was accelerated. However, such acceleration was restricted to dLGN contralateral to the enucleated eye (Kolmogorov–Smirnov, Z = 1.886, p < 0.01), where the spatial extent of retinal projections was significantly reduced by the removal of crossed retinal projections (control, 86–90% vs ME, 38–59%; Kolmogorov–Smirnov, Z = 2.236, p < 0.001; data not shown). Indeed, the spatial extent of corticogeniculate projections in this hemisphere was comparable to values seen after BE (Kolmogorov–Smirnov, Z = 0.586, p > 0.5). In contrast, there was no significant difference in the spatial extent of corticogeniculate projections occupying dLGN in the hemisphere ipsilateral to the enucleated eye compared with controls (Kolmogorov–Smirnov, Z = 1.296, p > 0.05). Ipsilateral to the enucleated eye, the spatial extent of retinal projections remained comparable to controls (control, 86–90% vs ME, 76–85%; Kolmogorov–Smirnov, Z = 1.342, p > 0.5; data not shown) due to the sparing of crossed retinal projections. Therefore, an accelerated rate of corticogeniculate innervation was limited to the hemisphere contralateral to the enucleated eye, the side where the majority of retinogeniculate projections were eliminated.
Figure 8.

Effects of monocular enucleation on the rate of corticogeniculate innervation in dLGN. A, Coronal sections showing both hemispheres from P3 (left) and P7 (right) golli-τ-GFP mice after ME at birth. One eye was removed and the spared eye was injected with CTB. The schematic above the panels depicts the spared (red) and removed (gray) eyes in relation to crossed and uncrossed projections in hemispheres of dLGN contralateral (contra) and ipsilateral (ipsi) to the enucleated eye. Top: CTB-labeled retinogeniculate projections from the remaining eye. Bottom: Corticogeniculate projections (τ-GFP). Scale bar, 100 μm. B, Summary graph plotting the mean percent area in dLGN occupied by corticogeniculate projections as a function of age in control (green), binocularly enucleated (BE, magenta, see also Fig. 6B), and monocularly enucleated mice (dLGN contralateral to the enucleated eye, ME (contra), dark gray; dLGN contralateral to the spared eye, ME (ipsi), gray). Shown are means and SEMs (control, n = 5–8 hemispheres; BE, n = 4–12; ME, n = 2–5). For each hemisphere, estimates of spatial extent were based on 3–5 successive 70-μm-thick sections through the middle of dLGN and are expressed as a percentage of the total area of dLGN. Accelerated corticogeniculate innervation was evident in the hemisphere contralateral to the enucleated eye, where uncrossed retinogeniculate projections are spared. Corticogeniculate innervation in dLGN ipsilateral to the enucleated eye was similar to controls.
Discussion
Although retinal innervation of dLGN occurs at perinatal ages (Godement et al., 1984; McNeill et al., 2011), our results revealed that corticogeniculate innervation takes place over the first 2 weeks of postnatal life, with the vast majority of input arriving after the period of eye-specific segregation. Such delay is consistent with our ultrastructural analysis of synapse development in dLGN, which showed that connections between nonretinal inputs and dLGN cells emerge sometime after the second postnatal week, after the period of initial retinal synapse formation and pruning (Bickford et al., 2010). A similar sequence is also apparent in other mammalian species, including macaque, cat, and ferret (Anker, 1977; Shatz and Rakic, 1981; Clascá et al., 1995), suggesting that the coordination of retinal and cortical innervation of dLGN is part of a conserved developmental plan in which the retinogeniculate pathway is established before the innervation and formation of nonretinal connections. Whether such an arrangement applies to other first-order sensory thalamic nuclei remains to be tested (Grant et al., 2012).
We also noted that corticogeniculate synapses become functional shortly after their axons arrive in dLGN. However, the absence of response facilitation to paired stimulation at early ages suggests that functional corticogeniculate synapses did not fully mature until innervation was complete. This increase in facilitation likely reflects the development of processes that regulate the synaptic vesicle cycle (Mohrmann et al., 2003; Sudhof, 2004; Wilson et al., 2005) and could perhaps explain the increase in VGlut1 staining that we observed with age. Indeed, similar trends in VGlut expression have been reported in other systems at ages when functional excitatory transmission emerges (Sherry et al., 2003; Nakamura et al., 2005; Wilson et al., 2005; Stella et al., 2008; Marcucci et al., 2009; Koch et al., 2011; Singh et al., 2012).
In addition to filling synaptic vesicles with glutamate, VGlut1 plays a role in lowering the probability of neurotransmitter release by interacting with endophilin (Weston et al., 2011). As VGlut1 accumulates in cortical terminals in dLGN, it may lower the initial probability of release and, as a result, lead to an increase in amplitude of response to subsequent stimulation. The late arrival and maturation of corticogeniculate connections is especially relevant when one considers that visual information processing does not occur until natural eye opening, a time when intrinsic spontaneous retinal activity subsides and visually evoked events emerge (Huberman et al., 2008). Put in the broader context of thalamic function, it would appear that circuits involved in the modulation of retinogeniculate signal transmission occur well after the establishment of retinal inputs, which provide the primary excitatory drive for relay cells.
Although our results reveal the timing of structural and functional corticogeniculate connections in dLGN, the molecular mechanisms underlying their targeting and entry remain unknown. To date, the focus has been on the molecules involved in the guidance of cortical axons to thalamus, and the manner in which axons are directed to specific thalamic nuclei as well as the appropriate areas within those nuclei have yet to be fully elucidated (Grant et al., 2012). Perhaps the best candidate is the Eph receptor family and their ligands, the ephrins, which have been implicated in the establishment of corticothalamic topography in dorsal thalamic nuclei such as VB (Torii and Levitt, 2005; Torii et al., 2013). Whether ephrins play a similar role in dLGN remains unclear. Even less is known about the molecular mechanisms underlying the timing of corticogeniculate innervation. One potential candidate involves Robo receptors, which reside on early developing cortical axons (López-Bendito et al., 2007). Indeed, in the absence of the receptor subtype Robo1, corticothalamic axons reach thalamus prematurely, arriving at least 1 d earlier than normal (Andrews et al., 2006).
Although the mechanisms regulating the temporal dynamics of corticogeniculate innervation have yet to be elucidated, our results suggest the involvement of retinal signaling. Both our binocular enucleation and genetic deafferentation experiments reveal that the elimination of retinal input leads to an accelerated rate of corticogeniculate innervation. Interestingly, the partial loss of retinal input brought about by ME suggests a threshold of retinal signaling is needed. For example, the removal of the contralateral eye leads to a net loss of about 44% of all retinal terminal innervation in dLGN, a value that seems sufficient to accelerate cortical innervation. In contrast, the removal of the ipsilateral eye results in an ∼8% net loss, which seems insufficient to affect cortical innervation. It is also conceivable that disrupting the process of eye-specific segregation could be a contributing factor, because early postnatal ME leads to the expansion of retinal projections from the spared eye (Lund et al., 1973; So et al., 1978; Manford et al., 1984; Hayakawa and Kawasaki, 2010); however, this seems unlikely because segregation is interrupted in both hemispheres by ME but only the hemisphere, which incurs the greatest loss of retinal input, seems affected.
An intriguing finding from our genetic deafferentation experiments is that the elimination of retinal input to dLGN does not appear to alter corticogeniculate synapse maturation. Both VGlut1 labeling and the degree of paired pulse facilitation noted in the synaptic responses of math5−/− mice showed a progressive increase between the first and second postnatal weeks. Therefore, the presence of retinal inputs at early ages, while altering the rate of cortical innervation, does not appear to have an impact on corticogeniculate synapse maturation. Such a result reinforces the notion that these developmental steps in circuit formation are separable and raises interesting questions regarding the mechanisms underlying the timing of synaptic maturation (Fox and Umemori, 2006; Marcucci et al., 2009; Singh et al., 2012).
A question that still remains is whether the acceleration in cortical innervation brought about by the removal of retinal input is related to a loss of neural activity or if it is simply the disruption of a repulsive cue that serves to gate the rate of innervation. Typically, activity seems to play a role in the remodeling and refinement of projections (Goodman and Shatz, 1993; Huberman et al., 2008), but there are a number of examples in which alterations in activity can regulate axonal innervation and targeting (Catalano and Shatz, 1998; Anderson and Price, 2002; Hanson and Landmesser, 2004, 2006; Mizuno et al., 2007; Salcedo et al., 2011). Whether such a process involves a modification in repulsive signaling directly via the removal of retinal axons or indirectly through interactions involving neurons, glia, or elements within the neuropil intrinsic to dLGN also remains to be determined (Sanes and Yamagata, 2009; Raper and Mason, 2010).
In summary, our results reveal that axonal innervation and synapse formation in dLGN occurs in a coordinated manner and suggest that input from sensory peripheral sources regulates the timing of convergent modulatory projections. These studies also provide a valuable framework for future investigation designed to explore the underlying molecular cues and activity-dependent factors involved in directing circuit formation in the dorsal visual thalamus.
Footnotes
This project was supported by the National Institutes of Health (Grant #EY012716 to W.G. and Grant #EY021222 to M.A.F.). The golli-τ-GFP mice were generously provided by A.T. Campagnoni and the math5−/− strain by S.W. Wang. The monoclonal antibody VGlut1 was obtained from the University of California–Davis/National Institutes of Health NeuroMab Facility, which is supported by National Institutes of Health Grant #U24NS050606 and maintained by the Department of Neurobiology, Physiology, and Behavior, College of Biological Sciences, University of California–Davis. We thank Natasha Sheybani for technical assistance.
The authors declare no competing financial interests.
References
- Alexander GM, Godwin DW. Presynaptic inhibition of corticothalamic feedback by metabotropic glutamate receptors. J Neurophysiol. 2005;94:163–175. doi: 10.1152/jn.01198.2004. [DOI] [PubMed] [Google Scholar]
- Anderson G, Price DJ. Layer-specific thalamocortical innervation in organotypic cultures is prevented by substances that alter neural activity. Eur J Neurosci. 2002;16:345–349. doi: 10.1046/j.1460-9568.2002.02069.x. [DOI] [PubMed] [Google Scholar]
- Andrews W, Liapi A, Plachez C, Camurri L, Zhang J, Mori S, Murakami F, Parnavelas JG, Sundaresan V, Richards LJ. Robo1 regulates the development of major axon tracts and interneuron migration in the forebrain. Development. 2006;133:2243–2252. doi: 10.1242/dev.02379. [DOI] [PubMed] [Google Scholar]
- Anker RL. The prenatal development of some of the visual pathways in the cat. J Comp Neurol. 1977;173:185–204. doi: 10.1002/cne.901730111. [DOI] [PubMed] [Google Scholar]
- Bellocchio EE, Reimer RJ, Fremeau RT, Jr, Edwards RH. Uptake of glutamate into synaptic vesicles by an inorganic phosphate transporter. Science. 2000;289:957–960. doi: 10.1126/science.289.5481.957. [DOI] [PubMed] [Google Scholar]
- Bickford ME, Slusarczyk A, Dilger EK, Krahe TE, Kucuk C, Guido W. Synaptic development of the mouse dorsal lateral geniculate nucleus. J Comp Neurol. 2010;518:622–635. doi: 10.1002/cne.22223. [DOI] [PMC free article] [PubMed] [Google Scholar]
- Bourassa J, Deschênes M. Corticothalamic projections from the primary visual cortex in rats: a single fiber study using biocytin as an anterograde tracer. Neuroscience. 1995;66:253–263. doi: 10.1016/0306-4522(95)00009-8. [DOI] [PubMed] [Google Scholar]
- Briggs F, Usrey WM. Emerging views of corticothalamic function. Curr Opin Neurobiol. 2008;18:403–407. doi: 10.1016/j.conb.2008.09.002. [DOI] [PMC free article] [PubMed] [Google Scholar]
- Brown NL, Kanekar S, Vetter ML, Tucker PK, Gemza DL, Glaser T. Math5 encodes a murine basic helix-loop-helix transcription factor expressed during early stages of retinal neurogenesis. Development. 1998;125:4821–4833. doi: 10.1242/dev.125.23.4821. [DOI] [PubMed] [Google Scholar]
- Brown NL, Patel S, Brzezinski J, Glaser T. Math5 is required for retinal ganglion cell and optic nerve formation. Development. 2001;128:2497–2508. doi: 10.1242/dev.128.13.2497. [DOI] [PMC free article] [PubMed] [Google Scholar]
- Brzezinski JA, 4th, Brown NL, Tanikawa A, Bush RA, Sieving PA, Vitaterna MH, Takahashi JS, Glaser T. Loss of circadian photoentrainment and abnormal retinal electrophysiology in Math5 mutant mice. Invest Ophthalmol Vis Sci. 2005;46:2540–2551. doi: 10.1167/iovs.04-1123. [DOI] [PMC free article] [PubMed] [Google Scholar]
- Catalano SM, Shatz CJ. Activity-dependent cortical target selection by thalamic axons. Science. 1998;281:559–562. doi: 10.1126/science.281.5376.559. [DOI] [PubMed] [Google Scholar]
- Clascá F, Angelucci A, Sur M. Layer-specific programs of development in neocortical projection neurons. Proc Natl Acad Sci U S A. 1995;92:11145–11149. doi: 10.1073/pnas.92.24.11145. [DOI] [PMC free article] [PubMed] [Google Scholar]
- Cosenza RM, Moore RY. Afferent connections of the ventral lateral geniculate nucleus in the rat: an HRP study. Brain Res. 1984;310:367–370. doi: 10.1016/0006-8993(84)90162-8. [DOI] [PubMed] [Google Scholar]
- Dai Y, Sun X, Chen Q. Differential induction of c-Fos and c-Jun in the lateral geniculate nucleus of rats following unilateral optic nerve injury with contralateral retinal blockade. Exp Brain Res. 2009;193:9–18. doi: 10.1007/s00221-008-1591-6. [DOI] [PubMed] [Google Scholar]
- Demas J, Sagdullaev BT, Green E, Jaubert-Miazza L, McCall MA, Gregg RG, Wong RO, Guido W. Failure to maintain eye-specific segregation in nob, a mutant with abnormally patterned retinal activity. Neuron. 2006;50:247–259. doi: 10.1016/j.neuron.2006.03.033. [DOI] [PubMed] [Google Scholar]
- Erișir A, Van Horn SC, Bickford ME, Sherman SM. Immunocytochemistry and distribution of parabrachial terminals in the lateral geniculate nucleus of the cat: A comparison with corticogeniculate terminals. J Comp Neurol. 1997a;377:535–549. doi: 10.1002/(SICI)1096-9861(19970127)377:4<535::AID-CNE5>3.0.CO%3B2-3. [DOI] [PubMed] [Google Scholar]
- Erișir A, Van Horn SC, Sherman SM. Relative numbers of cortical and brainstem inputs to the lateral geniculate nucleus. Proc Natl Acad Sci U S A. 1997b;94:1517–1520. doi: 10.1073/pnas.94.4.1517. [DOI] [PMC free article] [PubMed] [Google Scholar]
- Eysel UT, Grüsser OJ. Increased transneuronal excitation of the cat lateral geniculate nucleus after acute deafferentation. Brain Res. 1978;158:107–128. doi: 10.1016/0006-8993(78)90009-4. [DOI] [PubMed] [Google Scholar]
- Fox MA, Umemori H. Seeking long-term relationship: axon and target communicate to organize synaptic differentiation. J Neurochem. 2006;97:1215–1231. doi: 10.1111/j.1471-4159.2006.03834.x. [DOI] [PubMed] [Google Scholar]
- Fujiyama F, Hioki H, Tomioka R, Taki K, Tamamaki N, Nomura S, Okamoto K, Kaneko T. Changes of immunocytochemical localization of vesicular glutamate transporters in the rat visual system after the retinofugal denervation. J Comp Neurol. 2003;465:234–249. doi: 10.1002/cne.10848. [DOI] [PubMed] [Google Scholar]
- Godement P, Salaün J, Imbert M. Prenatal and postnatal development of retinogeniculate and retinocollicular projections in the mouse. J Comp Neurol. 1984;230:552–575. doi: 10.1002/cne.902300406. [DOI] [PubMed] [Google Scholar]
- Goodman CS, Shatz CJ. Developmental mechanisms that generate precise patterns of neuronal connectivity. Cell. 1993;72:77–98. doi: 10.1016/S0092-8674(05)80030-3. [DOI] [PubMed] [Google Scholar]
- Granseth B, Lindström S. Unitary EPSCs of corticogeniculate fibers in the rat dorsal lateral geniculate nucleus in vitro. J Neurophysiol. 2003;89:2952–2960. doi: 10.1152/jn.01160.2002. [DOI] [PubMed] [Google Scholar]
- Granseth B, Ahlstrand E, Lindström S. Paired pulse facilitation of corticogeniculate EPSCs in the dorsal lateral geniculate nucleus of the rat investigated in vitro. J Physiol. 2002;544:477–486. doi: 10.1113/jphysiol.2002.024703. [DOI] [PMC free article] [PubMed] [Google Scholar]
- Grant E, Hoerder-Suabedissen A, Molnár Z. Development of the corticothalamic projections. Front Neurosci. 2012;6:53. doi: 10.3389/fnins.2012.00053. [DOI] [PMC free article] [PubMed] [Google Scholar]
- Hanson MG, Landmesser LT. Normal patterns of spontaneous activity are required for correct motor axon guidance and the expression of specific guidance molecules. Neuron. 2004;43:687–701. doi: 10.1016/j.neuron.2004.08.018. [DOI] [PubMed] [Google Scholar]
- Hanson MG, Landmesser LT. Increasing the frequency of spontaneous rhythmic activity disrupts pool-specific axon fasciculation and pathfinding of embryonic spinal motoneurons. J Neurosci. 2006;26:12769–12780. doi: 10.1523/JNEUROSCI.4170-06.2006. [DOI] [PMC free article] [PubMed] [Google Scholar]
- Hayakawa I, Kawasaki H. Rearrangement of retinogeniculate projection patterns after eye-specific segregation in mice. PLoS One. 2010;5:e11001. doi: 10.1371/journal.pone.0011001. [DOI] [PMC free article] [PubMed] [Google Scholar]
- Heumann D, Rabinowicz T. Postnatal development of the dorsal lateral geniculate nucleus in the normal and enucleated albino mouse. Exp Brain Res. 1980;38:75–85. doi: 10.1007/BF00237933. [DOI] [PubMed] [Google Scholar]
- Huberman AD, Feller MB, Chapman B. Mechanisms underlying development of visual maps and receptive fields. Annu Rev Neurosci. 2008;31:479–509. doi: 10.1146/annurev.neuro.31.060407.125533. [DOI] [PMC free article] [PubMed] [Google Scholar]
- Jacobs EC, Campagnoni C, Kampf K, Reyes SD, Kalra V, Handley V, Xie YY, Hong-Hu Y, Spreur V, Fisher RS, Campagnoni AT. Visualization of corticofugal projections during early cortical development in a tau-GFP-transgenic mouse. Eur J Neurosci. 2007;25:17–30. doi: 10.1111/j.1460-9568.2006.05258.x. [DOI] [PubMed] [Google Scholar]
- Jaubert-Miazza L, Green E, Lo FS, Bui K, Mills J, Guido W. Structural and functional composition of the developing retinogeniculate pathway in the mouse. Vis Neurosci. 2005;22:661–676. doi: 10.1017/S0952523805225154. [DOI] [PubMed] [Google Scholar]
- Jurgens CW, Bell KA, McQuiston AR, Guido W. Optogenetic stimulation of the corticothalamic pathway affects relay cells and GABAergic neurons differently in the mouse visual thalamus. PLoS One. 2012;7:e45717. doi: 10.1371/journal.pone.0045717. [DOI] [PMC free article] [PubMed] [Google Scholar]
- Kielland A, Erisir A, Walaas SI, Heggelund P. Synapsin utilization differs among functional classes of synapses on thalamocortical cells. J Neurosci. 2006;26:5786–5793. doi: 10.1523/JNEUROSCI.4631-05.2006. [DOI] [PMC free article] [PubMed] [Google Scholar]
- Koch SM, Dela Cruz CG, Hnasko TS, Edwards RH, Huberman AD, Ullian EM. Pathway-specific genetic attenuation of glutamate release alters select features of competition-based visual circuit refinement. Neuron. 2011;71:235–242. doi: 10.1016/j.neuron.2011.05.045. [DOI] [PMC free article] [PubMed] [Google Scholar]
- Krahe TE, Guido W. Homeostatic plasticity in the visual thalamus by monocular deprivation. J Neurosci. 2011;31:6842–6849. doi: 10.1523/JNEUROSCI.1173-11.2011. [DOI] [PMC free article] [PubMed] [Google Scholar]
- Lam D, Jim J, To E, Rasmussen C, Kaufman PL, Matsubara J. Astrocyte and microglial activation in the lateral geniculate nucleus and visual cortex of glaucomatous and optic nerve transected primates. Mol Vis. 2009;15:2217–2229. [PMC free article] [PubMed] [Google Scholar]
- Land PW, Kyonka E, Shamalla-Hannah L. Vesicular glutamate transporters in the lateral geniculate nucleus: expression of VGLUT2 by retinal terminals. Brain Res. 2004;996:251–254. doi: 10.1016/j.brainres.2003.10.032. [DOI] [PubMed] [Google Scholar]
- López-Bendito G, Flames N, Ma L, Fouquet C, Di Meglio T, Chedotal A, Tessier-Lavigne M, Marín O. Robo1 and Robo2 cooperate to control the guidance of major axonal tracts in the mammalian forebrain. J Neurosci. 2007;27:3395–3407. doi: 10.1523/JNEUROSCI.4605-06.2007. [DOI] [PMC free article] [PubMed] [Google Scholar]
- Lund RD, Cunningham TJ, Lund JS. Modified optic projections after unilateral eye removal in young rats. Brain Behav Evol. 1973;8:51–72. doi: 10.1159/000124347. [DOI] [PubMed] [Google Scholar]
- Manford M, Campbell G, Lieberman AR. Postnatal development of ipsilateral retino-geniculate projections in normal albino rats and the effects of removal of one eye at birth. Anat Embryol. 1984;170:71–78. doi: 10.1007/BF00319460. [DOI] [PubMed] [Google Scholar]
- Marcucci F, Zou DJ, Firestein S. Sequential onset of presynaptic molecules during olfactory sensory neuron maturation. J Comp Neurol. 2009;516:187–198. doi: 10.1002/cne.22094. [DOI] [PMC free article] [PubMed] [Google Scholar]
- McNeill DS, Sheely CJ, Ecker JL, Badea TC, Morhardt D, Guido W, Hattar S. Development of melanopsin-based irradiance detecting circuitry. Neural Dev. 2011;6:8. doi: 10.1186/1749-8104-6-8. [DOI] [PMC free article] [PubMed] [Google Scholar]
- Mizuno H, Hirano T, Tagawa Y. Evidence for activity-dependent cortical wiring: formation of interhemispheric connections in neonatal mouse visual cortex requires projection neuron activity. J Neurosci. 2007;27:6760–6770. doi: 10.1523/JNEUROSCI.1215-07.2007. [DOI] [PMC free article] [PubMed] [Google Scholar]
- Mohrmann R, Lessmann V, Gottmann K. Developmental maturation of synaptic vesicle cycling as a distinctive feature of central glutamatergic synapses. Neuroscience. 2003;117:7–18. doi: 10.1016/S0306-4522(02)00835-7. [DOI] [PubMed] [Google Scholar]
- Moshiri A, Gonzalez E, Tagawa K, Maeda H, Wang M, Frishman LJ, Wang SW. Near complete loss of retinal ganglion cells in the math5/brn3b double knockout elicits severe reductions of other cell types during retinal development. Dev Biol. 2008;316:214–227. doi: 10.1016/j.ydbio.2008.01.015. [DOI] [PMC free article] [PubMed] [Google Scholar]
- Nakamura K, Hioki H, Fujiyama F, Kaneko T. Postnatal changes of vesicular glutamate transporter (VGluT)1 and VGluT2 immunoreactivities and their colocalization in the mouse forebrain. J Comp Neurol. 2005;492:263–288. doi: 10.1002/cne.20705. [DOI] [PubMed] [Google Scholar]
- Ni B, Wu X, Yan GM, Wang J, Paul SM. Regional expression and cellular localization of the Na+-dependent inorganic phosphate cotransporter of rat brain. J Neurosci. 1995;15:5789–5799. doi: 10.1523/JNEUROSCI.15-08-05789.1995. [DOI] [PMC free article] [PubMed] [Google Scholar]
- Raper J, Mason C. Cellular strategies of axonal pathfinding. Cold Spring Harb Perspect Biol. 2010;2:a001933. doi: 10.1101/cshperspect.a001933. [DOI] [PMC free article] [PubMed] [Google Scholar]
- Salcedo E, Tran T, Ly X, Lopez R, Barbica C, Restrepo D, Vijayaraghavan S. Activity-dependent changes in cholinergic innervation of the mouse olfactory bulb. PLoS One. 2011;6:e25441. doi: 10.1371/journal.pone.0025441. [DOI] [PMC free article] [PubMed] [Google Scholar]
- Sanes JR, Yamagata M. Many paths to synaptic specificity. Annu Rev Cell Dev Biol. 2009;25:161–195. doi: 10.1146/annurev.cellbio.24.110707.175402. [DOI] [PubMed] [Google Scholar]
- Shatz CJ, Rakic P. The genesis of efferent connections from the visual cortex of the fetal rhesus monkey. J Comp Neurol. 1981;196:287–307. doi: 10.1002/cne.901960208. [DOI] [PubMed] [Google Scholar]
- Sherman SM, Guillery RW. The role of the thalamus in the flow of information to the cortex. Philos Trans R Soc Lond B Biol Sci. 2002;357:1695–1708. doi: 10.1098/rstb.2002.1161. [DOI] [PMC free article] [PubMed] [Google Scholar]
- Sherry DM, Wang MM, Bates J, Frishman LJ. Expression of vesicular glutamate transporter 1 in the mouse retina reveals temporal ordering in development of rod vs. cone and ON vs. OFF circuits. J Comp Neurol. 2003;465:480–498. doi: 10.1002/cne.10838. [DOI] [PubMed] [Google Scholar]
- Singh R, Su J, Brooks J, Terauchi A, Umemori H, Fox MA. Fibroblast growth factor 22 contributes to the development of retinal nerve terminals in the dorsal lateral geniculate nucleus. Front Mol Neurosci. 2012;4:61. doi: 10.3389/fnmol.2011.00061. [DOI] [PMC free article] [PubMed] [Google Scholar]
- So KF, Schneider GE, Frost DO. Postnatal development of retinal projections to the lateral geniculate body in Syrian hamsters. Brain Res. 1978;142:343–352. doi: 10.1016/0006-8993(78)90641-8. [DOI] [PubMed] [Google Scholar]
- Stella SL, Jr, Li S, Sabatini A, Vila A, Brecha NC. Comparison of the ontogeny of the vesicular glutamate transporter 3 (VGLUT3) with VGLUT1 and VGLUT2 in the rat retina. Brain Res. 2008;1215:20–29. doi: 10.1016/j.brainres.2008.03.038. [DOI] [PMC free article] [PubMed] [Google Scholar]
- Sudhof TC. The synaptic vesicle cycle. Annu Rev Neurosci. 2004;27:509–547. doi: 10.1146/annurev.neuro.26.041002.131412. [DOI] [PubMed] [Google Scholar]
- Takamori S, Rhee JS, Rosenmund C, Jahn R. Identification of a vesicular glutamate transporter that defines a glutamatergic phenotype in neurons. Nature. 2000;407:189–194. doi: 10.1038/35025070. [DOI] [PubMed] [Google Scholar]
- Torborg CL, Feller MB. Unbiased analysis of bulk axonal segregation patterns. J Neurosci Methods. 2004;135:17–26. doi: 10.1016/j.jneumeth.2003.11.019. [DOI] [PubMed] [Google Scholar]
- Torii M, Levitt P. Dissociation of corticothalamic and thalamocortical axon targeting by an EphA7-mediated mechanism. Neuron. 2005;48:563–575. doi: 10.1016/j.neuron.2005.09.021. [DOI] [PubMed] [Google Scholar]
- Torii M, Rakic P, Levitt P. Role of EphA/ephrin-A signaling in the development of topographic maps in mouse corticothalamic projections. J Comp Neurol. 2013;521:626–637. doi: 10.1002/cne.23195. [DOI] [PMC free article] [PubMed] [Google Scholar]
- Turner JP, Salt TE. Characterization of sensory and corticothalamic excitatory inputs to rat thalamocortical neurones in vitro. J Physiol. 1998;510:829–843. doi: 10.1111/j.1469-7793.1998.829bj.x. [DOI] [PMC free article] [PubMed] [Google Scholar]
- Wang SW, Kim BS, Ding K, Wang H, Sun D, Johnson RL, Klein WH, Gan L. Requirement for math5 in the development of retinal ganglion cells. Genes Dev. 2001;15:24–29. doi: 10.1101/gad.855301. [DOI] [PMC free article] [PubMed] [Google Scholar]
- Wee R, Castrucci AM, Provencio I, Gan L, Van Gelder RN. Loss of photic entrainment and altered free-running circadian rhythms in math5−/− mice. J Neurosci. 2002;22:10427–10433. doi: 10.1523/JNEUROSCI.22-23-10427.2002. [DOI] [PMC free article] [PubMed] [Google Scholar]
- Weston MC, Nehring RB, Wojcik SM, Rosenmund C. Interplay between VGLUT isoforms and endophilin A1 regulates neurotransmitter release and short-term plasticity. Neuron. 2011;69:1147–1159. doi: 10.1016/j.neuron.2011.02.002. [DOI] [PubMed] [Google Scholar]
- Wilson NR, Kang J, Hueske EV, Leung T, Varoqui H, Murnick JG, Erickson JD, Liu G. Presynaptic regulation of quantal size by the vesicular glutamate transporter VGLUT1. J Neurosci. 2005;25:6221–6234. doi: 10.1523/JNEUROSCI.3003-04.2005. [DOI] [PMC free article] [PubMed] [Google Scholar]
- Wojcik SM, Rhee JS, Herzog E, Sigler A, Jahn R, Takamori S, Brose N, Rosenmund C. An essential role for vesicular glutamate transporter 1 (VGLUT1) in postnatal development and control of quantal size. Proc Natl Acad Sci U S A. 2004;101:7158–7163. doi: 10.1073/pnas.0401764101. [DOI] [PMC free article] [PubMed] [Google Scholar]
- Yoshida M, Satoh T, Nakamura KC, Kaneko T, Hata Y. Cortical activity regulates corticothalamic synapses in dorsal lateral geniculate nucleus of rats. Neurosci Res. 2009;64:118–127. doi: 10.1016/j.neures.2009.02.002. [DOI] [PubMed] [Google Scholar]