Abstract
The fluorescein conjugate, FITC-APEC (2-[2-[4-[2-[2-[1,3-dihydro-l,l-bis(4-hydroxyphenyl)-3-oxo-5-isobenzofuranthioureidyl]ethylaminocarbonyl]ethyl]phenyl]ethylamino]-5′-N-ethylcarboxamidoadenosine), is a novel ligand derived from a series of functionalized congeners that act as selective A2a-adenosine receptor agonists. The binding of FITC-APEC to bovine striatal A2a,-adenosine receptors measured by fluorescence techniques was saturable and of a high affinity, with a Bmax, of 2.3 ± 0.3 pmol/mg protein and KD of 57 ± 2 nM. The KD value estimated by fluorescence was consistent with the Ki (11 ± 0.3 nM) obtained by competition studies with [3H]CGS 21680. Additionally, the Bmax, value found by FITC-APEC measurement was in agreement with Bmax, values obtained using radioligand binding. FITC-APEC exhibited rapid and reversible binding to bovine striatum. The potencies of chemically diverse A2a-adenosine receptor ligands estimated by inhibition of FITC-APEC binding were in good agreement with their potencies determined using radioligand binding techniques (r = 0.97, P = 0.0003). FITC-APEC binding was not altered by purine derivatives that do not recognize A2a-adenosine receptors. These findings demonstrate that the novel fluorescent ligand FITC-APEC can be used in the quantitative characterization of ligand binding to A2a-adenosine receptors.
Keywords: Fluorescence, A2a-adenosine receptors, receptor binding, bovine striatum
INTRODUCTION
Measurement of radioligand binding to receptors is routinely employed to study many aspects of receptor physiology and pharmacology [1,2]. Recently, we reported that fluorescent ligands could be used to quantitate ligand–receptor interactions at central and peripheral benzodiazepine receptors in broken cell preparations [3–5]. Moreover, direct imaging of benzodiazepine [6] and dopamine [7–11] receptors using fluorescent ligands also has been described.
Adenosine functions as a central [12] and peripheral [13] neuromodulator through at least two G protein-coupled receptors. A1-adenosine receptors [14] inhibit adenylate cyclase and may be linked to other second-messenger systems, while A2-adenosine receptors stimulate cyclic AMP production [15]. A subclass of A2-adenosine receptors that occurs with a high density in the striatum and has a high affinity for agonist ligands has been termed the A2a-adenosine receptor [15]. Activation of vascular A2a-adenosine receptors in the central nervous system (CNS) yields behavioral depression [16]. Central A2a-adenosine receptors are associated with CNS control of respiration, by modulating sensory inputs originating in carotid body chemoreceptors and controlling cardiovascular functions through the nucleus tractus solitarius [12]. An association between A2a-adenosine receptors and the postsynaptic dopaminergic system also has been proposed [17,18]. Moreover, A2a-adenosine receptor agonists have shown antipsychotic-like effects [17].
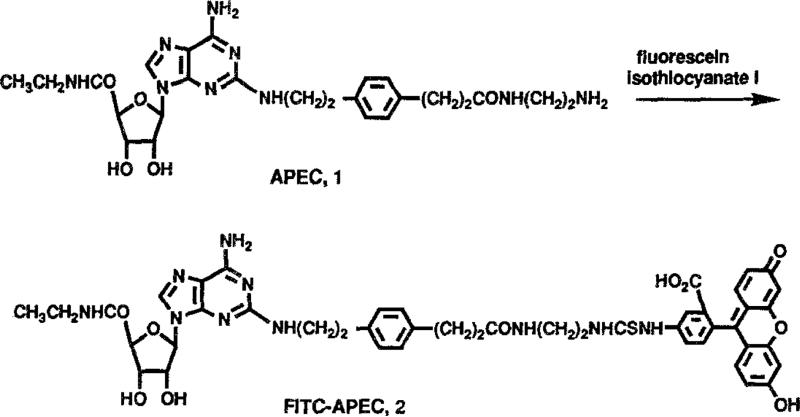
In the present study, a fluorescent ligand having a high affinity for A2a-adeonsine receptors [12–15,19] was designed as a probe for quantitative analysis of ligand-receptor interactions at these sites. The fluorescent A2a-adenosine receptor ligand was synthesized by coupling a fluorescein isothiocyanate (FITC) molecule to the terminal amino group of APEC (2-[2-[4-[2-(2-aminoethylcarbonyl)ethyl]phenyl] ethylamino]-5′-N-ethylcarboxamidoadenosine), 1, a functionalized congener developed as an intermediate in the synthesis of molecular probes for A2a-adenosine receptors [20].
The fluorescent product, FITC-APEC, 2, retained a high affinity for A2a-adenosine receptors relative to the parent molecule. In the present report, we describe the first biochemical and pharmacological characterization of ligand binding to A2a-adenosine receptors in bovine striatal membranes by direct fluorescence measurement of FITC-APEC.
MATERIALS AND METHODS
Synthesis
Proton nuclear magnetic resonance spectra (300 MHz) were measured using a Varian XL-300 FT-NMR spectrometer. Californium plasma desorption mass spectra in the positive ion mode were performed by a method used previously for adenosine derivatives [20]. Adenosine receptor ligands were obtained from Research Biochemicals Inc. (Natick, MA). APEC (Fig. 1, 1) was prepared as described previously [20].
Fig. 1.
Synthesis of the fluorescent A2a-adenosine receptor ligand, FITC-APEC.
2- [2-[4-[2-[2-[1, 3-Dihydro- 1,1-bis (4-hydroxyphenyl)-3-oxo-5-isobenzofuranthioureidyl]ethylaminocarbonyl]ethyl]pheynl]ethylamino]-5′-N-ethylcarboxamidoadenosine (FITC-APEC) (Fig. 1, 2). APEC (6.5 mg, 11.1 μmol), 1, was dissolved in 0.5 ml of 1:1 acetonitrile:isopropanol and treated with 4.8 mg (12.3 μmol) of fluoreseein isothiocyanate (Isomer I, Aldrich Chemical Co., Milwaukee, WI). After 24 h, the mixture was reduced in volume by evaporation under a stream of nitrogen. Acetonitrile and ether were added to precipitate the product. The product was recrystallized from DMF/acetonitrile/ether to yield 6.0 mg (58% yield). The 300-MHz 1H-NMR spectrum and Californium plasma desorption mass spectrum (peaks at mass 921.5, 898.9, 725.9) were consistent with the assigned structure.
Fig. 2.
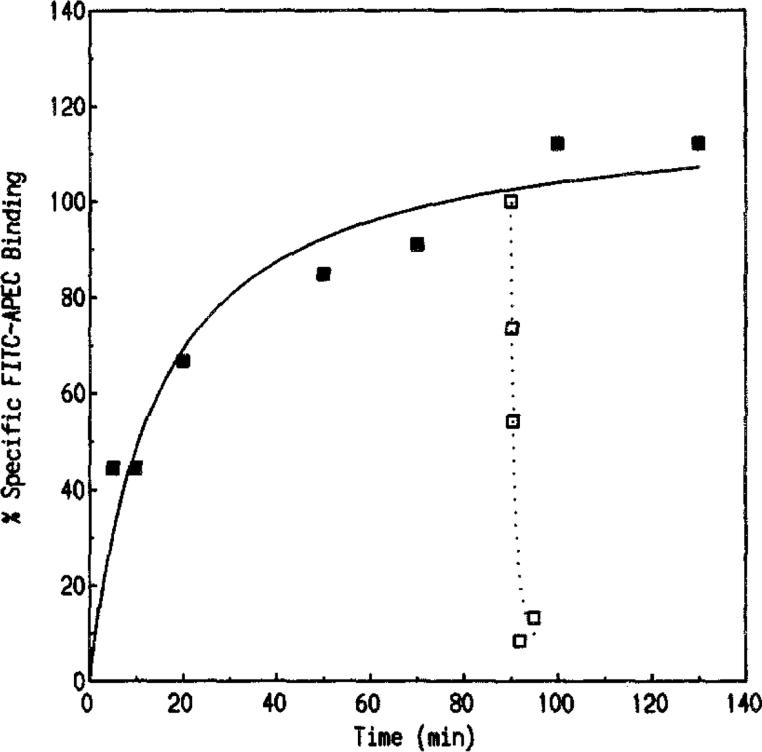
Association and dissociation of FITC-APEC binding to bovine striatal membranes. Tissues were prepared and assayed as described under Materials and Methods. Association of FITC-APEC (50 nM) binding was performed by varying the incubation period (1–130 rain). Equilibrium was attained within 60 rain and maintained throughout the 130-rain duration. A 90-min incubation period was selected for use in subsequent experiments. Association data (■, solid line) represent means (mean % specific binding) from triplicate samples of two separate determinations. The rate constants were estimated using the equation k1 = (kobs – k−1/LT, where LT is the total FITC-APEC concentration. The kobs and k1 estimates for FITC-APEC were 0.029 min −1 and 7.47 × 10⁶ M−1 min−1, respectively. Dissociation of bound FITC-APEC was performed as described under Materials and Methods. The dissociation rate constant k−1 was 0.345 min−1 Dissociation data (□, dotted line) represent means (mean % specific binding) from triplicate samples of two separate experiments. The KD determined by nonequilibrium methods (KD = k−1/k1) was 46 nM.
The product was also synthesized via carbodiimide coupling of CGS 21680 (2-p-(2-carboxyethyl)phenethylamino-5′-N-ethylcarboxamido adenosine; Research Biochemicals Inc., Natick, MA) to 5-((2-aminoethyl)thioureidyl)fluorescein (Molecular Probes, Inc., Eugene, OR) in dimethylforrnamide.
The product was purified to > 99% purity by reverse-phase high-pressure liquid chromatography, using a 20-rain gradient of 0 to 80% acetonitrile in water (both containing 0.1% trifiuoroacetic acid), using a Vydac Protein C4 column (25 × 0.4 cm). One hundred microliters of a 1 mM solution in dimethyl sulfoxide was applied for each purification run. Larger quantities were readily purified on a semipreparative column. The retention time for the product was 14.1 rain. APEC (the starting material) was shown to be > 94% pure, with a retention time of 10.8 rain. The concentration of the probe in aqueous solution (pH 7.0) was calculated using an extinction coefficient of 67,200 at the λmax 490.5 nm (quantum yield, 15.7%).
Tissue Preparation
Striatal tissues obtained from bovine brain (PeI-Freeze Biologicals, Rogers, AR) were placed in 10 vol of 0.32 M sucrose. Tissues were homogenized using a Teflon pestle and a glass tube (6–7 passes) and centrifuged at 600g for 10 rain (4°C) The pellet was discarded and the supernatant recentrifuged at 37,000g for 1 h (4°C) The resultant pellet was resuspended in ice-cold distilled water using a Brinkmann Polytron (setting 6–7, for 3 s) and centrifuged (4°C) at 37,000g for 1 h. The pellet was resuspended again in buffer (50 mM Tris–HCl, pH 7.4 at 4°C) and centrifuged. The pellet was resuspended in 2 vol (wt:vol, original wet weight) of buffer and stored at −80°C for 1–3 days prior to binding assays. Adenosine deaminase (Boehringer Mannheim Biochemicals, Indianapolis, IN; 20 μg/mg original tissue weight) from calf intestine (Fraction IV) was included in the incubation media to eliminate endogenous adenosine. Protein quantities were assessed using the Pierce BCA Protein Assay Reagent (Rockford, IL).
FITC-APEC Binding
Fluorescence intensity (counts per second; cps) was measured using a SPEX Fluorolog Model 1680 0.22-m Double Spectrometer with DM3000 software (SPEX Industries, Edison, NJ). Excitation and emission spectra were measured by placing FITC-APEC (1 μM) in buffer (50 mM Tris–HC1 containing 10 mM MgCl2, pH 7.4 or 8.1 at room temperature) or in a tissue suspension equivalent in concentration to that used for fluorescent ligand binding experiments. The excitation and emission maxima for FITC-APEC were 492 and 516 nm, respectively. Neither these values nor the fluorescence intensity of FITC-APEC was significantly altered by buffer composition, temperature, or drugs included in the assay.
The association rate of FITC-APEC was determined by incubating bovine striatal membranes in polypropylene microcentrifuge tubes (1.5 ml) containing buffer (50 mM Tris–HCl plus 10 mM MgCl2, pH 7.4 at room temperature) and FITC-APEC (50 nM) for 1–130 min. The 1-ml incubation mixture consisted of the following: 700 μl buffer, 100 μl bovine striatal tissue suspension (typically 300 μg protein per assay tube containing adenosine deaminase, 20 μg/mg original tissue weight from calf intestine, Fraction IV), 100 μl FITC-APEC (50 nM), and 100 μl 2-chloroadenosine (2-CADO, 10 μM to define nonspecific binding; Research Biochemicals Inc., Natick, MA), or buffer. Following each incubation interval, reactions were terminated by centrifugation for 20 rain at 20,000g (4°C) The pellets were rinsed superficially with 2 × 1.0-ml aliquots of buffer and re-suspended by sonication (3-s pulse, 50% setting) using an Ultrasonic Homogenizer (Cole–Parmer Instrument Co., Chicago, IL) in the original buffer volume. The buffer pH was adjusted to 8.1 prior to analysis of the samples. Following the final centrifugation, the portion of each tube containing the tissue pellet was cut off and transferred to polystyrene cuvettes (Sarstedt, Newton, NC) containing 1 ml of buffer, and the fluorescence intensity measured. Dissociation studies were performed by incubating membranes with FITC-APEC (50 nM) for 90 rain prior to the addition of i ml of buffer (4°C) plus 10 μM 2-CADO to initiate reversal of FITC-APEC binding. At the appropriate dissociation interval (1 s–25 min), the reactions were terminated by centrifugation (20,000g for 20 min at 4°C and the fluorescence intensity determined.
Saturation isotherms were constructed by incubating bovine striatal membranes at room temperature for 90 min with 16–256 nM FITC-APEC. The assay parameters used were identical to those described for the association studies.
Quantitative analysis of FITC-APEC binding was performed by generating a standard line relating fluorescence intensity (cps) emitted by FITC-APEC (0.5–1024 nM) to known concentrations of fluorescent compound in buffer (free FITC-APEC) or tissue suspension (bound FITC-APEC) [3–5]. Bound and free ligand concentrations were subsequently estimated using linear regression analysis (GraphPAD, ISS Software, San Diego, CA). The selectivity of FITC-APEC (50 nM) binding to A2a-adenosine receptors in bovine striatal membranes was examined with the following substances using the indicated concentration ranges: 2-CADO (3–6600 nM), N6-cyclohexyladenosine (CHA; 3–6600 nM), 2-(phenylamino)-adenosine (CV 1808; 30–66,000 nM), N6-[2-(3,5-dimethoxyphenyl)-2-(2-methylphenyl)-adenosine (DPMA; 0.3–660 nM), R-N6-phenylisopropyladenosine (R-PIA; 3–6600 nM), 5′-N-ethylcarboxamidoadenosine (NECA; 0.3–660 nM), adenosine arabinoside (ARA-A; 100 μM), theophylline (1–300 μM), and 5′-guanosine monophosphate (5′-GMP; 100 μM).
Radioligand Binding
Radioligand binding assays using bovine striatal A2a-adenosine receptors were performed as described [21]. Reactions were performed in a total volume fo 500 μl consisting of 50 μl of buffer (50 mM Tris–HCl plus 10 mM MgC12, pH 7.4 at 25°C) or displacer, 400 μl of membrane suspension prepared as above containing adenosine deaminase (20 μg/ml original wet tissue weight), and 50 μl of the radioligand [3H]CGS 21680 (6 or 1–128 nM; Du Pont NEN; sp act, 48.1 Ci/mmol). Nonspecific binding was defined using 2-CADO (10 μM). Assay mixtures were incubated for 90 min (25°C) and then centrifuged at 20,000g for 10 min (4°C) The supernatant was discarded and each pellet superficially washed using 2 × 300-μl aliquots of ice-cold buffer. The pellets were then resuspended in 50 μl of NCS Solubilizer (Amersham, Arlington Heights, IL) at 56°C for 1 h and neutralized with 10 μl of glacial acetic acid. Radioactivity was measured in a Beckman LS 5801 liquid scintillation counter. Studies of inhibition of [3H]CGS 21680 (6.0 nM) binding by FITC-APEC (0.5–128 nM) were performed. 2-CADO (10 μM was used to define nonspecific binding.
RESULTS
The binding of FITC-APEC (50 nM) (Fig. 1), to bovine striatal A2a-adenosine receptors reached equilibrium within 60 min and was stable for at least 130 min (Fig. 2). A 90-min incubation period was used in subsequent experiments. FITC-APEC binding to A2a-adenosine receptors exhibited a kobs of 0.029 min−1 and a k1 of 7.47 × 10⁶ M−1 min−1. The dissociation of FITC-APEC initiated by the addition of 10 μM 2-CADO was rapid, with an estimated k−1 of 0.345 min−1 (Fig. 2). The KD of FITC-APEC calculated by nonequilibrium parameters (KD = k−1/k1) was 46 nM.
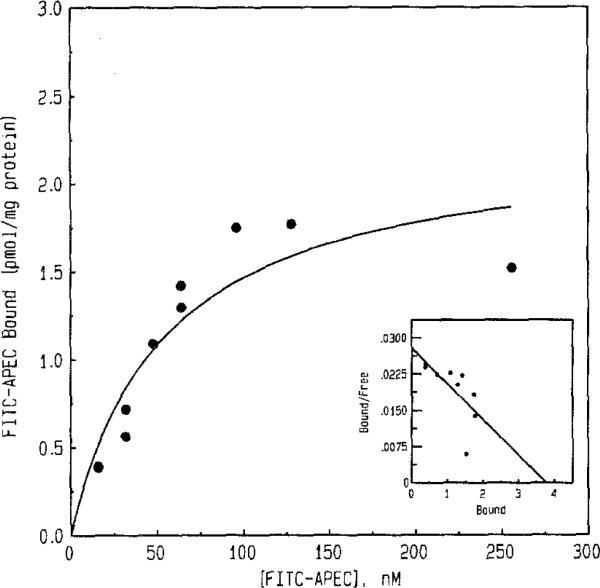
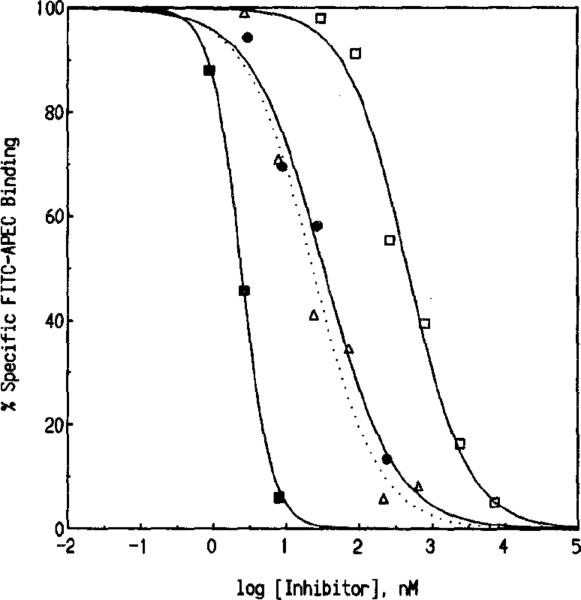
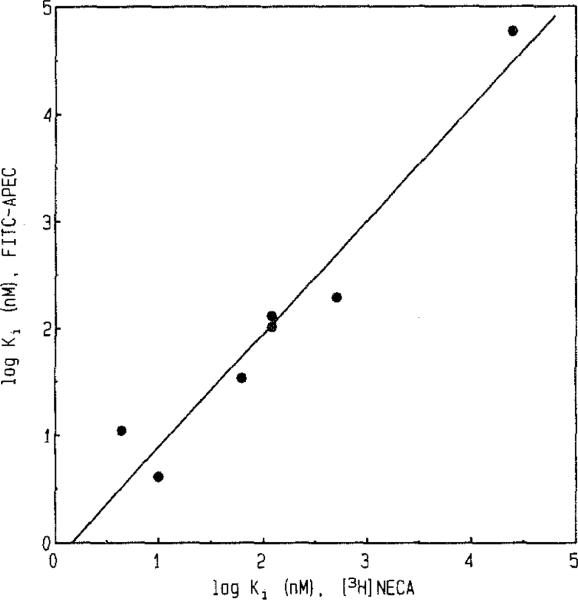
Saturation experiments were performed using 16–248 nM FITC-APEC (Fig. 3). The KD and Bmax values determined for FITC-APEC were 57 ± 2 nM and 2.3 ± 0.3 pmol/mg protein, respectively. The Bmax value obtained using 1–128 nM [3H]CGS 21680 was 1.0 ± 0.2 pmol/mg protein (data not shown). Displacement of FITC-APEC by purine derivatives of known ȧtffinity at A2a-adenosine receptors indicated a characteristic rank order of potency. Representative curves for inhibition of FITC-APEC (50 nM) binding by NECA, DPMA, 2-CADO, and CV 1808 (adenosine derivatives displaying a high affinity and/or moderate selectivity at A2a-adenosine receptors [19]) are illustrated in Fig. 4. Inhibition constants (Ki) generated for various known A2a-adenosine receptor ligands and several adenosine derivatives that do not recognize A2a-adenosine receptors with a high affinity are shown in Table I. The Ki value for FITC-APEC to inhibit [3H]CGS 21680 (6.0 nM) binding to bovine striatal membranes was 11 ± 0.3 nM. The potencies of A2a-adenosine receptor ligands to inhibit FITC-APEC binding were highly correlated (r = 0.97, P = 0.0003) with their potencies to inhibit radioligand binding (Fig. 5).
Fig. 3.
Plot of a saturation isotherm constructed from equilibrium saturation data of FITC-APEC binding to bovine striatal membranes. The concentration of FITC-APEC was varied from 16 to 248 nM. Nonspecific binding was defined by the presence of 2-CADO (10 μM). Specific binding of FITC-APEC (50 mM) determined by fluorescence measurement was approximately 20% of the total binding (specific binding of [3H]CGS 21680 (6 nM) was determined to be approximately 50% of total binding). The isotherm is representative of three separate determinations. The KD and Bmax estimates for specific FITC-APEC binding determined using saturation isotherms were (mean ± SE) 57 ± 2 nM and 2.3 ± 0.3 pmol/mg protein, respectively. Data analysis was performed using GraphPAD (ISS Software, San Diego, CA). Inset: Representative Scatchard plot of saturation data.
Fig. 4.
Inhibition of specific FITC-APEC binding by A2a-adenosine receptor ligands. Inhibition of FITC-APEC binding (50 nM) to bovine striatal membranes was assessed as described under Materials and Methods. K1 values for inhibition of FITC-APEC binding in descending order of potency were as follows: NECA, 4.1 ± 0.1 nM (■); DPMA, 13 ± 3 nM (△, dotted line); 2-CADO, 34 ± 14 nM (•); and CV 1808, 131 ± 62 nM (□). Data (mean % specific binding) represent triplicate samples from at least three experiments. The competition curves demonstrate mass action displacement of FITC-APEC binding by the four compounds.
Table I.
Inhibition of FITC-APEC and Radioligand Binding to A2a-Adenosine Receptorsa
| Binding inhibition | |||
|---|---|---|---|
| Inhibitor | Ki (nM) vs FITC-APEC | (Hill) | Ki (nM) vs[3H]NECA [23] |
| NECA | 4.1 ± 0.1 | (1.90) | 10 |
| DPMA | 13 ± 3 | (0.97) | 4.4 |
| 2-CADO | 34 ± 14 | (0.89) | 63 |
| CHA | 195 ± 28 | (0.74) | 510 |
| R-PIA | 103 ± 14 | (0.60) | 120 |
| CV 1808 | 131 ± 62 | (1.10) | 120 |
| Theophylline | 59,000 | (1.60) | 25,000 |
| ARA-A | >100,000 | (—) | Inactive |
| 5'-GMP | >100,000 | (—) | Inactive |
Tissues were prepared and binding assays performed as described under Materials and Methods. Membranes were assayed in buffer containing FITC-APEC (50 nM) and varying concentrations of the listed compounds. Values (mean specific binding ± SE) were estimated using the equation Ki = IC50/1 + [L]/KD. Data are from at least three experiments using triplicate samples from each assay. Ki values could not be established for inhibition of FITC-APEC binding by ARA-A and 5'-GMP but were greater than 100,000 nM. Values for inhibition of [3H]NECA binding were obtained from previously reported data using rat brain membranes [23].
Fig. 5.
Correlation between the potencies of A2a-adenosine receptor ligands as inhibitors of FITC-APEC and radioligand binding. The K1 (nM) values assessed by inhibition of FITC-APEC binding (ordinate) by A2a-adenosine receptor ligands were related to K1 values found using [3H]NECA binding (abscissa). FITC-APEC inhibition data (means) were obtainted from the values in Fig. 4 and Table I. [3H]NECA inhibition data were from the report by Bruns et al. [23]. The following compounds were used in the graph: NECA, DPMA, 2-CADO, CHA, R-PIA, CV 1808, and theophylline. The correlation coefficient for inhibition of FITC-APEC binding versus [3H]NECA binding was r = 0.97 (P = 0.0003).
DISCUSSION
The data reported here provide the first description of the biochemical and pharmacological characteristics of FITC-APEC binding to bovine striatal A2a-adenosine receptors determined by direct fluorescence measurement. The synthesis of a fluorescent ligand for A2a-adenosine receptors was accomplished by attaching APEC to fluorescein isothiocyanate (Fig. 1). APEC is an amine functionalized congener that may be acylated to yield conjugates with a high affinity and selectivity at A2a-adenosine receptors [20]. For example, a biotin conjugate of APEC is > 500-fold selective for A2a-versus A1-adenosine receptors. APEC contains two modifications of adenosine that favor A2a-adenosine receptors: the 5′-CONH-CH2CH3 group and an arylalkylamino group at the 2-position of the purine ring. APEC has a high potency as an A2a-adenosine receptor agonist both in vitro and in vivo [16]. While the synthesis of fluorescent adenosine receptor ligands was reported previously [22], these derivatives are selective for A1-adenosine receptors and their usefulness for direct fluorescence measurement of receptors has not been described.
Attachment of FITC to APEC at the terminal amino position resulted in a compound (FITC-APEC) with an affinity approximately one order of magnitude less than that of the parent compound (57 vs 6 nM assessed by radioligand binding) [20]. Based on the moderately reduced potencies of other fluorescent ligands, the affinity of FITC-APEC was sufficiently high to permit validation studies of its potential as a novel fluorescent ligand. Other studies have shown that attachment of fluorescent substituents to high-affinity central benzodiazepine [3,4,6,24], peripheral benzodiazepine [5], and dopamine [7,9] receptor ligands results in a similar or more dramatic reduction in affinity of the parent molecule. One possibility is that coupling a large fluorescent moiety to a high-affinity molecule (Fig. 1) may restrict access to the receptor, thus yielding a moderate decrease in affinity. Another possibility is the detrimental influence on affinity of a negative charge on a chain, which is noted as a general phenomenon for adenosine receptor ligands [22].
FITC-APEC binding to bovine striatal membranes was saturable, with the estimated KD (57 ± 2 nM) similar to the Ki value obtained in competition studies using [3H]CGS 21680 (11 ± 0.3 nM). These values also correspond to the KD of FITC-APEC estimated by non-equilibrium studies (KD = k−1/k1, 46 nM). Nonetheless, since FITC-APEC dissociates very rapidly (t1/2 calculated at <30 s) from A2a-adenosine receptors, the requirement for a centrifugation step to separate bound from free ligand may preclude an accurate estimate of k−1. The Bmax value (2.3 ± 0.3 pmol/mg protein) obtained with FITC-APEC binding to A2a-adenosine receptors in bovine striatum was higher than the corresponding value using [3H]CGS 21680 (1.0 ± 0.2 pmol/mg protein) as a radioligand. The FITC-APEC and [3H]CGS 21680 Bmax estimates reported here are compatible with the Bmax values (0.2–1.3 pmol/mg protein) found by using A2a-adenosine receptor radioligands [17,25,26] for similarly prepared tissues of various animal species (i.e., bovine, guinea pig, man, mouse, rabbit, and rat). Despite the moderate differences in Bmax obtained using fluorescent ligand and radioligand binding techniques, FITC-APEC binding was inhibited by compounds that recognize A2a-adenosine receptors in a competitive manner, while agents that do not interact with A2a-adenosine receptors did not inhibit FITC-APEC binding (Fig. 4, Table I). The rank order of potency found for the inhibitors was that expected for A2a-adenosine receptors [19]. Moreover, an excellent correlation (r = 0.97, P = 0.0003) was obtained between the potencies of a series of A2a-adenosine receptor ligands as inhibitors of FITC-APEC and [3H]NECA binding [23] (Fig. 5). These data strongly indicate that FITC-APEC labels an A2a-adenosine receptor. The most potent compounds in the fluorescence assay, NECA and DPMA, are among the most potent agonists known at A2a-adenosine receptors. 2-CADO, CHA, and R-PIA displayed an intermediate affinity, consistent with the A1 selectivity of these N6-substituted adenosine derivatives [19]. CV 1808, although slightly A2a-adenosine receptor selective [23], was of a submicromolar affinity in the fluorescence assay and in agreement with the Ki value determined by radioligand binding. The fluorescence method was of a sufficient sensitivity to measure competition by a weak and nonselective adenosine antagonist, theophylline. ARA-A, a diastereomer of adenosine that does not bind to adenosine receptors, did not displace FITC-APEC from bovine striatal A2a-adenosine receptors. Likewise, guanosine derivatives are not adenosine receptor ligands, and 5′-GMP did not displace FITC-APEC binding.
FITC-APEC is a novel, high-affinity, and selective fluorescent ligand for A2a-adenosine receptors. This compound may be a useful tool both in pharmacological studies and to gain further insight into the physiological role of A2a-adenosine receptors. FITC-APEC is of potential use in histochemical studies and cell sorting. The feasibility of using fluorescence techniques to measure quantitatively ligand–receptor interactions has now been evidenced using divergent types of receptors and ligands (Refs. 3–5 and this report). This technique provides a complementary method to existing techniques that employ radioactive materials and is economical and free of the potential health hazards and disposal problems associated with radioactive materials.
ACKNOWLEDGMENTS
We thank Dr. Gary Stiles for helpful discussions and Marc Glashofer, Dr. Xiao-Duo Ji, Bryan R. Wilson, and Aaron V. Hijarunguru for technical assistance.
REFERENCES
- 1.Yamamura HI, Enna SJ, Kuhar MJ. Neuro-transmitter Receptor Binding. Raven Press; New York: 1983. [Google Scholar]
- 2.Snyder SH. JAMA. 1989;261:3126–3129. [PubMed] [Google Scholar]
- 3.McCabe RT, de Costa BR, Miller RL, Havunjian RH, Rice KC, Skolnick P. FASEB J. 1990;4:2934–2940. doi: 10.1096/fasebj.4.11.2165950. [DOI] [PubMed] [Google Scholar]
- 4.Havunjian RH, de Costa BR, Rice KC, Skolnick P. J. Biol. Chem. 1990;265:22181–22186. [PubMed] [Google Scholar]
- 5.McCabe RT, Newman AH, Skolnick P. J. Pharmacol. Exp. Ther. 1992;262:734–740. [PubMed] [Google Scholar]
- 6.Velazquez JL, Thompson CL, Barnes EM, Angelides KJ. J. Neurosci. 1989;9:2163–2169. doi: 10.1523/JNEUROSCI.09-06-02163.1989. [DOI] [PMC free article] [PubMed] [Google Scholar]
- 7.Madras BK, Canfield DR, Pfaelzer C, Vittimberga FJ, Jr., Difiglia M, Aronin N, Bakthavachalam V, Baindur N, Neumeyer JL. Mol. Pharmacol. 1990;37:833–839. [PubMed] [Google Scholar]
- 8.Ariano MJ, Monsma FJ, Barton AC, Kang HC, Haugland RP, Sibley DR. Proc. Natl. Acad. Sci. USA. 1989;86:8570–8574. doi: 10.1073/pnas.86.21.8570. [DOI] [PMC free article] [PubMed] [Google Scholar]
- 9.Monsma FJ, Jr., Barton AC, Kang HC, Brassard DL, Haugland RP, Sibley DR. J. Neurochem. 1989;52:1641–1644. doi: 10.1111/j.1471-4159.1989.tb09220.x. [DOI] [PubMed] [Google Scholar]
- 10.Barton AC, Kang HC, Rinaudo MS, Monsma FJ, Stewart-Fram RM, Macinko JA, Jr., Haugland RP, Ariano MA, Sibley DR. Brain Res. 1991;547:199–207. doi: 10.1016/0006-8993(91)90963-v. [DOI] [PubMed] [Google Scholar]
- 11.Ariano MA, Kang HC, Haugland RP, Sibley DR. Brain Res. 1991;547:208–222. doi: 10.1016/0006-8993(91)90964-w. [DOI] [PubMed] [Google Scholar]
- 12.Ribeiro JA. In: Adenosine in the Nervous System. Stone T, editor. Academic Press; London: 1991. pp. 229–246. [Google Scholar]
- 13.Collis MG. In: Purines in Cellular Signalling: Targets for New Drugs. Jacobson KA, Daly JW, Manganiello V, editors. Springer; New York: 1990. pp. 48–53. [Google Scholar]
- 14.Stiles GL. J. Biol. Chem. 1992;276:6602–6610. [Google Scholar]
- 15.Hide I, Padgett WL, Jacobson KA, Daly JW. Mol. Pharmacol. 1992;41:352–359. [PMC free article] [PubMed] [Google Scholar]
- 16.Nikodijevic O, Sarges R, Daly JW, Jacobson KA. Y. Pharmacol. Exp. Ther. 1991;259:288–294. [PMC free article] [PubMed] [Google Scholar]
- 17.Heffner TG, Wiley JN, Williams AE, Bruns RF, Coughenour LJ, Downs DA. Psychopharmacology. 1989;98:31–37. doi: 10.1007/BF00442002. [DOI] [PubMed] [Google Scholar]
- 18.Ferre S, Herrera-Marschitz M, Grabowska-Anden M, Ungerstedt U, Casas M, Anden N-E. Eur. J. Pharmacol. 1992;192:25–30. doi: 10.1016/0014-2999(91)90064-w. [DOI] [PubMed] [Google Scholar]
- 19.Jacobson KA, van Galen PJM, Williams M. J. Med. Chem. 1992;35:407–422. doi: 10.1021/jm00081a001. [DOI] [PMC free article] [PubMed] [Google Scholar]
- 20.Jacobson KA, Barrington WW, Pannell LK, Jarvis MF, Ji I-D, Williams M, Hutchison AJ, Stiles GL. J. Mol. Recognit. 1989;2:170–178. doi: 10.1002/jmr.300020406. [DOI] [PMC free article] [PubMed] [Google Scholar]
- 21.Jarvis MF, Schulz R, Hutchison AJ, Do UH, Sills MA, Williams M. J. Pharmacol. Exp. Ther. 1989;251:888–893. [PubMed] [Google Scholar]
- 22.Jacobson KA, Ukena D, Padgett W, Kirk KL, Daly JW. Biochem. Pharmacol. 1987;36:1697–1707. doi: 10.1016/0006-2952(87)90056-6. [DOI] [PMC free article] [PubMed] [Google Scholar]
- 23.Bruns RF, Lu GH, Pugsley TA. Mol. Pharmacol. 1986;29:331–346. [PubMed] [Google Scholar]
- 24.Takeuchi T, Rechnitz G. Anal. Biochem. 1991;194:250–255. doi: 10.1016/0003-2697(91)90226-j. [DOI] [PubMed] [Google Scholar]
- 25.Jacobson KA, Stiles GL, Ji Xiao-Duo. Mol. Pharmacol. 1992;42:123–133. [PMC free article] [PubMed] [Google Scholar]
- 26.Stone GA, Jarvis MF, Sills MA, Weeks B, Snow-hill EW, Williams M. Drug Dev. Res. 1988;15:31–46. [Google Scholar]


