

Abstract
Visual working memory (VWM) capacity is affected by motivational influences; however, little is known about how reward-related brain activities facilitate the VWM systems. To investigate the dynamic relationship between VWM- and reward-related brain activities, we conducted time–frequency analyses using electroencephalograph (EEG) data obtained during a monetary-incentive delayed-response task that required participants to memorize the position of colored disks. In case of a correct answer, participants received a monetary reward (0, 10 or 50 Japanese yen) announced at the beginning of each trial. Behavioral results showed that VWM capacity under high-reward condition significantly increased compared with that under low- or no-reward condition. EEG results showed that frontal theta (6 Hz) amplitudes enhanced during delay periods and positively correlated with VWM capacity, indicating involvement of theta local synchronizations in VWM. Moreover, frontal beta activities (24 Hz) were identified as reward-related activities, because delay-period amplitudes correlated with increases in VWM capacity between high-reward and no-reward conditions. Interestingly, cross-frequency couplings between frontal theta and beta phases were observed only under high-reward conditions. These findings suggest that the functional dynamic linking between VWM-related theta and reward-related beta activities on the frontal regions plays an integral role in facilitating increases in VWM capacity.
Keywords: motivation, visual working memory, frontal, theta, beta
INTRODUCTION
Visual working memory (VWM), the ability to maintain relevant visual information for a short time period, is known to be a limited-capacity system (Luck and Vogel, 1997; Cowan, 2001). VWM capacity varies among different individuals and is affected by several factors, including motivation, within the same individual. Previous neuroimaging studies on humans by using delayed-response tasks have identified various brain regions whose delay-period activities are correlated with an individual’s VMW capacity. These studies identified frontal, parietal and visual regions as neural candidates for VWM maintenance (Smith and Jonides, 1999; Rowe et al., 2000; Rypma and Gabrieli, 2001; Jensen and Tesche, 2002; Curtis and D’Esposito, 2003; Vogel and Machizawa, 2004; Todd and Marois, 2005; Kawasaki et al., 2008). These distributed regions are thought to communicate through local and global synchronization of the theta (4–8 Hz) and alpha (9–12 Hz) oscillations, as shown by human scalp-recorded electroencephalograph (EEG) studies during several working memory tasks, such as mental calculations (Mizuhara et al., 2004; Sauseng et al., 2005; Klimesch et al., 2008; Saunseng et al., 2009). Interestingly, the theta and alpha oscillations are dynamically integrated by cross-frequency phase coupling in VWM storage areas (e.g. parietal regions) during manipulation of mental representations (Kawasaki et al., 2010).
On the other hand, midbrain dopamine neurons and their projection regions, including the orbitofrontal cortex, the amygdalae and the striatum, are neural candidates for the reward-related brain network, because these signals increased during reward prediction and receipt in non-human primate electrophysiological (Schultz et al., 1992, Schultz, 1998; Wise, 2004) and human neuroimaging studies (Elliott et al., 2000; Knutson et al., 2001, 2004; O’Doherty et al., 2001; Gottfried et al., 2003; McClure et al., 2003; Kable and Glimcher, 2007). Moreover, frontal beta activity is associated with motivation and relative evaluation of reward values (Cohen et al., 2007; Marco-Pallares et al., 2008). Recent studies have investigated the influence of reward-related brain areas on memory-related areas that are involved in memory formation and storage. For example, it was reported that when monetary rewards facilitate the encoding and storage of memory, numerous connections are observed between the prefrontal cortex and the specific brain areas for working memory (Pochon et al., 2002; Gilbert and Fiez, 2004; Krawczyk et al., 2007) as well as between the midbrain dopaminergic areas and the hippocampus for long-term memory (Wittmann et al., 2005; Adcock et al., 2006). However, there is little neurological evidence regarding the mechanism by which the reward-related brain regions increase the storage capacity of working memory.
To better understand the effect of motivation on the VWM system, we investigated the influence of monetary reward on VWM capacity and the dynamic relationship between reward- and VWM-related brain activities. To identify the brain oscillatory activities specific to reward and VWM storage, and the synchronization between the two brain activities, we analyzed the oscillatory amplitudes by time–frequency analysis of 60-channel EEG data recorded during delayed-response tasks (Figure 1A). EEG oscillations reflect the dynamic linking of cell assemblies and synchronization of a large number of neurons underlying a particular function (Varela et al., 2001). In each trial, participants were required to memorize the colors of three or six sample disks, memorize and maintain them for a 2-s retention interval, and judge whether a single probe disk matched one sample disk in the same location. If the participants gave a correct answer, they received 0, 10 or 50 Japanese yen (no, low or high reward, respectively). The reward values were disclosed at the beginning of each trial.
Fig. 1.

(A) Schematic illustration of one trial sequence for the VWM tasks. At the beginning of each trial, the reward value (0, 10 or 50 Japanese yen) was presented in the reward instruction period. This task required the participants to memorize the colors of three or six disks in the sample display, maintain them for the 2-s retention interval, and judge whether a single probe disk in the test display matched one sample disk in the same location. After the judgment, the feedback stimulus, which indicated whether the answer was correct (O) or false (X), was presented, and the total reward was then presented as the purple bar graph. (B) The estimated VWM capacity under conditions of the different numbers of objects (three or six) and reward values (0, 10 or 50). Error bars depict the standard error of the mean.
MATERIAL AND METHODS
Participants
Fourteen healthy, right-handed volunteers (four females; mean age =25.6 ± 4.2 years, range 21–38 years) with normal or corrected-to-normal visual acuity, normal hearing acuity and normal motor performance took part in the EEG experiment. All participants gave written informed consent, which was approved by the Ethical Committee of the RIKEN (in accordance with the Declaration of Helsinki), before the experiments were performed.
Task procedure
Participants faced a computer screen. At the beginning of each trial, a number (0, 10 or 50) indicating the reward of the trial (i.e. if their answers were correct, they would be given 0, 10 or 50 Japanese yen) was presented below a central white fixation point in a black rectangle (size, 10° × 10°) on the computer screen for 2 s (reward instruction, Figure 1). After that, participants were to memorize the colors of three or six colored disks (size, 1° × 1°; color, white, red, green, blue, yellow, magenta, cyan or orange) that were distributed at random locations within an invisible 3 × 3 cell matrix for 0.2 s (sample display). After a 2-s retention interval, one disk was presented at one location within the sample array (test display) and participants were required to judge whether its color matched the disk at the same location in the sample display via a button press while the fixation point was red for 2 s. In one trial, the color of the probe disk matched the sample disk, and in a second trial, the color of the probe disk did not match. After the judgment, a feedback stimulus indicating whether the answer was correct (O) or false (X) was presented. Finally, the cumulative reward amount total was presented as a purple bar graph for 2 s. The duration of the intertrial interval (ITI) was 2 s.
Each participant completed four separate sessions. Each session consisted of 48 trials [i.e. three rewards (0, 10 or 50) × two number of disks (three or six) × two change types (match or no match) × four repetitions]. A behavioral training session before the EEG-measurement sessions was provided for all participants.
To examine the effect of the iconic representations, we also conducted a control task that was identical to the VWM task except that the participants were required to merely see but not memorize the colored sample disks (Todd and Marois, 2004). Under this condition, participants determined whether the disks were colorful or gray after the 2-s retention interval. Each participant completed one control session, including 48 trials.
EEG recordings
An EEG was continuously recorded using 60 scalp electrodes (Ag/AgCl) embedded in an electrode cap in accordance with the extended version of the International 10/20 System of Electrode Placement. The sampling rate was 500 Hz. Reference electrodes were placed on the right and left earlobes. Artifacts due to eye blinks and movements were detected by electro-oculogram (EOG) electrodes above and below the left eye for monitoring eye blinks or vertical eye movements, and electrodes were placed 1 cm from the right and left eyes for monitoring horizontal eye movements. Trials in which the amplitude of any electrode of an EEG epoch exceeded plus or minus 100 μV were rejected from the offline analysis. These EEG data were amplified by using NeuroScan equipment (Compumedics NeuroScan Corp., Charlotte, NC, USA) and were filtered with a band-pass range from 0.1 to 50 Hz.
EEG data preprocessing
We analyzed the EEG data for the correct trials. These epochs were subjected to infomax independent component analysis (ICA) with the use of EEGLAB (Delorme and Makeig, 2004; Institute for Neural Computation, University of California, San Diego, CA, USA) running under Matlab (Mathworks, Natick, MA, USA). ICA components that were significantly correlated with vertical or horizontal EOGs were regarded as components related to eye movement or other artifacts and were reduced or eliminated from the data. The ICA-corrected data were recalculated by using regressions on the remaining components.
To accurately evaluate the cortical activity under the scalp EEG electrodes without error due to volume conduction, we used a current source density analysis at each electrode position. We applied the spherical Laplace operator to the voltage distribution on the surface of the scalp using the following parameters: the order of the spline, m = 4 and the maximum degree of the Legendre polynomial, n = 50 with a precision of 10−5 (Perrin et al., 1989).
Wavelet analysis
Time–frequency (TF) amplitudes and phases were calculated by wavelet transforms based on Morlet’s wavelets having a Gaussian shape in the time domain (SD σt) and frequency domain (SD σf) around its center frequency (f) (Tallon-Baudry et al., 1997). The TF amplitude E(t, f) for each time point of each trial was the squared norm of the result of the convolution of the original EEG signal s(t) with the complex Morlet’s wavelet function w(t, f):
where σf = 1/(2πσt). The wavelet we used was characterized by a constant ratio (f/σf = 7), with f ranging from 1 to 40 Hz in 0.5-Hz steps. The TF amplitude was averaged across single trials for events and conditions. The event-related TF amplitude was calculated by subtracting the baseline data measure in the ITI for each frequency band. For all statistical analyses, a non-parametric Wilcoxon signed-rank test was used across the events or conditions because the distributions of the populations of TF amplitudes were far from Gaussian.
Cross-frequency coupling
To identify the phase–phase cross-frequency coupling (CFC) between the theta (6 Hz) and beta (24 Hz) oscillations at each electrode, we applied the modified PSI formula for the 2-s retention interval. We calculated the PSI values using Δ 6–24 Hz (t, j) as the phase difference between four theta phases (
 ) and the beta phase (
 24 Hz) at the jth electrode because the relationships between the theta and beta phases were expressed in the ratio 1 : 4 during both the retention interval and the ITI periods. The CFC was calculated by the equation:
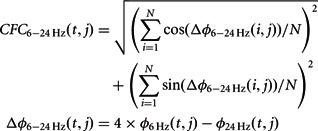 |
The number of time points, N with an interval of 1 s is 500 (Lachaux et al., 1999) and Δ 6–24 Hz (t, j) is the phase difference between the 6 and 24 Hz on each time point, t.
To evaluate the delay-period CFC changes, we applied the bootstrap method to the CFCs of each trial of the individual subjects and compared the virtual CFC data obtained during the retention interval [ ] with the baseline data of the ITI period [
 ]:
]:
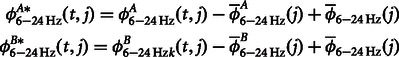 |
where  and
and  represent the original CFC while
  ,
,  and
and  represent the mean
  , mean
  and the average value of all the data, respectively (Kawasaki et al., 2010).
Next, we calculated the Z-values which mean ‘the degrees about whether differences are significant or not’ by using the non-parametric Wilcoxon signed-rank test for the different normalized CFC values. The null hypothesis means that the difference of the representative CFC values between the events equal zero. If the Z-value is near zero, the different CFC values between the events are not significant (the null hypothesis is accepted). On the other hand, if the Z-value is larger than threshold, the different CFC values between the events are significant (the null hypothesis is rejected). To test if the significance results from chance, we repeated the Wilcoxon signed-rank tests for 2000 times with the bootstrapped resample data of each time point for individual subjects.
Finally, we tested whether the mean of the distribution of the 2000 resampled Z-values is zero or not by using the sign test against the null hypothesis that the mean of Z-values equal zero. If the Z-value is near zero, the different CFC values between the events are not significant except for the chance (the null hypothesis is accepted). On the other hand, if the Z-value is larger than threshold, it is no coincidence that the different CFC values between the events are significant (the null hypothesis is rejected).
RESULTS
Behavioral performance
Accuracy rates (percent correct) for lower numbers of presented objects were higher than those for larger numbers of presented objects, and higher reward values produced better accuracy rates than lower reward values did [three objects, no reward (0 yen): 90.2 ± 2.0%; three objects, low reward (10 yen): 94.0 ± 1.9%; three objects, high reward (50 yen): 96.2 ± 1.0%; six objects, no reward: 72.6 ± 2.8%; six objects, low reward: 72.3 ± 3.0%; six objects, high reward: 79.2 ± 2.3%]. A two-factor analysis of variance (ANOVA) revealed main effects of the number of objects [F(1,78) = 95.07, P < 0.01] and reward values [F(2,78) = 3.88, P < 0.05] but no interaction effects [F(2,78) = 0.58, P = 0.56].
VWM capacity was estimated by Cowan’s K formula: K = N × (hit rate + correct rejection rate −1), where K is the estimated number of objects stored in VWM, N is number of the objects presented in the sample display, and hit rate and correct rejection rate are the percentages of correct answers for the changed target and unchanged target in the test display, respectively (Cowan, 2001; Todd and Marois, 2004; Kawasaki et al., 2008). The averaged VWM capacity for each condition is shown in Figure 1B. A two-factor ANOVA revealed a main effect only of the reward values [F(2,78) = 3.12, P < 0.05] but no main effect of the number of objects [F(1,78) = 3.28, P = 0.07] or interaction [F(2,78) = 0.95, P = 0.39]. A significant difference was observed between no reward and high reward for three or six objects (Wilcoxon signed-rank test; three objects, Z = 2.42, P < 0.01; six objects, Z = 1.77, P < 0.05). However, there was no significant difference between no and low reward (three objects, Z = 0.40, P = 0.34; six objects, Z = 0.02, P = 0.51) or between low and high reward (three objects, Z = 0.02, P = 0.51; six objects, Z = 0.75, P = 0.23). These results indicate that the VWM capacity in our experiments was approximately 2.5 objects, but that it increased to 3.5 objects at high-reward values.
Reaction times for lower numbers of presented objects were similar between conditions (three objects, no reward: 264.1 ± 70.6 ms; three objects, low reward: 265.0 ± 70.8 ms; three objects, high reward: 264.5 ± 70.7 ms; six objects, no reward: 262.6 ± 70.2 ms; six objects, low reward: 261.5 ± 69.9 ms; six objects, high reward: 260.2 ± 69.5 ms). A two-factor ANOVA showed no main effects for the number of objects [F(1,78) = 0.00, P = 0.96] and the reward values [F(2,78) = 0.00, P = 0.99] and no interaction effects [F(2,78) = 0.00, P = 0.99]. Moreover, the reaction times were not significantly correlated with the accuracy rates [three objects, no reward: r(14) = 0.26, P = 0.38; three objects, low reward: r(14) = 0.02, P = 0.94; three objects, high reward: r(14) = 0.19, P = 0.53; six objects, no reward: r(14) = −0.12, P = 0.68; six objects, low reward: r(14) = 0.27, P = 0.34; six objects, high reward: r(14) = −0.15, P = 0.61] or the K-values [three objects, no reward: r(14) = 0.26, P = 0.38; three objects, low reward: r(14) = 0.02, P = 0.94; three objects, high reward: r(14) = 0.19, P = 0.53; six objects, no reward: r(14) = −0.12, P = 0.68; six objects, low reward: r(14) = 0.26, P = 0.34; six objects, high reward: r(14) = −0.15, P = 0.61]. These results suggest that the VWM capacity was not influenced by the strategic shift, which is trade-off between reaction times and accuracy rates in more demanding conditions.
Local synchronization by oscillatory amplitudes
To elucidate the spatiotemporal domain, we first applied a current source density volume conduction correction and then performed wavelet analyses for EEG data recorded during the VWM tasks. To identify and characterize brain oscillatory activity related to maintenance of VWM, the time–frequency amplitudes during the 2-s retention interval were compared with those of the 2-s ITI and then averaged among the subjects. The averaged time–frequency amplitudes showed that the frontal theta amplitudes (∼6 Hz) sustainably and significantly increased during the retention intervals under high-reward conditions (Figure 2A; Fz electrode: no reward, Z = 0.18, P = 0.85; low reward, Z = 0.23, P = 0.81; high reward, Z = 2.11, P < 0.04). On the other hand, the parietal alpha delay-period amplitudes (∼12 Hz) enhanced under no-reward conditions, whereas the parietal activity decreased under high-reward conditions (Figure 2B; POz electrode, no reward; Z = 2.11, P < 0.04; low reward, Z = 1.33, P = 0.18; high reward, Z = −2.50, P < 0.01).
Fig. 2.

(A and B) Subject-averaged (N = 14) and time-averaged (2-s retention interval) frequency amplitudes under the no- (gray), low- (blue) and high- (red) reward conditions on the frontal (A, Fz electrode) and parietal (B, POz electrode) regions. These values, normalized with respect to the ITI baseline, were averaged across correct trials of all participants. (C and D) Topographic colored scalp maps of the P-values for the theta (C, 6 Hz) and alpha (D, 12 Hz) delay-period amplitudes that were significantly correlated with VWM capacity. (E and F) Scatter plot of VWM capacity and the Fz theta amplitudes (E) and POz alpha amplitudes (F) under the no- (gray), low- (blue) and high- (red) reward conditions, by averaging across VWM load (three and six objects).
To identify the neural candidate responsible for maintenance of VWM, we analyzed the delay-period oscillatory activity, which was correlated with the VWM capacity in the individual data. The theta activities in the frontal regions were significantly and positively correlated with VWM capacity only under no-reward conditions [Figure 2C and E; Fz, which was the electrode measuring the peak statistic value: no reward, r(14) = 0.51, P < 0.03; low reward, r(14) = 0.23, P = 0.21; high reward, r(14) = 0.21, P = 0.23]. On the other hand, alpha activities were negatively correlated with VWM capacity in the parietal and occipital regions especially under the no- and low-reward conditions [Figure 2D and F; POz: no reward, r(14) = −0.66, P < 0.01; low reward, r(14) = −0.53, P < 0.03; high reward, r(14) = −0.42, P = 0.07]. The parietal alpha and frontal theta amplitudes did not result from the visual processing of the iconic representations, because they were not correlated with the number of objects presented in the control tasks, which required participants to merely see but not memorize the colored disks [Fz theta: r(14) = 0.18, P = 0.36; POz alpha: r(14) = 0.30, P = 0.13].
The question then arises: How does the reward value affect the brain oscillations that were related to the VWM capacity? We examined the brain oscillations that were associated with increasing values of VWM capacity under high-reward conditions by comparing them with those under the no-reward condition. The frontal beta (24 Hz) delay-period amplitudes were also significantly correlated with the increase in values of VWM capacity in high-reward vs no-reward conditions [Figure 3A and B; electrode measuring the peak statistic value, Fz: three objects, r(14) = 0.36, P = 0.20; six objects, r(14) = 0.70, P < 0.01]. On the other hand, the frontal theta and parietal alpha amplitudes were not significantly correlated with high-reward-induced increases in VWM capacity [Fz theta: three objects, r(14) = 0.01, P = 0.99; six objects, r(14) = −0.23, P = 0.42; POz alpha: three objects, r(14) = −0.22, P = 0.44; six objects, r(14) = −0.19, P = 0.50].
Fig. 3.

(A) The topographic colored scalp maps of the P-values for the beta delay-period amplitudes, which were significantly correlated with increasing VWM capacity under the high-value compared with no-reward conditions. (B) A scatter plot of VWM capacity difference against Fz beta amplitude differences under the high-value and no-reward conditions when three (cyan) or six objects (red) were presented in the sample display. (C) A scatter plot of the Fz beta amplitude between the reward instruction period and the retention interval under the no- (gray), low- (blue) and high- (red) reward conditions by averaging across VWM load (three and six objects). (D) Subject-averaged time–frequency amplitudes during the reward instruction periods under the no- (left), low- (center) and high-reward (right) conditions on the Fz electrode.
The frontal beta amplitudes also increased during the reward instruction period, when the number that indicated the reward value in the event of a correct answer was first announced. The frontal beta activities for the reward instruction period were significantly correlated with those for the retention interval [Figure 3C; Fz: no reward, r(14) = 0.66, P < 0.01; low reward, r(14) = 0.61, P < 0.02; high reward, r(14) = 0.71, P < 0.01]. The enhanced frontal beta amplitudes showed different time-domain characteristics among different reward conditions, with sustained activity under high- and low-reward conditions and phasic activity under the no-reward condition (Figure 3D). The sustained beta amplitudes in the high-reward condition were significantly higher than those in the low-reward condition (Fz: Z = 1.65, P < 0.05). Moreover, the frontal beta amplitudes showed a slightly positive correlation with the reward values (0, 10 or 50 yen) [Fz electrode, beta: r(42) = 0.21, P < 0.05]. The frontal theta amplitudes were also positively correlated with the reward values [F2 electrode, theta: r(42) = 0.32, P < 0.03], whereas the parietal alpha amplitudes showed a negative correlation during reward instruction periods [POz: r(42) = −0.38, P < 0.02]. These results suggest that the frontal theta and beta delay-period activities were involved in the motivation for the monetary reward, and that delay-period frontal theta and parietal alpha activities were influenced by reward incentive motivations during reward instruction periods.
Cross-frequency coupling
The present results show that the VWM-related theta oscillations and the reward-related beta oscillations were found in the same frontal regions. The effect of monetary-incentive motivations on increasing VWM capacity might be observed in any coupling between theta and beta oscillations, similar to the phase–phase CFC between theta and alpha oscillations in the parietal regions during manipulation of visual representations (Kawasaki et al., 2010). We determined cross histograms between the theta (6 Hz) and beta (24 Hz) phases and found a 1 : 4 ratio relationship at the frontal electrode (Fz) during both maintenance periods (Figure 4A). The 1 : 4 relationship between the 6-Hz and 24-Hz signals was not observed during the ITI. Therefore, we calculated the phase synchronization index (PSI) between the four 6-Hz phases and the 24-Hz phases. (It should be noted that this 1 : 4 frequency coupling is not unique to the 6 - and 24-Hz components but is consistent between the theta- and beta-band components.) The PSI6–24 Hz of the Fz electrodes was significantly higher during the retention interval under the high-reward condition than during the ITI (Figure 4B; Fz electrode: no reward, Z = 0.72, P = 0.24; low reward, Z = 1.37, P = 0.09; high reward, Z = 2.39, P < 0.01). On the other hand, CFCs were not observed during the reward instruction periods under any reward condition (Fz: no reward, Z = 0.08, P = 0.47; low reward, Z = 0.33, P = 0.45; high reward, Z = 1.34, P = 0.09).
Fig. 4.

(A) Cross histogram of the probability distributions between the theta (6 Hz) and beta (24 Hz) phases during the retention interval. (B) Z-values of the cross-frequency PSI between the theta and beta phases at Fz during the retention interval. The dotted line denotes the threshold value (P < 0.01).
The frontal theta and beta CFCs represent the VWM capacity, because the individual statistical values for the CFCs (Z-values) were significantly correlated with VWM capacity only under high-reward conditions [Fz: no reward, r(14) = 0.24, P = 0.41; low reward, r(14) = 0.19, P = 0.52; high reward, r(14) = 0.59, P < 0.03]. These results suggest that the frontal theta and beta oscillations dynamically integrated and contributed to the increasing VWM capacity through phase synchronizations during the maintenance of the motivated VWM.
DISCUSSION
In the current study, we quantitatively determined brain activity signals related to the effects of monetary rewards on VWM capacity by manipulating the VWM load (i.e. the number of presented colored disks in the sample display) and the reward values in a delayed-response task. We have mainly focused on the behavioral changes in the VWM capacity and on the EEG oscillatory amplitudes and phases of each frequency in each brain region and the relationships between them.
Increases of VWM capacity by monetary rewards
The behavioral results showed that VWM capacity significantly increased with increasing reward value, indicating that the limited VWM capacity is not fixed but can vary based on the effects of motivation as well as training and learning, as shown in previous studies (Olesen et al., 2003; Dahlin et al., 2008; Jaeggi et al., 2008; McNab et al., 2009). Our results are consistent with previous findings, indicating that the presence of reward incentives improves the accuracy rates and reaction times in monkey electrophysiological studies using primary rewards such as food and liquid (Watanabe et al., 2002a; Watanabe et al., 2002b) and in human neuroimaging studies using secondary rewards such as money (Gilbert and Fiez, 2004; Taylor et al., 2004; Beck et al., 2010).
The average limit of VWM capacity in this study (no reward, 2.5 items; high reward, 3.5 items) was smaller than the four items obtained by psychological evidence (Luck and Vogel, 1997; Cowan, 2001), although we used similar task paradigms such as size, color and presentation of stimulus. However, those previous studies presented a wider range of items (e.g. 1, 2, 3, 4, 6 or 8 items) and focused on the number of items showing the declination of accuracy rates or saturation of an increasing K-value. For example, when the accuracy rates reached high values for one to four items but declined for more than four items and when the K-values increased up to three to four items and leveled off thereafter, the maximum VWM capacity was estimated to be four items. However, the actual K-values were similar to ours (approximately three items in Todd and Marois, 2004; 2.6 items in Vogel and Machizawa, 2004). Therefore, our results are reasonable, although the number of items (three or six) in our tasks might not have been sufficient to detect the maximum limit of VWM capacities.
VWM- and reward-related local synchronizations by oscillatory amplitudes
In relation to the behavioral results, our EEG results showed that the frontal theta and parietal alpha amplitudes were sustainably enhanced during the retention interval of the VWM task, especially under the no-reward condition. The lack of correlation under reward conditions could have originated from the inclusion of reward factors in the VWM systems. Interestingly, the frontal theta and parietal alpha activities showed opposite relationships with VWM capacity; the frontal theta activity showed a positive correlation, whereas the parietal alpha showed a negative correlation. These activities were not affected by the amount of visual processing, because the control tasks showed no significant correlation with the number of objects presented. These results are consistent with previous EEG findings, indicating that these oscillations are involved in VWM (Gevins et al., 1979; Jensen and Tesche, 2002; Jensen et al., 2002; Klimesch et al., 2008; Sauseng et al., 2009). Unlike the alpha activities in this study, many fMRI studies reported that the parietal signals are positively correlated with the VWM capacity. This is due to the negative relationships between the BOLD signals and alpha activities (Goldman et al., 2002; Laufs et al., 2003; Moosmann et al., 2003; Meltzer et al., 2007; Michels et al., 2008). Therefore, the parietal activities would be associated with the simple maintenance of the mental representations. In contrast to the parietal activities, the frontal theta activity is reported to be associated with executive functions in VWM according to recent human EEG studies using mental manipulation and calculation tasks (Kawasaki et al., 2010). Further, many studies have proposed that frontal activity works to support VWM storage during high VWM demands and incoming distractions (Sakai et al., 2002; Curtis and D’Esposito, 2003; Kawasaki and Watanabe, 2007). For example, frontal activities increase even if the VWM load (number of to-be-remembered objects) is very large (Rypma et al., 2002; Linden et al., 2003).
Next, we identified the frontal beta activities as the brain oscillations that amplified the VWM capacity with monetary rewards, because the delay-period amplitudes were significantly correlated with increasing values of VWM capacity from no-reward to high-reward conditions. The frontal beta amplitudes were also correlated with the reward values that were presented during the reward instruction periods. The frontal beta amplitudes showed a significant correlation between the reward instruction and retention periods. These results suggest that frontal beta activities are associated with motivation and relative evaluation of reward values. Indeed, previous human EEG studies have shown that frontal beta amplitudes enhanced during presentation of monetary reward magnitudes and the probabilities relative to the loss feedback for gambling (Marco-Pallares et al., 2008) and reinforcement learning tasks (Cohen et al., 2007). The enhanced frontal beta activities might be due to reward-related brain networks, because the sustained and phasic temporal patterns with or without monetary reward are similar to the midbrain dopaminergic responses and striatal activities, i.e. the sustained activation for uncertainty and the phasic activation for reward prediction (Fiorillo et al., 2003; McClure et al., 2003; Schultz, 2007). Frontal dopamine-related activity is reported to be enhanced with increasing uncertainty (Rushworth and Behrens, 2008), as shown by enhanced beta activity in this study, suggesting that there is a possible common neural process between uncertainty and anticipation of high rewards. Therefore, it is important to investigate the duration of the beta amplitudes. In addition, the striatum beta activities and local field potentials increased with the gaining of rewards in electrophysiological studies using go/no-go and motor tasks in non-human primates (Bressler et al., 1993; Courtemanche et al., 2003). In another study, rodent olfactory beta oscillations were elicited during the association of a reward with the odorant (Kay et al., 2008).
Thus, this study showed the functional dissociation between theta and beta activities in the frontal regions. The oscillatory activities in the frontal regions are related to previous findings about the functional and spatial dissociation between the frontal regions; the lateral frontal regions for the WM (e.g. Curtis and D’Esposito, 2001) and the medial frontal regions for the reward systems; and the formation, maintenance and updating of action–outcome predictions (Alexander and Brown, 2010, 2011). However, it is worth noting that EEG studies are limited in identifying the precise source of theta and beta activities; therefore, it will be important to identify the detailed neural networks involved in reward motivations in future studies using simultaneous fMRI and EEG.
Regarding the correlation in frontal beta amplitudes between the retention intervals and the reward instruction periods, it is possible that the correlation is due to a temporal autocorrelation between temporally proximal epochs rather than due to the maintenance of reward information throughout the task. To address this issue, we investigated the correlation for the other frequency amplitudes in the same frontal electrode (Fz) and the correlation for the beta amplitudes (24 Hz) in the other electrodes. The significant correlations were not found for the other frequency-band amplitudes in the frontal electrode, such as theta [e.g. 6 Hz, no reward, r(14) = 0.25, P = 0.38; low reward, r(14) = 0.01, P = 0.97; high reward, r(14) = 0.34, P = 0.24] and alpha [e.g. 12 Hz, no reward, r(14) = 0.05, P = 0.87; low reward, r(14) =−0.16, P = 0.63; high reward, r(14) = 0.25, P = 0.38] amplitudes. On the other hand, and with regard to the beta amplitudes of the other electrodes, significant correlations were partially found in many electrodes [e.g. parietal electrode, Pz, no reward, r(14) = 0.31, P = 0.27; low reward, r(14) = 0.59, P < 0.02; high reward, r(14) = 0.62, P < 0.02] indicating the possibility that the beta amplitudes showed an autocorrelation between temporally proximal epochs. However, the beta amplitudes of the ITI were not significantly correlated with those of the reward instruction [Fz, no reward, r(14) = 0.05, P = 0.84; low reward, r(14) = 0.16, P = 0.58; high reward, r(14) = 0.21, P = 0.45; Pz, no reward, r(14) = 0.20, P = 0.48; low reward, r(14) = −0.04, P = 0.88; high reward, r(14) = 0.11, P = 0.69], although the ITI was as close to the reward instruction period as the retention interval was. These results suggest that the correlation of the beta amplitudes reflected the maintenance of reward information throughout the task.
Like the frontal beta amplitudes, the frontal theta and parietal alpha activities also showed positive and negative correlations with the reward values during the reward instruction periods, respectively. The increased amplitude of the frontal theta activity, which is thought to be the origin of mismatch negativity (MMN; i.e. medial frontal negativity, MFN) was also observed in reward anticipation in some EEG studies (Gehring and Willoughby, 2002; Luu et al., 2004; Trujillo and Allen, 2007). Thus, the VWM-related regions are already influenced by motivation when the reward is expected and even before the visual stimulus is stored, resulting in an increase in VWM capacity. It is hypothesized that VWM-related regions prepare for maintaining the upcoming visual stimulus during the reward instruction periods as if it were a resting-state brain activity that is thought to work by consolidation of the past and by preparation for the future (Buckner and Vincent, 2007; Raichle and Snyder, 2007).
Theta–beta coupling for increasing VWM capacity
Finally, the present study demonstrated CFC between fourth theta phases (6 Hz) and beta phases (24 Hz) at the frontal regions, which reflect concurrent theta and beta activities during the retention interval. The CFC was observed only in the high-reward condition. This result indicates an interaction between the VWM and reward systems, which supports the previous hypotheses about the subcortical–cortical interaction that (i) subcortical brain regions, including the striatum, project dopamine-related signals to the prefrontal cortex (Levy et al., 1997); (ii) the beta-phase synchronization of electrode pairs on the scalp during mental calculation is associated with corticostriatal networks in the their analyses of simultaneous EEG/fMRI (Mizuhara et al., 2005) and (iii) the prefrontal cortex and basal ganglia activities precede the attentional filtering of the irrelevant stimulus in VWM encoding reward motivation (McNab and Klingberg, 2008). In addition, our result clarifies the integrative brain structures that facilitate the collaboration between different functional oscillations. Previous studies proposed that CFC reflected the interactions between different cell assemblies operating in different oscillations (Klimesch et al., 2008; Sauseng et al., 2009). For example, theta–alpha phase–phase coupling appeared on task-relevant working memory storage buffers, i.e. at the parietal and temporal electrodes during manipulation of visual and auditory representations, respectively (Kawasaki et al., 2010). Moreover, theta–gamma coupling on the frontal electrodes is thought to reflect the functional linking between frontal and corticolimbic networks during the retention interval of a short-term memory task, although this coupling is modulated by amplitude (Burgess and Ali, 2002; Schack et al., 2002). Taken together, these results and our evidence support the hypothesis that a subcortical–cortical functional dynamic link between VWM-related theta and reward-related beta oscillations at frontal regions facilitates VWM by increasing its capacity with monetary reward motivation.
Conflict of Interest
None declared.
Acknowledgments
The research was supported by Grant-in-Aid for Young Scientists (Start-up) (20800075) and partially supported by Grant-in-Aid for Scientific Research on Innovative areas (21120005 and 22118510). We would like to thank Eri Miyauchi for her supports of our data analyses, and Yuta Kakimoto, Ken’ichi Sawai and Saoko Ikuno for their supports of our data acquisitions
REFERENCES
- Adcock RA, Thangavel A, Whitfield-Gabrieli S, Knutson B, Gabrieli JD. Reward-motivated learning: mesolimbic activation precedes memory formation. Neuron. 2006;50:507–17. doi: 10.1016/j.neuron.2006.03.036. [DOI] [PubMed] [Google Scholar]
- Alexander WH, Brown. JW. Computational models of performance monitoring and cognitive control. Topics in Cognitive Science. 2010;2:658–77. doi: 10.1111/j.1756-8765.2010.01085.x. [DOI] [PMC free article] [PubMed] [Google Scholar]
- Alexander WH, Brown JW. Medial prefrontal cortex as an action-outcome predictor. Nature Neuroscience. 2011;14:1338–44. doi: 10.1038/nn.2921. [DOI] [PMC free article] [PubMed] [Google Scholar]
- Beck SM, Locke HS, Savine AC, Jimura K, Braver TS. Primary and secondary rewards differentially modulate neural activity dynamics during working memory. PLoS One. 2010;5(2):e9251. doi: 10.1371/journal.pone.0009251. [DOI] [PMC free article] [PubMed] [Google Scholar]
- Bressler SL, Coppola R, Nakamura R. Episodic multiregional cortical coherence at multiple frequencies during visual task performance. Nature. 1993;366:153–6. doi: 10.1038/366153a0. [DOI] [PubMed] [Google Scholar]
- Buckner RL, Vincent JL. Unrest at rest: default activity and spontaneous network correlations. Neuroimage. 2007;37:1091–6. doi: 10.1016/j.neuroimage.2007.01.010. [DOI] [PubMed] [Google Scholar]
- Burgess A, Ali L. Functional connectivity of gamma EEG activity is modulated at low frequency during conscious recollection. International Journal of Psychophysiology. 2002;46:91–100. doi: 10.1016/s0167-8760(02)00108-3. [DOI] [PubMed] [Google Scholar]
- Cohen MX, Elger CE, Ranganath C. Reward expectation modulates feedback-related negativity and EEG spectra. Neuroimage. 2007;35:968–78. doi: 10.1016/j.neuroimage.2006.11.056. [DOI] [PMC free article] [PubMed] [Google Scholar]
- Courtemanche R, Fujii N, Graybiel AM. Synchronous, focally modulated beta-band oscillations characterize local field potential activity in the striatum of awake behaving monkeys. Journal of Neuroscience. 2003;23:11741–52. doi: 10.1523/JNEUROSCI.23-37-11741.2003. [DOI] [PMC free article] [PubMed] [Google Scholar]
- Cowan N. The magical number 4 in short-term memory: a reconsideration of mental stage capacity. Behavioral and Brain Sciences. 2001;24:87–114. doi: 10.1017/s0140525x01003922. [DOI] [PubMed] [Google Scholar]
- Curtis CE, D’Esposito M. Persistent activity in the prefrontal cortex during working memory. Trends in Cognitive Sciences. 2003;7:415–23. doi: 10.1016/s1364-6613(03)00197-9. [DOI] [PubMed] [Google Scholar]
- Dahlin E, Neely AS, Larsson A, Bäckman L, Nyberg L. Transfer of learning after updating training mediated by the striatum. Science. 2008;320:1510–2. doi: 10.1126/science.1155466. [DOI] [PubMed] [Google Scholar]
- Delorme A, Makeig S. EEGLAB: an open source toolbox for analysis of single-trial EEG dynamics. Journal of Neuroscience Methods. 2004;134:9–21. doi: 10.1016/j.jneumeth.2003.10.009. [DOI] [PubMed] [Google Scholar]
- Elliott R, Friston KJ, Dolan RJ. Dissociable neural responses in human reward systems. Journal of Neuroscience. 2000;20:6159–65. doi: 10.1523/JNEUROSCI.20-16-06159.2000. [DOI] [PMC free article] [PubMed] [Google Scholar]
- Fiorillo CD, Tobler PN, Schultz W. Discrete coding of reward probability and uncertainty by dopamine neurons. Science. 2003;299:1898–902. doi: 10.1126/science.1077349. [DOI] [PubMed] [Google Scholar]
- Gehring WJ, Willoughby AR. The medial frontal cortex and the rapid processing of monetary gains and losses. Science. 2002;295:2279–82. doi: 10.1126/science.1066893. [DOI] [PubMed] [Google Scholar]
- Gevins AS, Zeitlin GM, Doyle JC, et al. Electroencephalogram correlates of higher cortical functions. Science. 1979;203:665–8. doi: 10.1126/science.760212. [DOI] [PubMed] [Google Scholar]
- Gilbert AM, Fiez JA. Integrating rewards and cognition in the frontal cortex. Cognitive Affective and Behavioral Neuroscience. 2004;4:540–52. doi: 10.3758/cabn.4.4.540. [DOI] [PubMed] [Google Scholar]
- Goldman RI, Stern JM, Engel J, Jr, Cohen MS., . Simultaneous EEG and fMRI of the alpha rhythm. Neuroreport. 2002;13:2487–92. doi: 10.1097/01.wnr.0000047685.08940.d0. [DOI] [PMC free article] [PubMed] [Google Scholar]
- Gottfried JA, O’Doherty J, Dolan RJ. Encoding predictive reward value in human amygdala and orbitofrontal cortex. Science. 2003;301:1104–7. doi: 10.1126/science.1087919. [DOI] [PubMed] [Google Scholar]
- Jaeggi S, Buschkuehl M, Jonides J, Perrig W. Improving fluid intelligence with training on working memory. The Proceedings of the National Academy of Sciences USA. 2008;105:6829–33. doi: 10.1073/pnas.0801268105. [DOI] [PMC free article] [PubMed] [Google Scholar]
- Jensen O, Gelfand J, Kounios K, Lisman JE. Oscillations in the alpha band (9-12 Hz) increase with memory load during retention in a short-term memory task. Cerebral Cortex. 2002;12:877–82. doi: 10.1093/cercor/12.8.877. [DOI] [PubMed] [Google Scholar]
- Jensen O, Tesche C. Frontal theta activity in humans increases with memory load in a working memory task. European Journal of Neuroscience. 2002;15:1395–400. doi: 10.1046/j.1460-9568.2002.01975.x. [DOI] [PubMed] [Google Scholar]
- Kable JW, Glimcher PW. The neural correlates of subjective value during intertemporal choice. Nature Neuroscience. 2007;10:1625–33. doi: 10.1038/nn2007. [DOI] [PMC free article] [PubMed] [Google Scholar]
- Kawasaki M, Kitajo K, Yamaguchi Y. Dynamic links between theta executive functions and alpha storage buffers in auditory and visual working memory. European Journal of Neuroscience. 2010;31:1683–9. doi: 10.1111/j.1460-9568.2010.07217.x. [DOI] [PMC free article] [PubMed] [Google Scholar]
- Kawasaki M, Watanabe M. Oscillatory gamma and theta activity during repeated mental manipulations of a visual image. Neuroscience Letters. 2007;422:141–5. doi: 10.1016/j.neulet.2007.04.079. [DOI] [PubMed] [Google Scholar]
- Kawasaki M, Watanabe M, Okuda J, Sakagami M, Aihara K. Human posterior parietal cortex maintains color, shape and motion in visual short-term memory. Brain Research. 2008;1213:91–7. doi: 10.1016/j.brainres.2008.03.037. [DOI] [PubMed] [Google Scholar]
- Kay LM, Beshel J, Brea J, Martin C, Rojas-Líbano D, Kopell N. Olfactory oscillations: the what, how and what for. Trends in Neurosciences. 2008;32:207–14. doi: 10.1016/j.tins.2008.11.008. [DOI] [PMC free article] [PubMed] [Google Scholar]
- Klimesch W, Freunberger R, Sauseng P, Gruber W. A short review of slow phase synchronization and memory: evidence for control processes in different memory systems? Brain Research. 2008;1235:31–44. doi: 10.1016/j.brainres.2008.06.049. [DOI] [PubMed] [Google Scholar]
- Knutson B, Bjork JM, Fong GW, Hommer DW, Mattay VS, Weinberger DR. Amphetamine modulates human incentive processing. Neuron. 2004;43:261–9. doi: 10.1016/j.neuron.2004.06.030. [DOI] [PubMed] [Google Scholar]
- Knutson B, Fong GW, Adams CM, Varner JL, Hommer D. Dissociation of reward anticipation and outcome with event-related fMRI. Neuroreport. 2001;12:3683–7. doi: 10.1097/00001756-200112040-00016. [DOI] [PubMed] [Google Scholar]
- Krawczyk DC, Gazzaley A, D’Esposito M. Reward modulation of prefrontal and visual association cortex during an incentive working memory task. Brain Research. 2007;1141:168–77. doi: 10.1016/j.brainres.2007.01.052. [DOI] [PubMed] [Google Scholar]
- Lachaux JP, Rodriguez E, Martinerie J, Varela FJ. Measuring phase synchrony in brain signals. Human Brain Mapping. 1999;8:194–208. doi: 10.1002/(SICI)1097-0193(1999)8:4<194::AID-HBM4>3.0.CO;2-C. [DOI] [PMC free article] [PubMed] [Google Scholar]
- Laufs H, Kleinschmidt A, Beyerle A, et al. EEG-correlated fMRI of human alpha activity. Neuroimage. 2003;19:1463–76. doi: 10.1016/s1053-8119(03)00286-6. [DOI] [PubMed] [Google Scholar]
- Levy R, Friedman HR, Davachi L, Goldman-Rakic PS. Differential activation of the caudate nucleus in primates performing spatial and nonspatial working memory tasks. Journal of Neuroscience. 1997;17:3870–82. doi: 10.1523/JNEUROSCI.17-10-03870.1997. [DOI] [PMC free article] [PubMed] [Google Scholar]
- Linden DEJ, Bittner RA, Muckli L, et al. Cortical capacity constraints for visual working memory: dissociation of fMRI load effects in a front-parietal network. Neuroimage. 2003;20:1518–30. doi: 10.1016/j.neuroimage.2003.07.021. [DOI] [PubMed] [Google Scholar]
- Luck SJ, Vogel EK. The capacity of visual working memory for features and conjunctions. Nature. 1997;390:279–81. doi: 10.1038/36846. [DOI] [PubMed] [Google Scholar]
- Luu P, Tucker DM, Makeig S. Frontal midline theta and the error-related negativity: neurophysiological mechanisms of action regulation. Clinical Neurophysiology. 2004;115:1821–35. doi: 10.1016/j.clinph.2004.03.031. [DOI] [PubMed] [Google Scholar]
- Marco-Pallares J, Cucurell D, Cunillera T, et al. Human oscillatory activity associated to reward processing in a gambling task. Neuropsychologia. 2008;46:241–8. doi: 10.1016/j.neuropsychologia.2007.07.016. [DOI] [PubMed] [Google Scholar]
- McClure SM, Berns GS, Montague PR. Temporal prediction errors in a passive learning task activate human striatum. Neuron. 2003;38:339–46. doi: 10.1016/s0896-6273(03)00154-5. [DOI] [PubMed] [Google Scholar]
- McNab F, Klingberg T. Prefrontal cortex and basal ganglia control access to working memory. Nature Neuroscience. 2008;11:103–7. doi: 10.1038/nn2024. [DOI] [PubMed] [Google Scholar]
- McNab F, Varrone A, Farde L, et al. Changes in cortical dopamine D1 receptor binding associated with cognitive training. Science. 2009;323:800–2. doi: 10.1126/science.1166102. [DOI] [PubMed] [Google Scholar]
- Meltzer JA, Negishi M, Mayes LC, Constable RT. Individual differences in EEG theta and alpha dynamics during working memory correlate with fMRI responses across subjects. Clinical Neurophysiology. 2007;118:2419–36. doi: 10.1016/j.clinph.2007.07.023. [DOI] [PMC free article] [PubMed] [Google Scholar]
- Michels L, Moazami-Goudarzi M, Jeanmonod D, Sarnthein J. EEG alpha distinguishes between cuneal and precuneal activation in working memory. NeuroImage. 2008;40:1296–310. doi: 10.1016/j.neuroimage.2007.12.048. [DOI] [PubMed] [Google Scholar]
- Mizuhara H, Wang LQ, Kobayashi K, Yamaguchi Y. A long-range cortical network emerging with theta oscillation in a mental task. Neuroreport. 2004;15:1233–8. doi: 10.1097/01.wnr.0000126755.09715.b3. [DOI] [PubMed] [Google Scholar]
- Mizuhara H, Wang LQ, Kobayashi K, Yamaguchi Y. Long-range EEG phase-synchronization during an arithmetic task indexes a coherent cortical network simultaneously measured by fMRI. NeuroImage. 2005;27:553–63. doi: 10.1016/j.neuroimage.2005.04.030. [DOI] [PubMed] [Google Scholar]
- Moosmann M, Ritter P, Krastel I, et al. Correlates of alpha rhythm in functional magnetic resonance imaging and near infrared spectroscopy. Neuroimage. 2003;20:145–58. doi: 10.1016/s1053-8119(03)00344-6. [DOI] [PubMed] [Google Scholar]
- O’Doherty J, Kringelbach ML, Rolls ET, Hornak J, Andrews C. Abstract reward and punishment representation in the human orbitofrontal cortex. Nature Neuroscience. 2001;4:95–102. doi: 10.1038/82959. [DOI] [PubMed] [Google Scholar]
- Olesen PJ, Westerberg H, Klingberg T. Increased prefrontal and parietal activity after training of working memory. Nature Neuroscience. 2003;7:75–9. doi: 10.1038/nn1165. [DOI] [PubMed] [Google Scholar]
- Perrin F, Pernier J, Bertrand O, Echallier JF. Spherical splines for scalp potential and current density map reading. Electroencephalography and Clinical Neurophysiology. 1989;72:184–7. doi: 10.1016/0013-4694(89)90180-6. [DOI] [PubMed] [Google Scholar]
- Pochon JB, Levy R, Fossati P, et al. The neural system that bridges reward and cognition in humans: an fMRI study. The Proceedings of the National Academy of Sciences USA. 2002;99:5669–74. doi: 10.1073/pnas.082111099. [DOI] [PMC free article] [PubMed] [Google Scholar]
- Raichle ME, Snyder AZ. A default mode of brain function: a brief history of an evolving idea. Neuroimage. 2007;37:1083–90. doi: 10.1016/j.neuroimage.2007.02.041. [DOI] [PubMed] [Google Scholar]
- Rowe JB, Toni I, Josephs O, Frackowiak RSJ, Passingham RE. The prefrontal cortex: response selection or maintenance within working memory? Science. 2000;288:1656–60. doi: 10.1126/science.288.5471.1656. [DOI] [PubMed] [Google Scholar]
- Rushworth MFS, Behrens TEJ. Choice, uncertainty and value in prefrontal and cingulate cortex. Nature Neuroscience. 2008;11:389–97. doi: 10.1038/nn2066. [DOI] [PubMed] [Google Scholar]
- Rypma B, Berger JS, D’Esposito M. The influence of working-memory demand and subject performance on prefrontal cortical activity. Journal of Cognitive Neuroscience. 2002;14:721–31. doi: 10.1162/08989290260138627. [DOI] [PubMed] [Google Scholar]
- Rypma B, Gabrieli JDE. Functional neuroimaging of short-term memory: the neural mechanisms of mental storage. Behavioral and Brain Sciences. 2001;24(1):143–4. [Google Scholar]
- Sakai K, Rowe JB, Passingham RE. Active maintenance in prefrontal area 46 creates distractor-resistant memory. Nature Neuroscience. 2002;5:479–84. doi: 10.1038/nn846. [DOI] [PubMed] [Google Scholar]
- Sauseng P, Klimesch W, Heise K, et al. Brain oscillatory substrates of visual shor-term memory capacity. Current Biology. 2009;19:1846–52. doi: 10.1016/j.cub.2009.08.062. [DOI] [PubMed] [Google Scholar]
- Sauseng P, Klimesch W, Schabus M, Doppelmayr M. Fronto-parietal EEG coherence in theta and upper alpha reflect central executive functions of working memory. International Journal of Psychophysiology. 2005;57:97–103. doi: 10.1016/j.ijpsycho.2005.03.018. [DOI] [PubMed] [Google Scholar]
- Schack B, Vath N, Petsche H, Geissler HG, Moller E. Phase-coupling of theta-gamma EEG rhythms during short-term memory processing. International Journal of Psychophysiology. 2002;44:143–63. doi: 10.1016/s0167-8760(01)00199-4. [DOI] [PubMed] [Google Scholar]
- Schultz W. Predictive reward signal of dopamine neurons. J. Neurophysiol. 1998;80:1–27. doi: 10.1152/jn.1998.80.1.1. [DOI] [PubMed] [Google Scholar]
- Schultz W. Behavioral dopamine signals. Trends in Neurosciences. 2007;30:203–10. doi: 10.1016/j.tins.2007.03.007. [DOI] [PubMed] [Google Scholar]
- Schultz W, Apicella P, Scarnati E, Ljungberg T. Neuronal activity in monkey ventral striatum related to the expectation of reward. Journal of Neuroscience. 1992;12:4595–610. doi: 10.1523/JNEUROSCI.12-12-04595.1992. [DOI] [PMC free article] [PubMed] [Google Scholar]
- Smith EE, Jonides J. Storage and executive processes in the frontal lobes. Science. 1999;283:1657–61. doi: 10.1126/science.283.5408.1657. [DOI] [PubMed] [Google Scholar]
- Tallon-Baudry C, Bertrand O, Delpuech C, Pernier J. Oscillatory gamma-band (30-70 Hz) activity induced by a visual search task in humans. Journal of Neuroscience. 1997;17:722–34. doi: 10.1523/JNEUROSCI.17-02-00722.1997. [DOI] [PMC free article] [PubMed] [Google Scholar]
- Taylor SF, Welsh RC, Wager TD, Phan KL, Fitzgerald KD, Gehring WJ. A functional neuroimaging study of motivation and executive function. Neuroimage. 2004;21:1045–54. doi: 10.1016/j.neuroimage.2003.10.032. [DOI] [PubMed] [Google Scholar]
- Todd JJ, Marois R. Capacity limit of visual short-term memory in human posterior parietal cortex. Nature. 2004;428:751–4. doi: 10.1038/nature02466. [DOI] [PubMed] [Google Scholar]
- Todd JJ, Marois R. Posterior parietal cortex activity predicts individual differences in visual short-term memory capacity. Cognitive Affective and Behavioral Neuroscience. 2005;5:144–55. doi: 10.3758/cabn.5.2.144. [DOI] [PubMed] [Google Scholar]
- Trujillo LT, Allen JJ. Theta EEG dynamics of the error-related negativity. Clinical Neurophysiology. 2007;118:645–68. doi: 10.1016/j.clinph.2006.11.009. [DOI] [PubMed] [Google Scholar]
- Varela F, Lachaux JP, Rodriguez E, Martinerie J. The brainweb: phase synchronization and large-scale integration. Nature Reviews Neuroscience. 2001;2:229–39. doi: 10.1038/35067550. [DOI] [PubMed] [Google Scholar]
- Vogel EK, Machizawa MG. Neural activity predicts individual differences in visual working memory capacity. Nature. 2004;428:748–51. doi: 10.1038/nature02447. [DOI] [PubMed] [Google Scholar]
- Watanabe M, Cromwell HC, Tremblay L, Hollerman JR, Hikosaka K, Schultz W. Behavioral reactions reflecting differential reward expectation in monkeys. Experimental Brain Research. 2002a;140:511–8. doi: 10.1007/s002210100856. [DOI] [PubMed] [Google Scholar]
- Watanabe M, Hikosaka K, Sakagami M, Shirakawa S. Coding and monitoring of motivational context in the primate prefrontal cortex. Journal of Neuroscience. 2002b;22:2391–400. doi: 10.1523/JNEUROSCI.22-06-02391.2002. [DOI] [PMC free article] [PubMed] [Google Scholar]
- Wise RA. Dopamine, learning and motivation. Nature Reviews Neuroscience. 2004;5:483–94. doi: 10.1038/nrn1406. [DOI] [PubMed] [Google Scholar]
- Wittmann BC, Schott BH, Guderian S, Frey JU, Heinze H-J, Düzel E. Reward-related FMRI activation of dopaminergic midbrain is associated with enhanced hippocampus-dependent long-term memory formation. Neuron. 2005;45:459–67. doi: 10.1016/j.neuron.2005.01.010. [DOI] [PubMed] [Google Scholar]