

Abstract
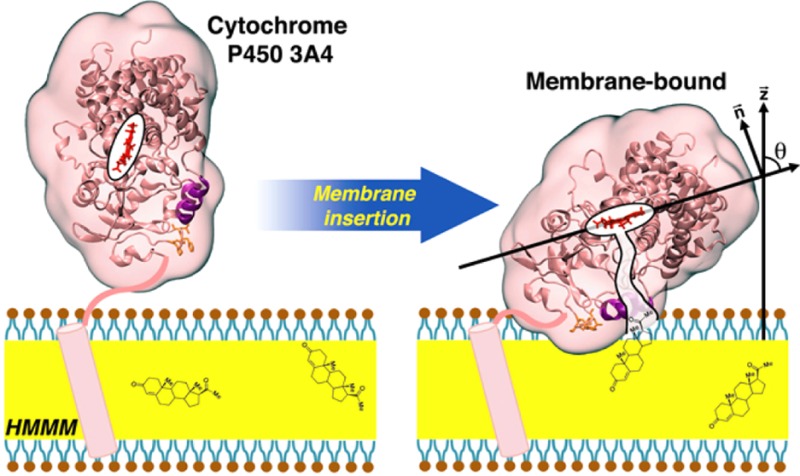
Cytochrome P450 3A4 (CYP3A4) is the most abundant membrane-associated isoform of the P450 family in humans and is responsible for biotransformation of more than 50% of drugs metabolized in the body. Despite the large number of crystallographic structures available for CYP3A4, no structural information for its membrane-bound state at an atomic level is available. In order to characterize binding, depth of insertion, membrane orientation, and lipid interactions of CYP3A4, we have employed a combined experimental and simulation approach in this study. Taking advantage of a novel membrane representation, highly mobile membrane mimetic (HMMM), with enhanced lipid mobility and dynamics, we have been able to capture spontaneous binding and insertion of the globular domain of the enzyme into the membrane in multiple independent, unbiased simulations. Despite different initial orientations and positions of the protein in solution, all the simulations converged into the same membrane-bound configuration with regard to both the depth of membrane insertion and the orientation of the enzyme on the surface of the membrane. In tandem, linear dichroism measurements performed on CYP3A4 bound to Nanodisc membranes were used to characterize the orientation of the enzyme in its membrane-bound form experimentally. The heme tilt angles measured experimentally are in close agreement with those calculated for the membrane-bound structures resulted from the simulations, thereby verifying the validity of the developed model. Membrane binding of the globular domain in CYP3A4, which appears to be independent of the presence of the transmembrane helix of the full-length enzyme, significantly reshapes the protein at the membrane interface, causing conformational changes relevant to access tunnels leading to the active site of the enzyme.
Introduction
Cytochrome P450 (CYP) constitutes a large family of heme-containing enzymes that are present in a wide variety of organisms and are involved in the metabolism of both xenobiotics (e.g., drugs) and endogenous compounds such as steroidal hormones.1 CYPs are found in both soluble and membrane-bound forms. They function by oxidizing a broad spectrum of both water-soluble and lipophilic molecules. One of the key aspects of their function is the mechanism and pathway by which various molecular species gain access to the active site of the enzyme, a process that is particularly important for membrane-associated CYPs. The crystal structures of a large number of CYPs, in both apo and substrate-bound forms, have been solved; however, they provide limited information on these pathways.2 In particular, substrate access through the membrane, which is suggested to be the main mechanism for lipophilic and amphiphilic substrates to gain access to the active site of CYPs,3,4 is largely unknown, as a complete description of the involved pathways relies on the characterization of the enzyme structure, and more importantly its dynamics, in its membrane-associated form.
Human CYPs are anchored in the cellular membrane by an N-terminal transmembrane α helix.5,6 However, a large body of evidence strongly suggests that the globular, enzymatic part of the protein directly interacts with the surface of the membrane.6−8 Naturally, such direct interactions are key to the orientation and partitioning of the enzyme on the surface of the membrane, which are the main determinants of substrate’s efficient access to the enzyme from the membrane.
In humans, cytochrome P450 3A4 (CYP3A4) is the most abundant isoform. It is present in the liver and in the small intestine,9 and it is responsible for the metabolism of more than 50% of clinically used drugs that are metabolized in the body,10,11 indicating a high ligand promiscuity when compared to other human CYP enzymes. Due to its broad involvement in drug metabolism, CYP3A4 plays a key role in determining the bioavailability and, thereby, the effective plasma concentration of a wide range of pharmacological compounds in the body. Similarly, CYP3A4 is a key element in side effects of drugs in which the metabolites are the main source of toxicity, as well as in drug–drug interactions due to its promiscuous substrate specificity and malleable active site.12,13 To date, over 1000 compounds, including inhibitors and inducers of CYP3A4, have been identified that interact with and affect the activity of CYP3A4.14
Accumulating evidence has strongly indicated that the interaction of CYPs with the cellular membrane contributes to the recruitment of liposoluble substrates to the active site of the enzyme.3,4 Therefore, in order to understand its effects in the body, it is crucial to understand the interaction of CYP3A4 with the membrane at an atomic resolution. To date, several X-ray structures of CYP3A4 with a truncated N-terminal transmembrane helix have been solved, both in the ligand-free form and bound to a variety of ligands.12,15−19 These structures have not only established that CYP3A4 presents an overall fold similar to other CYPs (Figure 1) but also revealed functionally relevant aspects, such as the ability of CYP3A4 to bind to a broad range of molecules of different sizes12,15−19 and a malleable active site that might even allow binding of two ligands simultaneously,12 a feature that had been suggested on the basis of the atypical kinetic behavior exhibited by the enzyme.20−22
Figure 1.
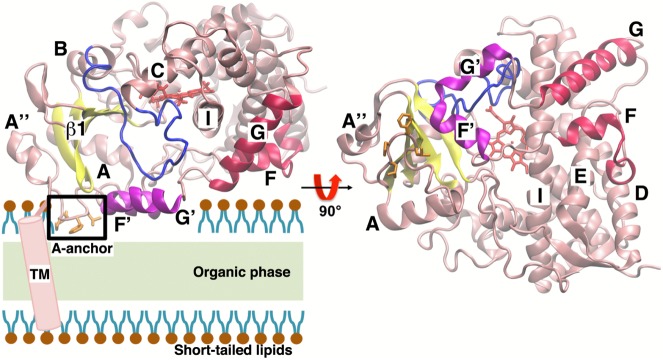
Structure of CYP3A4: two views, rotated by 90°, showing the side (left) and bottom (right) views of the globular domain. A schematic of the location of the TM helix with respect to the globular domain is included in the side view. The structure presents a fold similar to other P450 enzymes, consisting of an N-terminal β-sheet domain and a helical C-terminal domain, containing the cofactor heme (red stick representation) and the active site. The nomenclature used for the secondary structure elements was adopted from ref (54). The side chains forming A-anchor are shown in orange stick representation in both views and boxed in the side view. Also depicted in the figure is a schematic representation of the HMMM membrane, highlighting the location of the organic phase and the short-tailed lipids.
Structural dynamics of human CYPs have been studied with molecular dynamics (MD) simulations. Several previous MD studies of CYP3A4 aimed at studying the interaction of the enzyme with some of its ligands, focusing on the gating mechanisms involved in the access/egress of the ligands from the active site23,24 and on the underlying mechanism of positive homotropic cooperativity observed upon binding of two ligands.25 Other simulation studies investigated the dynamics of water molecules in different human CYPs, including CYP3A4.26 Despite providing insightful information about the dynamics of CYP3A4, these studies were performed mostly without taking into account the interaction of the enzyme with a membrane, which could affect both structural and dynamical properties of CYP3A4. In a recent simulation study of membrane-bound CYP3A4 by Denisov et al.,27 it was shown that interaction with the membrane affects the opening/closing of the access tunnels observed in the crystal structures. Moreover, MD studies with human CYP2C9 in the presence of the membrane have shown that interaction of the enzyme with the membrane favors the opening of additional access tunnels not identified in the crystal structures.28,29
An experimentally observable yet unexplored aspect of CYP3A4 is the orientation of the enzyme in its membrane-bound form. The angle between the heme plane and the membrane plane, termed the heme tilt angle, has been estimated experimentally to be between 38° and 78° for several other CYPs isoforms30 but not for CYP3A4. For CYP2C9, MD studies have suggested that the enzyme might even adopt two different orientations upon membrane binding, corresponding to two different conformations of the F-G loop of this isoform.29 The orientation that the enzyme takes after binding to the membrane might have implications not only in efficient substrate recruitment but also in the rate of electron transfer from the CYP reductase necessary for the oxidation reaction.29,31
In order to study the binding and interaction of CYP3A4 with the membrane, we have performed MD simulations employing a novel membrane representation, termed highly mobile membrane mimetic (HMMM), which was recently developed in our lab.32 This membrane model employs a biphasic solvent system33 together with short-tailed lipids located at the organic/water interface. Due to the reduced entanglement of the shortened lipid tails and the fluid nature of the hydrophobic core, the HMMM membrane allows for an increase of 1–2 orders of magnitude in the lateral diffusion of the lipids, thereby accelerating the association of proteins with the bilayer without the need for external biases or forces, while preserving the atomistic details of the interactions between the protein and lipid headgroups.32 In multiple independent simulations, spontaneous binding and insertion of the globular domain of CYP3A4 was captured, resulting in a convergent model for the membrane-bound form of CYP3A4, whose insertion depth and orientation on the membrane are preserved after transformation of the HMMM model to a full lipid bilayer. Complementary to the simulations, a series of planar waveguide linear dichroism measurements were performed to characterize the heme tilt angle of CYP3A4 bound to a Nanodisc, a membrane system that is water-soluble and preserves the structure and activity of membrane proteins.34 The measurements were performed by first determining the dichroic ratio of a monolayer of Nanodisc-incorporated CYP3A4 protein, and then calculating the orientation of the CYP3A4 within the lipid bilayer. Together, the structural models resulting from the simulations and experimental measurements allow for a detailed description of the enzyme in its membrane-bound form. Furthermore, the simulations also reveal some of the membrane-induced conformational changes in CYP3A4 that might affect the accessibility of the active site to substrates approaching from the membrane.
Materials and Methods
Details of the simulations and experiments are presented in the following two sections. A more detailed description of derivation of the dichroic ratio is included in Supporting Information.
Simulation Procedures
Preparation of HMMM Membrane
The HMMM membrane patch was constructed by placing two leaflets of short-tailed lipids at the interface of water and 1,1-dichloroethane (DCLE), as described in detail elsewhere.32 The phosphatidylcholine (PC) headgroup was selected for this study because of its relevance to membrane composition of eukaryotic cells. The lipids used in the membrane patch were constructed starting from palmitoyloleoylphosphatidylcholine (POPC) molecule as a template and shortening its lipid tails to only five carbons.32 The HMMM membrane was then assembled by use of Packmol software35 by constructing a DCLE box, with dimensions of 100 × 100 × 10 Å3 and containing 5840 molecules of the organic solvent, and placing 300 short-tailed PC lipids on its large faces, with 150 lipids in each leaflet. The resulting structure was then solvated with water by use of the SOLVATE plugin of VMD,36 yielding a system of ∼66 000 atoms. The solvated membrane mimetic system was energy-minimized for 10 000 steps and simulated for 2 ns, by use of an NPnAT ensemble with constant area, and with a target normal pressure and temperature of 1.0 atm and 310 K, respectively. A constant area of 11 236 Å2 (106 × 106 Å2) was employed, yielding an area of ∼75 Å2/lipid (AL), which is ∼8% higher than the experimental AL for POPC.37 This was done to account for the area of the membrane that would be occupied by the protein upon its insertion. On the basis of our experience with several other peripheral proteins, a mild increase (5–8%) in the area can significantly accelerate the process. The resulting membrane was employed in all subsequent simulations of membrane binding and dynamics of CYP3A4.
CYP3A4 Model and Initial Configurations
The ligand-free crystal structure of CYP3A416 was obtained from the RCSB Protein Data Bank38 (PDB entry 1TQN). The missing residues Lys-282, Glu-283, Thr-284, and Glu-285 were added by use of the program MODELLER 9v10.39 Crystallographic water molecules were maintained in the model. For the first part of this study the N-terminal transmembrane (TM) helix (27 residues), which is also missing from the crystal structures, was not modeled, as the main aim was to independently characterize membrane binding and insertion of the globular domain of the enzyme. In the second part of the study, two models including the TM helix were constructed by adding the TM helix to one of the membrane-bound CYP3A4 structures obtained from the simulations in the first part of the study. One model included all N-terminal 27 residues of CYP3A4 (full-length CYP3A4), while the other model included a truncated TM helix, which does not include the first 12 residues and has a S18F point mutation. These systems are referred to as WT-TM and truncated-TM simulation systems, respectively. The truncated-TM model was designed and simulated to match the sequence of CYP3A4 employed during the experimental measurements reported in this study. The additional TM residues were added to the membrane-bound CYP3A4 by use of MODELLER 9v10.39
In the first set of simulations, hereby referred to as “membrane binding” simulations, the globular domain of CYP3A4 (i.e., without the TM helix) was placed in five different initial orientations and between 7 and 13 Å above the surface of the membrane. These systems will be referred to as Mem-1 through Mem-5 hereafter. The initial orientations were obtained by first aligning the three principal axes of the protein to the xyz axes, respectively, and then rotating the principal axis aligned to z in different planes, thus resulting in five different initial heme tilt angles. An additional layer of water was then added to the resulting structure by use of the SOLVATE plugin, and a concentration of 100 mM Na+ and Cl– ions was generated in the systems by use of the AUTOIONIZE plugin of VMD.36 The resulting initial systems then consisted of a box with dimensions 100 × 100 × 130 Å3 and containing ∼140 000 atoms. In addition and as a control, CYP3A4 was also simulated in an aqueous solution, that is, in the absence of a membrane. For the solution simulation, CYP3A4 was solvated with water by use of the SOLVATE plugin of VMD with a minimum padding of 10 Å in all directions, resulting in a box with dimensions of 89 × 95 × 107 Å3 including ∼62 000 atoms. All systems were energy-minimized for 10 000 steps and relaxed further for 100 ps with the Cα atoms of the protein restrained (k = 5 kcal·mol–1·Å–2), except for the residues that were modeled and added to the crystal structure. Then systems Mem-1 through Mem-5 and the solvated CYP3A4 were simulated each for 50 ns, while systems WT-TM and truncated-TM were simulated each for 40 ns. For the HMMM simulations, a harmonic constraint on the z-position, with a force constant k = 0.05 kcal·mol–1·Å–2, was applied to the carbonyl atoms of the PC lipids, in order to restrain the position of the short-tailed lipids to mimic the atomic distributions of a full lipid bilayer more closely and to prevent their occasional diffusion into the aqueous solution, which is expected for short-tailed lipids (surfactants).
In addition to the HMMM simulation systems, and in order to further examine the stability and dynamics of the resulting membrane-bound CYP3A4 from these simulations, a simulation employing a full POPC lipid bilayer was also performed. A membrane-bound model of the globular domain of CYP3A4 was adopted from one of the last frames of one of the HMMM simulations described above. The lipid bilayer was then grown (transformed) into a full lipid bilayer by removing the DCLE molecules and adding the missing carbons of the lipid tails while preserving the positions of the lipid atoms already present in the HMMM model (headgroups and initial few carbons of the lipid tails). In order to further optimize the process, the positions of the newly added atoms in the lipid tails were based on the coordinates of randomly selected lipid molecules from a separately equilibrated POPC membrane. During these steps, the original contacts established between the lipids and CYP3A4 during the HMMM membrane-binding simulations were preserved. This system, which is referred to as the POPC system, was then minimized and equilibrated for 100 ps while constraining the heavy atoms of the protein, the short-tailed lipids (already present before adding the new atoms) to allow for the newly added atoms to relax. Following this step, the system was simulated without constraints for 40 ns.
Simulation Conditions and Protocols
All the simulations were performed with NAMD240 utilizing the CHARMM27 force field with cMAP41 corrections for the protein and CHARMM3642 for lipids. The TIP3P model was used for water.43 All simulations, except system POPC, were performed as an NPnAT ensemble at 1.0 atm and 310 K and with a time step of 2 fs. The POPC system was simulated as an NPT ensemble. A constant area of 11 236 Å2 (106 × 106 Å2) was employed for NPnAT. Constant pressure was maintained by the Nosé–Hoover Langevin piston method,44,45 and constant temperature was maintained by Langevin dynamics with a damping coefficient γ of 0.5 ps–1 applied to all atoms. Nonbonded interactions were cut off after 12 Å with a smoothing function applied after 10 Å. The particle mesh Ewald (PME) method46 was used for long-range electrostatic calculations with a grid density greater than 1 Å–3.
Identification of Access Tunnels to the Active Site
Access tunnels to the active site were characterized by use of MolAxis,47 which identifies tunnels and cavities in macromolecules via computational geometry techniques. Snapshots of the protein were obtained every 100 ps from the last 40 ns of the trajectories, which in all the membrane binding simulations corresponded to the period after CYP3A4 has completed its binding and insertion into the membrane. The access tunnels to the active site were calculated for each snapshot. In order to cluster the tunnels calculated for each different snapshots, an average structure over the last 40 ns of the trajectory of the bound CYP3A4 for each simulated system was obtained and the access tunnels of these average structures were used as references for their respective system. Then, for each system, the spatial overlap between each reference tunnel and each tunnel from the trajectory snapshots was calculated. Tunnels from different snapshots were assumed to be the same when they had a spatial overlap of at least 70% with the same reference tunnel. The bottleneck radius and the bottleneck residues for each identified access tunnel were obtained from the MolAxis calculations. All tunnels with a bottleneck radius ≥1.2 Å were included in the analysis of open cavities within the protein.
Experimental Procedures
CYP3A4 was expressed with a histidine affinity tag from the NF-14 construct in the pCWOri+ vector, purified, and incorporated into POPC Nanodisc lipid bilayers as previously described.34 The Nanodiscs were stored in a buffer (50 mM Tris-HCl, pH 7.4, and 0.3 M NaCl) before use. A commercially available 405 nm diode laser was used in the laser module. The laser spot was reduced by use of an iris, and any stray polarization was excluded by use of a Glan-Taylor polarizer (Melles Griot). The laser assembly was mounted on a rotational stage to precisely modulate the polarization of light. The laser was shone on the glass slide assembly, which used two BK7 prisms (Edmund Optics) to couple the light in and out of the internal reflection element (IRE). The IRE substrates used were SuperClean 2 microarray substrates (Arrayit Corp.) with dimensions of 25 × 76 × 0.940 mm. The out-coupled light went through a band-pass filter and onto a light diffuser before being detected by a phototube (Oriel Instruments). The output of the phototube was amplified by a low-noise current amplifier (Stanford Research Systems) before being measured by a digital multimeter (Hewlett-Packard). The background signal was measured by placing several drops of the buffer on a glass substrate slide and measuring the signal. In order to facilitate adsorption onto the glass slide, MgCl2 was added to the buffer before addition of Nanodiscs.48 Subsequently, CYP3A4 Nanodiscs were added to the buffer on the substrate so that total concentration of CYP3A4 was ∼100 nM and total concentration of MgCl2 was 10 mM. Adsorbed Nanodiscs formed a thin monolayer film at the interface between the glass slide and the bulk solution. After 30 min (required for adsorption), the slide was flushed with 3 volumes of buffer to wash away nonadsorbed analytes. The final signal was compared to the background signal to calculate the thin film absorbance.
Calculation of CYP3A4 Orientation from Linear Dichroism Measurements
Light inside an IRE is totally reflected internally and has no transmitted element. From the electric field amplitudes of the evanescent wave along the laboratory axes, it is possible to calculate the absorbance of a chromophore that is adsorbed to the surface of the IRE.49 Since a heme ring can be modeled as a circular oscillator50 and the transition moments are degenerate, the absorbance can be broken down into the three components along the laboratory axes and simplified to the following three equations:49
| 1 |
| 2 |
| 3 |
where μ is the absorption transition moment; Ex, Ey, and Ez are the components of the electric field; and θ, the orientation angle, is the angle between the transition moment and the laboratory z-axis. The subscripts TE and TM refer to transverse electric polarized and transverse magnetic polarized light, respectively. TE polarized light is oriented in the y direction, and only absorbers with a transition moment component in the y direction will absorb it, whereas TM polarized light is oriented in the x and z directions, thus only absorbers with transition moment components lying in the x or z direction will be able to absorb this light. The ratio of the absorbance of TE to TM polarized light, the dichroic ratio, can be used to determine the orientation of the absorber.51 The following equation relates the dichroic ratio to the orientation angle, using eqs 1, 2, and 3:
| 4 |
where ρ is the dichroic ratio and θ is the angle between the transition moment vector and the laboratory z-axis. Since CYP3A4 is a heme protein, it is possible to use the heme as the absorber and monitor the orientation of the protein in the lipid bilayer. The heme moiety has a strong absorption at the Soret band, with CYP3A4 having a molar absorptivity on the order of 106 M–1·cm–1.
Results and Discussion
Spontaneous Binding and Insertion of CYP3A4 into the Membrane
In order to study the binding of CYP3A4 to the membrane, five different orientations of the globular domain of the enzyme (not including the TM helix) initially placed above the PC lipid bilayer were simulated, each for 50 ns (Mem-1 to Mem-5). Spontaneous binding of CYP3A4 with the HMMM membrane was consistently observed in all the simulations. Membrane binding did not require the use of external forces or biasing potentials, thus resulting in an unbiased positioning of the enzyme at the lipid–water interface within the first 10 ns of simulation. For the five different starting positions tested, CYP3A4 first encounters the membrane through its hydrophobic helices F′ and G′ (Figure 1) and with a hydrophobic anchor composed of residues Leu-44, Pro-45, Phe-46, and Leu-47. This hydrophobic anchor, which is located between helices A″ and A and that we term A-anchor hereafter, is one of the features that distinguishes CYP3A4 from other CYP isoforms. A-anchor has been hypothesized to mediate the interaction with the membrane,15 together with the hydrophobic helices F′ and G′,7,16 on the basis of its location in the globular domain of the enzyme. After the first encounter with the membrane, the enzyme is rapidly inserted into the membrane and remains bound to it for the remainder of the simulation, as exemplified in Figure 2 for simulation Mem-1. In less than 10 ns, A-anchor establishes contacts with the lipid headgroups, as characterized by monitoring the position of the anchor with respect to PO4 and choline groups (Figure 2). In systems Mem-2 and Mem-5, A-anchor remains buried below the PO4 level for the remainder of the simulation, while in systems Mem-1, Mem-3, and Mem-4, the anchor fluctuates within the region between the PO4 and the choline groups. Interestingly, and functionally highly relevant, A-anchor inserts deeper into the membrane than helices F′ and G′. Helices F′ and G′ are stabilized at a level close to the lipid headgroups after 10 ns (Figure 2) but do not completely insert into the membrane, with helix G′ establishing a closer contact to the membrane than helix F′. For the five independent membrane binding simulations, the depth of insertion of A-anchor and of helices F′ and G′ converges to the same range of values, with the residues located in these three elements forming the majority of the hydrophobic contacts between CYP3A4 and the membrane after insertion (Figure S1, Supporting Information).
Figure 2.

Spontaneous insertion of CYP3A4 into the membrane. (Top) Snapshots taken at different time points from the simulation system Mem-1. (Bottom right) Close-up view of the membrane-bound form of CYP3A4, highlighting residues inserting directly into and interacting with the membrane. The hydrophobic side chains of A-anchor, formed by residues Leu-44, Pro-45, Phe-46, and Leu-47, and of helix G′ are shown in stick representation in orange and magenta, respectively. (Bottom left) Time evolution of average height of the center of mass of A-anchor and helices F′ and G′ in different simulations. The average height is shown for the five simulations. The average positions of the phosphorus (PO4) group and the nitrogen (choline) atoms of the lipid headgroups are shown as gray and brown dotted lines, respectively.
Orientation of Membrane-Bound CYP3A4
Experimentally, it is difficult to measure characteristic parameters of membrane-bound proteins, such as depth of insertion or orientation. In the case of CYPs, although measuring the insertion depth remains a difficult task, it is possible to measure their orientation by taking advantage of the optical properties of the heme moiety buried in the active site. The orientation of some CYP isoforms associated with proteoliposomes or microsomes30 has been measured experimentally; however, such experiments have not been reported for CYP3A4. A series of linear dichroism measurements were performed in this study to calculate the orientation of CYP3A4 in POPC Nanodiscs. The Nanodisc approach has been employed to study the metabolic mechanisms of CYP3A4 in a phospholipid bilayer.34 The orientation of the Nanodisc-bound CYP3A4 was calculated by measuring the angle between the heme moiety and the z-axis from the dichroic ratio measured from the sample (see Materials and Methods). A total of 11 independent experiments were carried out. The calculated angles are presented in Table 1. The heme tilt angle of CYP3A4 in the Nanodisc exhibits values between 52.0° and 67.3°, with an average of 59.7°. These measurements suggest that the CYP3A4 bound to the POPC Nanodiscs adopts a specific orientation, rather than a nonspecific adsorption to the membrane surface.
Table 1. Experimental Measurements of Heme Tilt Angle for CYP3A4 Bound to POPC Nanodisc.
| experiment | tilt angle (deg) |
|---|---|
| 1 | 61.1 |
| 2 | 57.5 |
| 3 | 57.5 |
| 4 | 61.1 |
| 5 | 58.8 |
| 6 | 52.0 |
| 7 | 60.0 |
| 8 | 55.9 |
| 9 | 62.9 |
| 10 | 67.3 |
| 11 | 62.9 |
| avg | 59.7 ± 4.1 |
From the simulations, the positioning of the globular domain of CYP3A4 after binding to the membrane was studied more thoroughly by defining a set of angles that characterize the orientation of its membrane-bound form. The orientation of CYP3A4 after association with the membrane was characterized by measuring the heme tilt angle with respect to the membrane normal (z-axis). The time evolution of the heme tilt angle for the five simulated membrane systems (Mem-1 to Mem-5) is presented in Figure 3. The tilt angle converges to a value around 70° in about 10 ns, corresponding to the time of binding of CYP3A4 to the membrane. For the remainder of the simulations, the tilt angle fluctuates between 70° and 80°. In Table 2, the initial and average values of the tilt angle for each simulated system are shown, with the average obtained over the last 40 ns of the simulation, that is, the portion corresponding to the membrane-bound form of the enzyme. The average heme tilt angle is calculated to be between 68.7° and 75.9° for individual simulations, with an overall average of 72.2° over the five simulations. The calculated average angles strongly support the convergence of the simulations; despite using very different initial orientations in solution, the final tilt angles in all the simulations are very similar and deviate by only a few degrees. This suggests that, as observed in the experiments, CYP3A4 adopts a specific orientation upon binding to the membrane, with the heme moiety oriented at approximately 70° with respect to the membrane normal.
Figure 3.
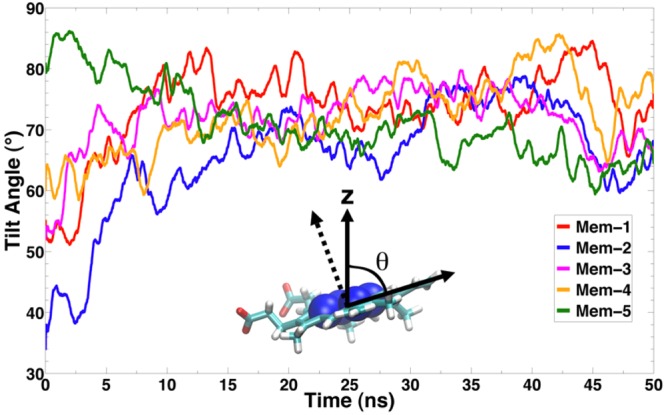
Orientation of CYP3A4 upon binding to the membrane: time series of the heme tilt angle for the five membrane simulations (Mem-1 to Mem-5). The heme plane was defined by fitting the position of the four porphyrin nitrogen atoms to a plane. The angle θ is defined as the angle between the membrane normal (z-axis) and the heme plane.
Table 2. Initial and Average Heme Tilt Angle Calculated for CYP3A4 in Five Independent Membrane-Binding Simulationsa.
| run | initial tilt angle (deg) | avg tilt angle (deg) |
|---|---|---|
| Mem-1 | 55.2 | 75.9 (3.9) |
| Mem-2 | 33.9 | 69.1 (5.3) |
| Mem-3 | 51.9 | 72.9 (3.7) |
| Mem-4 | 59.9 | 74.4 (5.0) |
| Mem-5 | 81.0 | 68.7 (3.7) |
| avg | 72.2 (3.2) |
Averages were calculated from the last 40 ns of each simulation corresponding to the membrane-bound form of CYP3A4. Standard deviations are given in parentheses.
In order to examine the structure and dynamics of the membrane-bound model for CYP3A4 that was developed with the HMMM membrane model, we put the model to a test simulation performed in a full membrane. While we might not expect to capture the complete insertion process using such a full representation for the membrane within our limited simulation time scales (the main reason for using the HMMM model), we have adopted the membrane-bound configuration from an HMMM simulation and performed additional equilibrium simulations (40 ns) after transforming the lipids to full POPC lipid molecules (see Materials and Methods). As depicted in Figure 4, the membrane-bound configuration is highly preserved; both the depth of membrane insertion and the orientation show similar average values and range of fluctuation to those obtained from membrane binding simulations.
Figure 4.
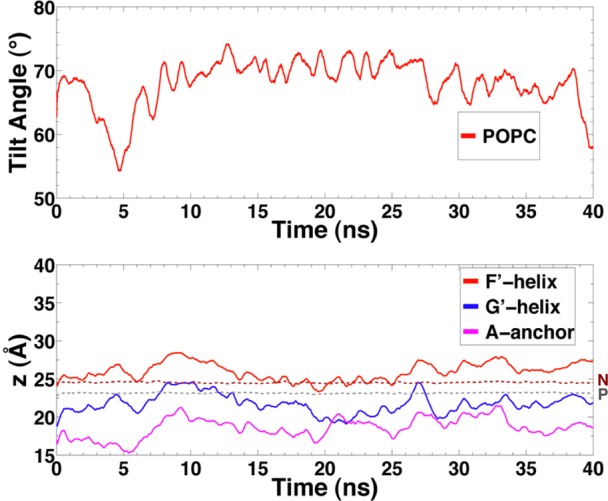
Orientation and depth of insertion of CYP3A4 in a full POPC membrane. (Top) Time evolution of the heme tilt angle and (bottom) average height of the center of mass of A-anchor and helices F′ and G′ are shown for CYP3A4 bound to a full POPC membrane. Average positions of the phosphorus (PO4) group and the nitrogen (choline) atoms of the lipid headgroups are shown as gray and brown dotted lines, respectively.
In order to characterize the orientation of CYP3A4 on the membrane, in addition to the heme tilt angle described above, two additional orthogonal vectors were defined, similar to the approach employed in other studies of CYPs in membranes.29 The time evolution and average values of the angles between these two vectors and the membrane normal (Table S1 and Figure S2, Supporting Information) further confirm the specific orientation of CYP3A4 upon binding to the membrane, which in turn determines the accessibility of the active site.
Since the experiments presented in this work were carried out with a sequence of CYP3A4 that includes a truncated TM helix, two additional simulations including a TM helix were performed, with the models prepared as described under Materials and Methods. The average heme tilt angle of these membrane simulations (Figure 5), 72.6° for WT-TM and 73.4° for truncated-TM, suggests that the orientation angle of CYP3A4 is not significantly affected by the presence of the TM anchor. Whether or not the helix is there, the tilt angle would not drastically change. The observation that the heme tilt angle is largely independent of the presence of the TM helix suggests that the globular domain, not the TM anchor, is the main determinant of the orientation of the membrane-bound enzyme.
Figure 5.
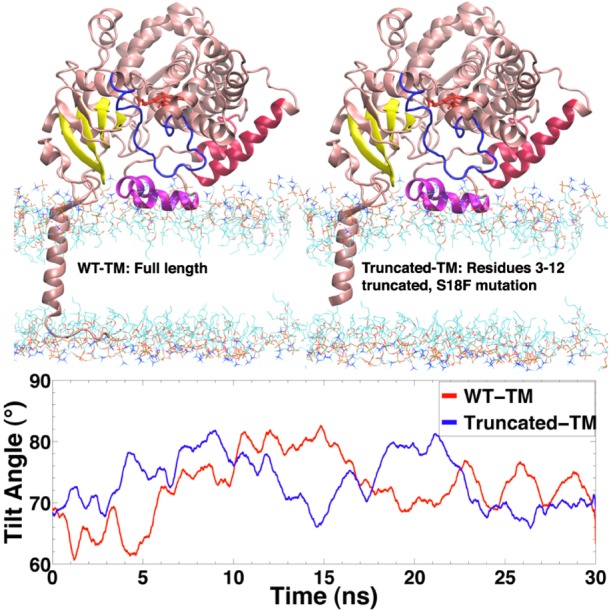
Effect of the transmembrane helix on the orientation of CYP3A4. (Top) Initial configuration of the two simulated systems including a transmembrane helix. (Bottom) Time evolution of the heme tilt angle for the simulations including the transmembrane helix. The average heme tilt angle for the WT-TM system is 72.6° ± 5.1° and for truncated-TM is 73.4° ± 4.2°.
Membrane-Induced Conformational Changes of CYP3A4
Despite the large number of crystallographic structures available for CYP3A4, no structural information for its membrane-bound state at an atomic level is available. This is particularly critical since the structure of CYP3A4 might be affected by the membrane, and the potential membrane-induced conformational changes could have a direct impact on the access of substrates, especially large molecules, to the active site, an aspect that is unclear from the crystal structures. Binding of CYP3A4 to the membrane does not induce any global conformational changes in the enzyme within the simulated time, as measured by the backbone root-mean-square deviation (RMSD) with respect to the X-ray structure, which shows values <2.5 Å (Figure S3, Supporting Information). The RMSD of the membrane-bound CYP3A4 does not deviate significantly from that of the aqueous simulation of CYP3A4 either, suggesting that the overall fold of the enzyme is likely preserved upon binding to the membrane, in agreement with the reported behavior of the CYP2C9 isoform when bound to a conventional membrane in a previous MD study.28,29 However, significant local conformational changes at the membrane interface accompany the process of membrane binding of the enzyme. These conformational changes, which are mostly localized to the membrane–protein interface, likely arise due to close interaction of specific residues and/or regions of CYP3A4 with lipid molecules in the membrane, in particular helices F′ and G′ and A-anchor (Figure S1, Supporting Information). Such specific lipid–protein interactions might disrupt interactions with residues located in other regions of the enzyme, for example, interactions with residues of the BC loop, which is in close proximity to helix G′, or interactions between the β1 sheet and helix F′. While the globally low RMSD appears to suggest that CYP3A4 remains in a nearly closed conformation in its membrane-bound form, side-chain fluctuations due to interaction with the lipids directly affect the opening and closing of access tunnels leading to the active site of the enzyme.
Membrane-Induced Modulation of Access Tunnels
For other human CYP isoforms, it has been suggested that access of lipophilic substrates to the active site is primarily through the membrane, while egress of products occurs through solvent-accessible tunnels.4,24,52 In our simulations, the interaction of CYP3A4 with the membrane induces local changes that promote the opening of access tunnels leading to the active site of the enzyme (Figure 6). These tunnels correspond to the 2a, 2b, 2e, 3, and solvent (S) tunnels, named after their lining secondary structures according to the nomenclature established in ref (2). The tunnels were observed to start to open to different degrees during the membrane binding simulations. Interestingly, tunnels 2a and 3 are delimited by regions of CYP3A4 that are in close contact with the membrane (Table S2, Supporting Information); for example, tunnel 2a is located between β1 sheet and the F–F′ loop, close to A-anchor, and tunnel 3 is located within the F-G loop, surrounded by helices F′ and G′.
Figure 6.

Membrane-induced rearrangement of the access tunnels. (Top) Access tunnels that were observed to be opening during simulations. Two views, rotated by 120°, are presented, showing the side (left) and bottom (right) of the protein and the location of the access tunnels leading to the active site. (Middle) Percentage of frames from the membrane binding (Mem-1 to Mem-5) and solution trajectories in which the access tunnels to the active site were opening. (Bottom) Time evolution of the smallest (bottleneck) radius along each access tunnel during the simulations. A tunnel is considered to be opening when its bottleneck radius is ≥1.2 Å.
The identified access tunnels open to varying degrees in each simulation (Figure 6). The data were collected from the last 40 ns of each simulation (i.e., for membrane-bound CYP3A4). Tunnels 2b and 2e are predominantly more open than other tunnels during the simulations. Furthermore, the solution simulation of CYP3A4 reveals that these tunnels are open to a lesser extent in the absence of the membrane. The interaction of CYP3A4 with the membrane not only promotes the opening of those tunnels already identified from the crystal structures15,16 but also induces the opening of additional tunnels. It should be noted that these opening events are not observed in the solution simulation of the enzyme. We also note that although these openings are significant, we do not believe that we have been able to capture the complete process and the ultimate “open” configuration of the tunnels, since they are still too small for accommodating such large substrates as those metabolized by CYP3A4. Although the HMMM model allows for increased lateral diffusion of the lipids in our simulations, the internal degrees of freedom of the protein governing the opening of the access tunnels still follow the unaccelerated and therefore slow protein dynamics. Therefore, it is highly likely that we have not been able to capture the full opening of the access tunnels and the formation of their fully open states.
The opening of the tunnels facing the membrane is of particular importance in the recruitment of lipophilic substrates directly from the membrane into the active site.24,28,29 In our simulations, access tunnels 2a, 3, and S are observed to open to varying degrees and are found to be facing the lipid layer in the membrane-bound form of CYP3A4. The lipophilic substrate transport hypothesis is particularly relevant for tunnel 3, since it is formed only after membrane binding of the enzyme, with opening observed in at least 20% of the snapshots in systems Mem-2 and Mem-3. In the membrane binding simulations, tunnels 2b and 2e open after binding to the membrane, and they remain open for most of the simulation time (Figure 6), whereas in the aqueous simulation these tunnels start to open only sporadically. Access tunnel 3 opens after binding to the membrane in systems Mem-2 and Mem-3, where the opening occurs approximately at t = 25 and 40 ns, respectively (Figure 6). The opening of tunnel 3 is related to the motion of the side chain of Phe-219 located in helix F′, favoring the opening of this tunnel when pointing toward the membrane. The entrance of this tunnel is defined by residues Phe-213 and Phe-220, which together with Phe-108, Phe-219, Phe-241, and Phe-304 form a Phe cluster in the absence of the membrane (Figure 7), a distinctive region of CYP3A4 that has been suggested to serve as a substrate recognition mechanism15,53 and that has been observed to serve as a peripheral binding site for progesterone, through residues Phe-219 and Phe-220.15 Access tunnel S is observed to open to various degrees after membrane binding, except for system Mem-5 (Figure 6). The opening of this tunnel seems to be coupled to the motion of Arg-212, a residue that has been recently reported to assist the binding of ligands to the active site.18,19 It has been suggested that tunnel S might function as a ligand egress path in other CYPs4,52 as well as in CYP3A4 in water.24 Available crystal structures indicate that in order to accommodate large compounds in the active site of CYP3A4, such as ritonavir,18 two ketoconazole molecules, or erythromycin,12 rearrangement of the F-G region, in particular between helices F and F′, is necessary, suggesting that this is a very flexible region (Figure S4, Supporting Information). Although we do not observe a dramatic backbone motion in this region in our simulations (Figure S5, Supporting Information), the side-chain motion of the residues located in this region, including the Phe cluster, is promoted in the presence of the membrane.
Figure 7.
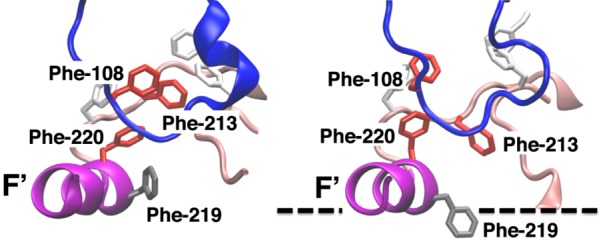
Membrane-induced rearrangement of the Phe cluster of CYP3A4: side view of the Phe cluster of CYP3A4 in the crystal structure (left) and in the membrane-bound form (system Mem-2) (right). The dashed line represents the approximate location of the membrane surface. The side chains of Phe-108, Phe-213, and Phe-220, involved in tunnel gating, are shown in red stick representation. The side chain of Phe-219 is shown in gray stick representation. During the process of membrane binding, the side chain of Phe-219 is observed to change its orientation toward the membrane, and the Phe cluster starts to break.
The radius of the observed access tunnels is small for the average size of the substrates of the enzyme, indicating that further changes are needed in order for the substrates to be able to gain access to the active site. The interaction with the membrane might represent only the first step in formation of substrate access pathways to the active site. Although the binding of small ligands to the active site does not require major conformational changes over the enzyme,15,18 it has been observed that the binding of larger compounds accompanies a significant effect in the conformation of the F-G region of CYP3A4,12,17,19 including helices F′ and G′ that are in direct contact with the membrane in membrane-bound CYP3A4. These conformational changes induced by the ligand, together with the interaction between the enzyme and the lipids observed in our simulations, suggest that the size of the tunnels leading to the active site could further increase to allow a lipophilic substrate into the active site.
Conclusion
CYP3A4, a membrane-associated isoform of the cytochrome P450 family, is the most common metabolizing enzyme in the human body for biotransformation of a large number of pharmaceutical compounds and toxic xenobiotics and a major site for biosynthesis of various endogenous compounds. Given the fact that a large fraction of compounds metabolized by the enzyme primarily partition in the membrane, characterizing the membrane-bound form of the enzyme is key to our understanding of its mechanism and spectrum, yet this has proven an extremely challenging task given the difficulties associated with high-resolution structural determination of the membrane-associated state of peripheral membrane proteins. In the present study, employing a concerted experimental and simulation approach, we have developed a structural model for the membrane-bound state of CYP3A4. Spontaneous membrane binding and insertion of the globular domain of CYP3A4, independent of the transmembrane helix of the protein, have been successfully captured in multiple independent, unbiased simulations by taking advantage of a novel membrane representation (HMMM) with enhanced lipid diffusion that allows for more efficient description and sampling of membrane-associated phenomena without compromising atomic details.
The simulations resulted in a convergent model for the membrane-bound state of CYP3A4, characterized by the depth of insertion and orientation of the globular domain on the surface of the membrane. These results indicate that CYP3A4 does not interact with the membrane merely through nonspecific contacts and adsorption to the surface but rather through specific lipid–protein interactions that closely control the pose of the protein on the surface of the membrane. The protein is anchored into the membrane primarily through a hydrophobic anchor located between helices A″ and A, which inserts deeply into the membrane, and helix G′, which partitions mainly within the headgroup region. In parallel to the simulations, experimental linear dichroism measurements of CYP3A4 bound to POPC Nanodiscs have been used to determine the orientation of the globular domain of CYP3A4 with regard to the membrane. These measurements also demonstrate a specific orientation of the globular domain of the enzyme in its membrane-bound form, as opposed to nonspecific adhesion to the lipid bilayer. Remarkably, the heme tilt angles obtained from the simulations and the experiments are in close agreement, which further verifies the validity of the structural model resulting from the simulations. Moreover, the resulting model was further tested by use of simulations performed in a full membrane environment, during which the insertion depth and orientation of the protein on the membrane were largely preserved.
We show that membrane binding of CYP3A4 has significant structural and dynamical impacts on its globular domain at the membrane interface. The presence of the membrane induces local side-chain fluctuations that initiates the opening of access tunnels to the active site that are not observed in the crystal structures or in solution simulations, suggesting that binding to the membrane might play a role in efficient recruitment of lipophilic ligands from the membrane to the active site. In particular, rearrangement of a Phe cluster induced by the membrane is found to be among the structural changes that are directly coupled to modulation of the access tunnels leading to the active site. These attributes are of direct relevance to the mechanism and pathway for recruitment and binding of amphiphilic substrates, including both endogenous and drug molecules, directly from the membrane into the active site of the enzyme.
Acknowledgments
This research was supported by National Institutes of Health Grants R01-GM101048, R01-GM086749, R01-GM33775, U54-GM087519, and P41-GM104601. Simulations in this study have been performed with supercomputing resources at National Science Foundation Supercomputing Centers (XSEDE Grant MCA06N060).
Supporting Information Available
Five figures, two tables, and a detailed description of derivation of the dichroic ratio. This material is available free of charge via the Internet at http://pubs.acs.org/.
The authors declare no competing financial interest.
Funding Statement
National Institutes of Health, United States
Supplementary Material
References
- Denisov I. G.; Makris T. M.; Sligar S. G.; Schlichting I. Chem. Rev. 2005, 105, 2253–2277. [DOI] [PubMed] [Google Scholar]
- Cojocaru V.; Winn P. J.; Wade R. C. Biochim. Biophys. Acta 2007, 1770, 390–401. [DOI] [PubMed] [Google Scholar]
- Williams P. A.; Cosme J.; Ward A.; Angove H. C.; Matak Vinković D.; Jhoti H. Nature 2003, 424, 464–468. [DOI] [PubMed] [Google Scholar]
- Schleinkofer K.; Sudarko; Winn P. J.; Lüdemann S. K.; Wade R. C. EMBO Rep. 2005, 6, 584–589. [DOI] [PMC free article] [PubMed] [Google Scholar]
- Sakaguchi M.; Mihara K.; Sato R. EMBO J. 1987, 6, 2425–2431. [DOI] [PMC free article] [PubMed] [Google Scholar]
- Black S. D. FASEB J. 1992, 6, 680–685. [DOI] [PubMed] [Google Scholar]
- Williams P. A.; Cosme J.; Sridhar V.; Johnson E. F.; McRee D. E. Mol. Cell 2000, 5, 121–131. [DOI] [PubMed] [Google Scholar]
- Scott E. E.; He Y. Q.; Halpert J. R. Chem. Res. Toxicol. 2002, 15, 1407–1413. [DOI] [PubMed] [Google Scholar]
- Guengerich P. F. Chem. Res. Toxicol. 2008, 21, 70–83. [DOI] [PubMed] [Google Scholar]
- Guengerich P. F. Annu. Rev. Pharmacol. Toxicol. 1999, 39, 1–17. [DOI] [PubMed] [Google Scholar]
- Wrighton S. A.; Schuetz E. G.; Thummel K. E.; Shen D. D.; Korzekwa K. R.; Watkins P. B. Drug Metab. Rev. 2000, 32, 339–361. [DOI] [PubMed] [Google Scholar]
- Ekroos M.; Sjögren T. Proc. Natl. Acad. Sci. U.S.A. 2006, 103, 13682–13687. [DOI] [PMC free article] [PubMed] [Google Scholar]
- Sevrioukova I. F.; Poulos T. L. Dalton Trans. 2012, 42, 3116–3126. [DOI] [PMC free article] [PubMed] [Google Scholar]
- Rendic S. Drug Metab. Rev. 2002, 34, 83–448. [DOI] [PubMed] [Google Scholar]
- Williams P. A.; Cosme J.; Vinkovic D. M.; Ward A.; Angove H. C.; Day P. J.; Vonrhein C.; Tickle I. J.; Jhoti H. Science 2004, 305, 683–686. [DOI] [PubMed] [Google Scholar]
- Yano J. K.; Wester M. R.; Schoch G. A.; Griffin K. J.; Stout C. D.; Johnson E. F. J. Biol. Chem. 2004, 279, 38091–38094. [DOI] [PubMed] [Google Scholar]
- Sevrioukova I. F.; Poulos T. L. Proc. Natl. Acad. Sci. U.S.A. 2010, 107. [DOI] [PMC free article] [PubMed] [Google Scholar]
- Sevrioukova I. F.; Poulos T. L. J. Biol. Chem. 2012, 287, 3510–3517. [DOI] [PMC free article] [PubMed] [Google Scholar]
- Sevrioukova I. F.; Poulos T. L. Arch. Biochem. Biophys. 2012, 520, 108–116. [DOI] [PMC free article] [PubMed] [Google Scholar]
- Harlow G. R.; Halpert J. R. Proc. Natl. Acad. Sci. U.S.A. 1998, 95, 6636–6641. [DOI] [PMC free article] [PubMed] [Google Scholar]
- Kenworthy K. E.; Clarke S. E.; Andrews J.; Houston J. B. Drug Metab. Dispos. 2001, 29, 1644–1651. [PubMed] [Google Scholar]
- Atkins W. M. Annu. Rev. Pharmacol. Toxicol. 2005, 45, 291–310. [DOI] [PubMed] [Google Scholar]
- Li W.; Liu H.; Luo X.; Zhu W.; Tang Y.; Halpert J. R.; Jiang H. Drug Metab. Dispos. 2007, 35, 689–696. [DOI] [PubMed] [Google Scholar]
- Fishelovitch D.; Shaik S.; Wolfson H. J.; Nussinov R. J. Phys. Chem. B 2009, 113, 13018–13025. [DOI] [PMC free article] [PubMed] [Google Scholar]
- Bren U.; Oostenbrink C. J. Chem. Inf. Model. 2012, 52, 1573–1582. [DOI] [PubMed] [Google Scholar]
- Rydberg P.; Rod T. H.; Olsen L.; Ryde U. J. Phys. Chem. B 2007, 111, 5445–5457. [DOI] [PubMed] [Google Scholar]
- Denisov I. G.; Shih A. Y.; Sligar S. G. J. Inorg. Biochem. 2012, 108, 150–158. [DOI] [PMC free article] [PubMed] [Google Scholar]
- Berka K.; Hendrychová T.; Anzenbacher P.; Otyepka M. J. Phys. Chem. A 2011, 115, 11248–11255. [DOI] [PMC free article] [PubMed] [Google Scholar]
- Cojocaru V.; Balali-Mood K.; Sansom M. S. P.; Wade R. C. PLoS Comput. Biol. 2011, 7, e1002152. [DOI] [PMC free article] [PubMed] [Google Scholar]
- Ohta Y.; Kawato S.; Tagashira H.; Takemori S.; Kominami S. Biochemistry 1992, 31, 12680–12687. [DOI] [PubMed] [Google Scholar]
- Bridges A.; Gruenke L.; Chang Y.-T.; Vakser I. A.; Loew G.; Waskell L. J. Biol. Chem. 1998, 273, 17036–17049. [DOI] [PubMed] [Google Scholar]
- Ohkubo Y. Z.; Pogorelov T. V.; Arcario M. J.; Christensen G. A.; Tajkhorshid E. Biophys. J. 2012, 102, 2130–2139. [DOI] [PMC free article] [PubMed] [Google Scholar]
- Arcario M. J.; Ohkubo Y. Z.; Tajkhorshid E. J. Phys. Chem. B 2011, 115, 7029–7037. [DOI] [PMC free article] [PubMed] [Google Scholar]
- Denisov I. G.; Baas B. J.; Grinkova Y. V.; Sligar S. G. J. Biol. Chem. 2007, 282, 7066–7076. [DOI] [PubMed] [Google Scholar]
- Martínez L.; Andrade R.; Birgin E. G.; Martínez J. M. J. Comput. Chem. 2009, 30, 2157–2164. [DOI] [PubMed] [Google Scholar]
- Humphrey W.; Dalke A.; Schulten K. J. Mol. Graphics 1996, 14, 33–38. [DOI] [PubMed] [Google Scholar]
- Kuc̆erka N.; Tristram-Nagle S.; Nagle J. F. J. Membr. Biol. 2005, 208, 193–202. [DOI] [PubMed] [Google Scholar]
- The RCSB Protein Data Bank. http://www.rcsb.org/pdb.
- Sali A.; Blundell T. L. J. Mol. Biol. 1993, 234, 779. [DOI] [PubMed] [Google Scholar]
- Phillips J. C.; Braun R.; Wang W.; Gumbart J.; Tajkhorshid E.; Villa E.; Chipot C.; Skeel R. D.; Kale L.; Schulten K. J. Comput. Chem. 2005, 26, 1781–1802. [DOI] [PMC free article] [PubMed] [Google Scholar]
- MacKerell A. D. Jr.; Feig M.; Brooks C. L. III. J. Comput. Chem. 2004, 25, 1400–1415. [DOI] [PubMed] [Google Scholar]
- Vanommeslaeghe K.; Hatcher E.; Acharya C.; Kundu S.; Zhong S.; Shim J.; Darian E.; Guvench O.; Lopes P.; Vorobyov I.; MacKerell A. D. Jr. J. Comput. Chem. 2010, 31, 671–690. [DOI] [PMC free article] [PubMed] [Google Scholar]
- Jorgensen W. L.; Chandrasekhar J.; Madura J. D.; Impey R. W.; Klein M. L. J. Chem. Phys. 1983, 79, 926–935. [Google Scholar]
- Feller S. E.; Zhang Y.; Pastor R. W. J. Chem. Phys. 1995, 103, 4613–4621. [Google Scholar]
- Martyna G. J.; Tobias D. J.; Klein M. L. J. Chem. Phys. 1994, 101, 4177–4189. [Google Scholar]
- Darden T.; York D.; Pedersen L. G. J. Chem. Phys. 1993, 98, 10089–10092. [Google Scholar]
- Yaffe E.; Fishelovitch D.; Wolfson H. J.; Halperin D.; Nussinov R. Proteins: Struct., Funct., Bioinf. 2008, 73, 72–86. [DOI] [PMC free article] [PubMed] [Google Scholar]
- Coronado R. Biophys. J. 1985, 47, 851–857. [DOI] [PMC free article] [PubMed] [Google Scholar]
- Cropek D. M.; Bohn P. W. J. Phys. Chem. 1990, 94, 6452–6457. [Google Scholar]
- Eaton W. A.; Hofrichter J. Methods Enzymol. 1981, 76, 175–261. [DOI] [PubMed] [Google Scholar]
- Norden B. Appl. Spectrosc. Rev. 1978, 14, 157–248. [Google Scholar]
- Li W.; Shen J.; Liu G.; Tang Y.; Hoshino T. Proteins: Struct., Funct., Bioinf. 2011, 79, 271–81. [DOI] [PubMed] [Google Scholar]
- Davydov D. R.; Rumfeldt J. A. O.; Sineva E. V.; Fernando H.; Davydova N. Y.; Halpert J. R. J. Biol. Chem. 2012, 287, 6797–6809. [DOI] [PMC free article] [PubMed] [Google Scholar]
- Poulos T. L.; Finzel B. C.; Howard A. J. J. Mol. Biol. 1987, 195, 687–700. [DOI] [PubMed] [Google Scholar]
Associated Data
This section collects any data citations, data availability statements, or supplementary materials included in this article.