Abstract
Objective
There is growing evidence for a link between energy and bone metabolism. The nuclear receptor subfamily 5 member A2 (NR5A2) is involved in lipid metabolism and modulates the expression of estrogen-related genes in some tissues. The objective of this study was to explore the influence of NR5A2 on bone cells and to determine whether its allelic variations are associated with bone mineral density (BMD).
Design
Analyses of gene expression by quantitative PCR and inhibition of NR5A2 expression by siRNAs were used to explore the effects of NR5A2 in osteoblasts. Femoral neck BMD and 30 single nucleotide polymorphisms (SNPs) were first analyzed in 935 postmenopausal women and the association of NR5A2 genetic variants with BMD was explored in other 1284 women in replication cohorts.
Results
NR5A2 was highly expressed in bone. The inhibition of NR5A2 confirmed that it modulates the expression of osteocalcin, osteoprotegerin, and podoplanin in osteoblasts. Two SNPs were associated with BMD in the Spanish discovery cohort (rs6663479, P=0.0014, and rs2816948, P=0.0012). A similar trend was observed in another Spanish cohort, with statistically significant differences across genotypes in the combined analysis (P=0.03). However, the association in a cohort from the United States was rather weak. Electrophoretic mobility assays and studies with luciferase reporter vectors confirmed the existence of differences in the binding of nuclear proteins and the transcriptional activity of rs2816948 alleles.
Conclusions
NR5A2 modulates gene expression in osteoblasts and some allelic variants are associated with bone mass in Spanish postmenopausal women.
Introduction
Epidemiological and experimental studies suggest a link between energy metabolism and bone metabolism (1–3), which may also share genetic influences. For instance, Zhao et al. (4) recently reported that polymorphisms at the osterix locus, a critical gene for osteoblast development, are associated with childhood adiposity. The nuclear receptor subfamily 5 member A2 (NR5A2) is highly expressed in the liver and gastrointestinal tract and is involved in the regulation of lipid metabolism (5). Moreover, it modulates the expression of genes coding for aromatase and other enzymes participating in estrogen metabolism (6–8). Therefore, we hypothesized that NR5A2 might play a role in skeletal homeostasis. The aims of this study were to explore the influence of NR5A2 on bone cells and to analyze whether the allelic variations in the NR5A2 gene are associated with bone mineral density (BMD).
Materials and methods
Analysis of gene expression in bone
Trabecular bone samples were obtained from the femoral heads of patients undergoing hip arthroplasty for osteoarthritis (age 76±6 years, n=10) or fractures (age 77±4 years, n=9), after obtaining informed written informed consent. They had no other disorders affecting bone metabolism revealed by clinical examination and routine blood tests. The osteoblastic cell line HOS-TE85 was obtained from EACC and maintained in Minimum Essential Medium supplemented with antibiotics and 10% fetal bovine serum. RNA was isolated from the bone pieces or confluent cell cultures and reverse transcribed with Superscript III reverse transcriptase (Invitrogen- Life Technologies). Gene expression was analyzed by quantitative real-time PCR using specific primers and Taqman probes (Applied Biosystems, Foster City, CA, USA). The results were normalized by the expression of the constitutive gene TATA box-binding protein (TBP). For comparison purposes, NR5A2 expression was also measured in a human reference RNA mixture derived from ten different cell lines (Stratagene, La Jolla, CA, USA).
NR5A2 inhibition
To explore the influence of NR5A2 on the transcription of other genes, we generated HOS-TE85 clones with stable inhibition of NR5A2. Two different commercial plasmids coding for shRNAS already validated for the specific inhibition of human NR5A2 gene expression (TRCN0000019654 and TRCN0000019656) were purchased from Sigma–Aldrich. The viral particles were prepared according to the manufacturer’s protocol. The amount of viruses necessary for obtaining a 50% infection of HOS-TE85 cultures was determined by using GFP-encoding viruses. A similar amount of NR5A2 shRNA viruses was used for infecting HOS-TE85 cultures grown to 50% confluence. Puromycin (1.5 μg/ml) was added to the cultures 48 h after infection and ten resistant clones were selected after several medium changes and were used in subsequent experiments. The studies of the effect of NR5A2 inhibition on the expression of other osteoblastic genes were done with two of them, resulting from the infection with virus prepared from TRCN0000019656. They were cultured in the presence or absence of 1,25-dihydroxyvitamin D3 (10−8 M), a well-known stimulus for the osteocalcin gene. HOS-TE85 clones infected with virus preparations derived from plasmid pLKO.1-TRC control (Sigma) were used as a negative control. Gene expression was analyzed using specific primers and Taqman probes (Applied Biosystems). The results were normalized by the expression of the constitutive gene TBP. Experiments were repeated three times.
Electrophoretic shift and reporter vector assays
Nuclear extracts were prepared from subconfluent HepG2 cell cultures. Binding reactions and electrophoresis mobility shift assays (EMSA) were performed as described previously (9), using two 20 nt-long, 5′-fluorescein-labeled, double-stranded oligonucleotides including either C or G alleles of the rs2816948 polymorphism and the surrounding region. Gel analysis was carried out in an FLA-5100 fluorescent image analyzing system (FujiFilm). Competition studies were carried out with an unlabeled C allele-specific oligo-nucleotide. The specificity of the retarded band was tested by adding a 50-fold excess of an unrelated oligonucleotide to the reaction mix.
For the construction of luciferase reporter plasmids, a 248 bp fragment of the NR5A2 gene promoter extending from position −212 to position +36 was amplified by PCR using primers modified to contain KpnI and XhoI sites and cloned in pGEMT-easy vector (Promega), subcloned into the promoterless pGL3- basic vector (Promega) and then used in subsequent transient transfection assays of HepG2 cultures. The procedures for transfection and measurement of luciferase activity have been described previously (10).
Genetic association study
Discovery cohort
We selected 935 Caucasian post-menopausal women over 50 years of age (range 50–88, mean 66) living in Cantabria, a region in Northern Spain. They included volunteers recruited by advertisements, taking part in a population study on the epidemiology of osteoporosis, and women sent to our clinic because of osteoporosis concerns. Participants gave informed consent and the study was approved by the Clinical Research Ethics Committee of the Hospital U.M. Valdecilla. Women with diseases that might potentially affect bone metabolism were excluded. These diseases/conditions included chronic disorders involving vital organs (e.g. heart, lung, liver, and kidney), serious metabolic diseases (e.g. hypo- and hyper-parathyroidism, hyperthyroidism, etc.), skeletal diseases other than primary osteoporosis (e.g. Paget disease, osteogenesis imperfecta, rheumatoid arthritis, etc.), and use of drugs affecting bone metabolism (e.g. hormone replacement therapy, corticosteroids, anticonvulsant drugs, and anti-resorptive drugs). In addition, women with non-Spanish ancestors were excluded (11). BMD was measured with a Hologic densitometer. Results at the femoral neck are reported, which had a coefficient of variation of 1.4% in normal subjects after repositioning.
Tagging single nucleotide polymorphisms (SNPs) covering the common variations of the NR5A2 gene, as well as the 16 kb upstream and downstream regions, and with a minor allele frequency >5% were selected with Tagger Software http://www.broadinstitute.org/mpg/tagger. SNPs with a potential regulatory role suggested by bioinformatic analyses (Math Inspector http://www.genomatix.de and, Mapper http://www.mapper.chip.org) were also included. DNA was isolated from peripheral blood and a 30 SNP set was analyzed by iPlex technology on a Mass-Array platform (Sequenom, Hamburg, Germany) or by using Taqman assays. Reproducibility was confirmed by obtaining consistent genotypes in 30 replicate samples.
Replication cohorts
The Valencia cohort included 324 Caucasian postmenopausal women aged 41–69 years (mean 52) attending a menopause clinic and living in Valencia, a region in eastern Spain. BMD was measured using either a Lunar or a Norland densitometer. The results obtained from different densitometers were standardized as proposed by Lu et al. (12).
The Kansas City cohort included 930 unrelated Caucasian postmenopausal women aged 45–87 years (mean 65), recruited from Midwestern U.S. (mainly in Kansas City and vicinity areas) (13). BMD was measured at the femoral neck using a Hologic densitometer. Alleles of 50 polymorphisms of the NR5A2 region were extracted from a Genomewide Association Study (GWAS) with the Affymetrix Human SNP Assay 6.0 to carry out an in silico replication.
Exclusion criteria in the Kansas City and Valencia cohorts were similar to those in the discovery cohort. Studies were approved by the Institutional Review Committees. Informed consent was obtained from the participants.
Statistical analyses
The Hardy–Weinberg equilibrium (HWE) and the association of alleles with BMD were studied at the single-locus level and adjusted by age and weight as covariates using Plink (14) and SPSS Software (SPSS, Chicago, IL, USA). Haplotypic blocks were built by the method of Gabriel, implemented in Haploview (15). The association between haplotypes and BMD was explored by testing 2-SNP haplotypes using the sliding window procedure, as well as haplotypes including SNPs that were part of a single haplotypic block. Multiple test correction was performed with the software developed by Nyholt (16). Power analysis was done using Quanto Software (available at http://hydra.usc.edu/gxe/). We estimated a 86% power to detect a polymorphism explaining at least 1% of the BMD variance under an additive model (approximately equivalent to a 0.25 S.D. difference between opposite homozygotes) in the discovery cohort.
Results
NR5A2 is expressed in bone and modulates gene expression in osteoblasts
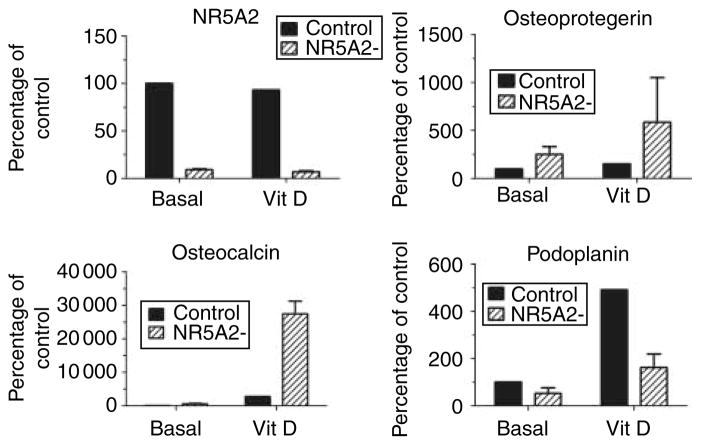
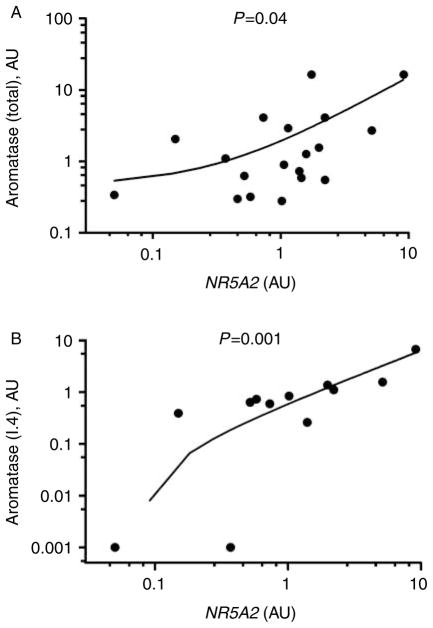
Abundant NR5A2 transcripts (up to 1000-fold in comparison with the reference RNA) were detected in all bone samples. They tended to be slightly more abundant in fracture samples than in controls, but the difference was not statistically significant (P=0.2, not shown). In order to investigate the potential effects of NR5A2 in osteoblasts, we generated HOS-TE85 clones with stable inhibition of NR5A2 expression, down to 9±2% of the controls. NR5A2 inhibition resulted in a marked increase in osteoprotegerin and osteocalcin expression, up to tenfold, both in basal cultures and in 1,25-dihydroxyvitamin D3 cultures (Fig. 1). On the other hand, the expression of podoplanin was markedly inhibited (Fig. 1) and there were inconsistent effects on other genes, such as alkaline phosphatase, estrogen receptors, LRP5, LRP6, and FRZB. The baseline expression of aromatase in HOS-TE85 cells was low and tended to decrease slightly with NR5A2 inhibition. On the contrary, aromatase expression was increased by NR5A2 inhibition in 1,25-dihydroxyvitamin D3-stimulated cultures (not shown). The gene encoding aromatase has several alternative promoters and first exons. In bone tissue samples, NR5A2 expression was correlated with total aromatase transcripts and with I.4-containing transcripts, which is the major form of first exon found in bone (Fig. 2).
Figure 1.
Gene expression in unstimulated and 1,25-dihydroxyvitamin D3-stimulated HOS-TE85 osteoblastic cells. The results represent the mean and S.D. of gene expression in two clones with stable inhibition of NR5A2, shown as the percentage of gene expression in unstimulated control cells. Similar results were obtained in three independent experiments.
Figure 2.
Relationship between NR5A2 and aromatase expression in bone samples (A, total aromatase; B, I.4-transcripts). Arbitrary units after normalization by TBP expression.
Association of NR5A2 polymorphisms with bone mass
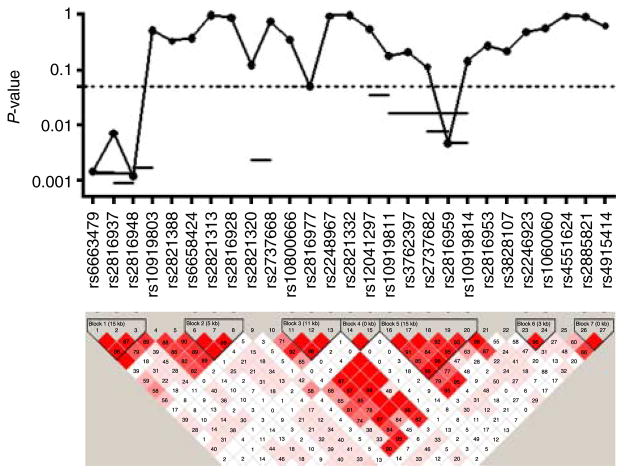
Three out of the 30 SNPs did not follow HWE. The remaining 27 SNPs were included in the analysis (Table 1). The average genotyping rate was 97.9%. Polymorphisms were grouped into seven haplotypic blocks. Five SNPs were associated with femoral neck BMD at the nominal P value of 0.05 (Fig. 3). The strongest association was found with three SNPs within the first haplotypic block, at positions 198247395–198295054. Two of them were associated with BMD with P values below the multiple-test corrected threshold of 0.0026: rs6663479 (P=0.0014) and rs2816948 (P=0.0012). The haplotypic analysis confirmed the results of the single-locus analysis. SNP pairs showing a significant association with BMD are depicted in Fig. 3. Likewise, haplotypes including the three SNPs in block 1 or the five SNPs in block 5 were also associated with BMD (P=0.0013 and 0.0160 respectively). Similar results were found after age and weight adjustment (not shown).
Table 1.
Single nucleotide polymorphisms (SNPs) studied in the discovery cohort.
| SNP | Chromosome position (HG18) | Gene region | Allele 1 | Allele 2 | Minor allele frequency | P (HWE) |
|---|---|---|---|---|---|---|
| rs6663479 | 198247395 | 5′ | C | T | 0.103 | 0.630 |
| rs2816937 | 198249733 | 5′ | C | G | 0.157 | 0.116 |
| rs2816948 | 198263308 | 5′ | G | C | 0.143 | 0.905 |
| rs10919803 | 198295054 | Intron | T | C | 0.119 | 0.671 |
| rs2821388 | 198300392 | Intron | G | A | 0.297 | 0.177 |
| rs6658424 | 198315925 | Intron | A | T | 0.347 | 0.169 |
| rs2821313 | 198317896 | Intron | A | G | 0.482 | 0.553 |
| rs2816928 | 198321700 | Intron | G | T | 0.497 | 0.354 |
| rs2821320 | 198331838 | Intron | T | C | 0.297 | 0.213 |
| rs2737668 | 198332240 | Intron | G | A | 0.430 | 0.333 |
| rs10800666 | 198340353 | Intron | C | A | 0.484 | 0.153 |
| rs2816977 | 198346209 | Intron | T | C | 0.101 | 0.098 |
| rs2248967 | 198351516 | Intron | A | G | 0.412 | 0.221 |
| rs2821332 | 198352337 | Intron | A | T | 0.414 | 0.315 |
| rs12041297 | 198353047 | Intron | C | A | 0.160 | 0.640 |
| rs10919811 | 198356291 | Intron | C | A | 0.468 | 0.084 |
| rs3762397 | 198356842 | Intron | A | G | 0.462 | 0.056 |
| rs2737682 | 198358975 | Intron | A | G | 0.110 | 0.127 |
| rs2816959 | 198368104 | Intron | C | T | 0.165 | 0.284 |
| rs10919814 | 198371595 | Intron | C | A | 0.295 | 0.154 |
| rs2816953 | 198374173 | Intron | T | C | 0.370 | 0.610 |
| rs3828107 | 198387650 | Intron | C | T | 0.033 | 0.112 |
| rs12078096 | 198396692 | Intron | C | A | 0.015 | 0.001 |
| rs16846169 | 198401961 | Intron | C | T | 0.061 | <0.0001 |
| rs2246923 | 198405973 | Intron | T | C | 0.320 | 0.633 |
| rs2737631 | 198408800 | Intron | A | G | 0.320 | <0.0001 |
| rs1060060 | 198409904 | Exon | A | G | 0.255 | 0.756 |
| rs4551624 | 198418447 | 3′ | C | T | 0.362 | 0.563 |
| rs2885821 | 198429406 | 3′ | A | G | 0.126 | 0.421 |
| rs4915414 | 198429626 | 3′ | A | G | 0.194 | 0.635 |
Figure 3.
Association of NR5A2 polymorphisms with femoral neck BMD in the Cantabria cohort. P values for the single-locus and haplotypic analyses (only significant haplotypes are shown). The haplotypic structure of the NR5A2 gene is also shown. Full colour version of this figure available via http://dx.doi.org/10.1530/EJE-11-0571.
Three SNPs with the most significant P values (rs6663479, rs2816937, and rs2816948) were genotyped in a different cohort of postmenopausal women from Valencia (Eastern Spain). There was a trend for similar BMD differences across rs6663479 and rs2816948 genotypes. The latter are shown in Table 2.
Table 2.
Standardized femoral neck BMD (g/cm2), according to rs2816948 genotypes in Spanish cohorts. Mean±S.D. (n).
| GG | GC | CC | P value | |
|---|---|---|---|---|
| Cantabria | 0.829±0.101 (21) | 0.804±0.129 (228) | 0.777±0.123 (657) | 0.0012 |
| Valencia | 0.833±0.216 (6) | 0.792±0.110 (66) | 0.806±0.114 (252) | NS |
| Global | 0.830±0.130 (27) | 0.801±0.125 (294) | 0.785±0.121 (909) | 0.03 |
The NR5A2 rs2816948 polymorphism was not included in the Affymetrix Human SNP Assay 6.0 used to genotype Kansas City cohort. In this cohort, we found one SNP, rs2821320, located at position chromosome 1: 198331838 (build 36), marginally associated with femoral neck BMD (P=0.04; Fig. 4).
Figure 4.
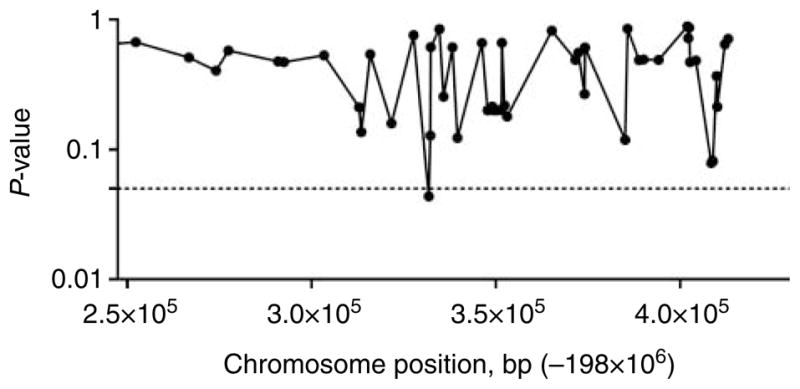
Association of NR5A2 polymorphisms with femoral neck BMD in postmenopausal women of the Kansas City cohort. The chromosome position of the SNPs included in the array is shown in the horizontal axis (from 198247394 through 198429625, which is the region explored in the discovery cohort with the SNPs included in Fig. 3).
Polymorphisms of NR5A2 promoter influence protein binding and transcriptional activity
EMSA suggested a difference in the ability of rs2816948 alleles to bind nuclear proteins. Competition experiments carried out with nonspecific oligonucleotides revealed the presence of a specific binding. The band intensity of the G allele was on average 53±14% of the intensity of that of the C allele (P=0.016) and disappeared very easily when competed with increasing amounts of an unlabeled C-specific oligonucleotide (Fig. 5A) Also, the luciferase assays showed that the C to G change resulted in a 24% decrease in the activity of the promoter (P<0.005; Fig. 5B).
Figure 5.
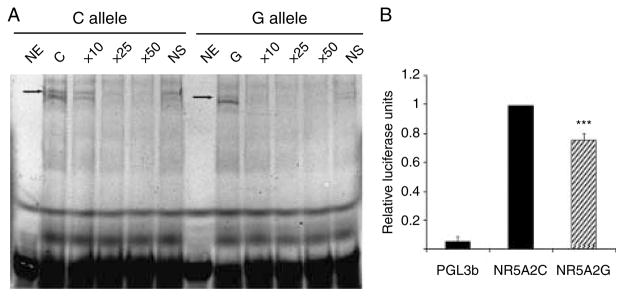
Functional studies. (A) The six lanes on the left correspond to experiments done with a labeled oligonucleotide specific for allele C of the rs2816948 polymorphism, whereas in the six lanes on the right a labeled oligonucleotide specific for allele G was used. NE indicates that no extract was added to the labeled probe. In lanes labeled C and G, nuclear extracts were added to labeled C- and G-specific probes respectively. In lanes labeled 10×, 25×, and 50×, a 10-, 25-, and 50-fold excess of an unlabeled C-specific oligonucleotide was used for interfering the formation of the complexes by either C-specific or G-specific probes. In the lanes labeled as NS, a 50-fold excess of a nonspecific probe was used for competition. The specific complex is indicated with an arrow. (B) Differences in the transcriptional activities of C- and G-specific fragments when cloned in a luciferase reporter vector. The results are the average of four different experiments (***P<0.005).
Discussion
We have shown that NR5A2 is highly expressed in bone and modulates the expression of some osteoblastic genes, thus suggesting that NR5A2 may play a role in skeletal homeostasis.
BMD is a trait with a strong genetic component (17). Genomewide association studies searching for genes associated with BMD have identified several loci at genes known to influence bone metabolism, such as estrogen receptors, osteoprotegerin, lipoprotein receptor-related protein, or sclerostin (18–21). Candidate gene studies have refined the gene regions involved in the association (22). However, the combined effect of those loci explains only a minor proportion of BMD variation in the population. Therefore, much more research is needed to elucidate the genetic factors underlying the hereditary influence on BMD. We found that several SNPs in the 5′ region of the NR5A2 gene were associated with BMD. Among them, the rs2816948 polymorphism showed that allelic differences in the interaction with nuclear proteins and the transcriptional activity of reporter gene constructs. C allele, which displayed higher transcriptional activity, was associated with lower BMD, suggesting that the net result of NR5A2 effect is to decrease bone mass. Consistent with this idea, there was a nonsignificant trend for higher NR5A2 expression in bone samples from patients with hip fractures than in control samples from osteoarthritic patients. The inhibition of NR5A2 resulted in increased expression of osteocalcin and osteoprotegerin, thus suggesting that NR5A2 tends to decrease both factors. Osteocalcin is a well-known marker of differentiated osteoblast function, whereas osteoprotegerin is an inhibitor of osteoclast differentiation. Therefore, NR5A2 might inhibit bone formation and stimulate bone resorption. NR5A2 modulates the expression of aromatase and estrogen receptors in some tissues (6, 8, 23). However, the inhibition of NR5A2 had inconsistent effects on the expression of these genes in the osteoblastic cell line HOS-TE85. Therefore, further studies are needed to clarify whether NR5A2 actually regulates estrogen-related genes in bone.
Genetic association studies have a number of drawbacks, including the difficulty to distinguish between true and casual associations, due to chance, population stratification, or genotyping errors. Decreasing the P value threshold for significance helps to reduce the number of false associations but increases type II error. The replication in different cohorts and functional studies are other approaches to identify true associations. Nevertheless, a number of factors may hamper the replication of true genetic association data (24). Our in vitro studies support the regulatory role of the upstream rs2816948 polymorphism. However, the association was only partially replicated in other cohorts. Alleles at the rs2816948 locus tended to be associated with BMD in the same direction in the two Spanish cohorts, and in fact, they were significant in the global analyses and in the Cantabria cohort, but not in the Valencia cohort, perhaps due to the smaller number of women included. This SNP was not studied in the Kansas City cohort, but other SNPs in the region were not associated with BMD. The role of population differences and environmental influences in those results in presently unclear, but it is interesting to notice that a weak association between BMD and a NR5A2 SNP was reported in a GWAS of other North American population (25).
In conclusion, NR5A2 gene is expressed in bone and modulates gene expression in osteoblasts. Some common polymorphisms in the 5′-region of the gene, which show allelic differences in functional assays in vitro, are associated with femoral neck BMD in Spanish postmenopausal women. These results suggest that the allelic variations in the NR5A2 gene may contribute to explain the genetic influence on bone mass, thus pointing toward NR5A2 as a novel osteoporosis candidate gene.
Acknowledgments
Funding
Collection of samples and analyses were partially supported by grants from Fundación Areces, Universidad de Cantabria–IFIMAV, Instituto de Salud Carlos III (FIS PS 09/00184, PS 09/01687, PI 08/0183, PI09/539, and PI09/0962) and National Institutes of Health (R01AR050496, R01AG026564, and P50AR055081).
We acknowledge the assistance and inputs of Veronica Mijares and Begoña Pineda.
Footnotes
Declaration of interest
The authors declare that there is no conflict of interest that could be perceived as prejudicing the impartiality of the research reported.
References
- 1.Lee NK, Sowa H, Hinoi E, Ferron M, Ahn JD, Confavreux C, Dacquin R, Mee PJ, McKee MD, Jung DY, Zhang Z, Kim JK, Mauvais-Jarvis F, Ducy P, Karsenty G. Endocrine regulation of energy metabolism by the skeleton. Cell. 2007;130:456–469. doi: 10.1016/j.cell.2007.05.047. [DOI] [PMC free article] [PubMed] [Google Scholar]
- 2.Clemens TL, Karsenty G. The osteoblast: an insulin target cell controlling glucose homeostasis. Journal of Bone and Mineral Research. 2011;26:677–680. doi: 10.1002/jbmr.321. [DOI] [PubMed] [Google Scholar]
- 3.Russell M, Mendes N, Miller KK, Rosen CJ, Lee H, Klibanski A, Misra M. Visceral fat is a negative predictor of bone density measures in obese adolescent girls. Journal of Clinical Endocrinology and Metabolism. 2010;95:1247–1255. doi: 10.1210/jc.2009-1475. [DOI] [PMC free article] [PubMed] [Google Scholar]
- 4.Zhao J, Bradfield JP, Li M, Zhang H, Mentch FD, Wang K, Sleiman PM, Kim CE, Glessner JT, Frackelton EC, Chiavacci RM, Berkowitz RI, Zemel BS, Hakonarson H, Grant SF. BMD-associated variation at the osterix locus is correlated with childhood obesity in females. Obesity. 2011;19:1311–1314. doi: 10.1038/oby.2010.324. [DOI] [PubMed] [Google Scholar]
- 5.Xu Z, Ouyang L, Castillo-Olivares A, Pandak WM, Gil G. Alpha(1)-fetoprotein transcription factor (FTF)/liver receptor homolog-1 (LRH-1) is an essential lipogenic regulator. Biochimica et Biophysica Acta. 2010;1801:473–479. doi: 10.1016/j.bbalip.2009.12.009. [DOI] [PMC free article] [PubMed] [Google Scholar]
- 6.Sierens J, Jakody I, Poobalan Y, Meachem SJ, Knower K, Young MJ, Sirianni R, Pezzi V, Clyne CD. Localization and regulation of aromatase liver receptor homologue-1 in the developing rat testis. Molecular and Cellular Endocrinology. 2010;323:307–313. doi: 10.1016/j.mce.2010.03.001. [DOI] [PubMed] [Google Scholar]
- 7.Yazawa T, Inanoka Y, Mizutani T, Kuribayashi M, Umezawa A, Miyamoto K. Liver receptor homolog-1 regulates the transcription of steroidogenic enzymes and induces the differentiation of mesenchymal stem cells into steroidogenic cells. Endocrinology. 2009;150:3885–3893. doi: 10.1210/en.2008-1310. [DOI] [PubMed] [Google Scholar]
- 8.Clyne CD, Speed CJ, Zhou J, Simpson ER. Liver receptor homologue-1 (LRH-1) regulates expression of aromatase in pre-adipocytes. Journal of Biological Chemistry. 2002;277:20591–20597. doi: 10.1074/jbc.M201117200. [DOI] [PubMed] [Google Scholar]
- 9.Medin M, Hermida-Prieto M, Monserrat L, Laredo R, Rodriguez-Rey JC, Fernandez X, Castro-Beiras A. Mutational screening of phospholamban gene in hypertrophic and idiopathic dilated cardiomyopathy and functional study of the PLN −42 C>G mutation. European Journal of Heart Failure. 2007;9:37–43. doi: 10.1016/j.ejheart.2006.04.007. [DOI] [PubMed] [Google Scholar]
- 10.Mozas P, Galetto R, Albajar M, Ros E, Pocovi M, Rodriguez-Rey JC. A mutation (−49C>T) in the promoter of the low density lipoprotein receptor gene associated with familial hypercholester-olemia. Journal of Lipid Research. 2002;43:13–18. [PubMed] [Google Scholar]
- 11.Martinez J, Olmos JM, Hernandez JL, Pinedo G, Llorca J, Obregon E, Valero C, Gonzalez-Macias J. Bone turnover markers in Spanish postmenopausal women: the Camargo Cohort Study. Clinica Chimica Acta. 2009;409:70–74. doi: 10.1016/j.cca.2009.08.020. [DOI] [PubMed] [Google Scholar]
- 12.Lu Y, Fuerst T, Hui S, Genant HK. Standardization of bone mineral density at femoral neck, trochanter and Ward’s triangle. Osteoporosis International. 2001;12:438–444. doi: 10.1007/s001980170087. [DOI] [PubMed] [Google Scholar]
- 13.Xiong DH, Liu XG, Guo YF, Tan LJ, Wang L, Sha BY, Tang ZH, Pan F, Yang TL, Chen XD, Lei SF, Yerges LM, Zhu XZ, Wheeler VW, Patrick AL, Bunker CH, Guo Y, Yan H, Pei YF, Zhang YP, Levy S, Papasian CJ, Xiao P, Lundberg YW, Recker RR, Liu YZ, Liu YJ, Zmuda JM, Deng HW. Genome-wide association and follow-up replication studies identified ADAMTS18 and TGFBR3 as bone mass candidate genes in different ethnic groups. American Journal of Human Genetics. 2009;84:388–398. doi: 10.1016/j.ajhg.2009.01.025. [DOI] [PMC free article] [PubMed] [Google Scholar]
- 14.Purcell S, Neale B, Todd-Brown K, Thomas L, Ferreira MA, Bender D, Maller J, Sklar P, de Bakker PI, Daly MJ, Sham PC. PLINK: a tool set for whole-genome association and population-based linkage analyses. American Journal of Human Genetics. 2007;81:559–575. doi: 10.1086/519795. [DOI] [PMC free article] [PubMed] [Google Scholar]
- 15.Barrett JC, Fry B, Maller J, Daly MJ. Haploview: analysis and visualization of LD and haplotype maps. Bioinformatics. 2005;21:263–265. doi: 10.1093/bioinformatics/bth457. [DOI] [PubMed] [Google Scholar]
- 16.Nyholt DR. A simple correction for multiple testing for single-nucleotide polymorphisms in linkage disequilibrium with each other. American Journal of Human Genetics. 2004;74:765–769. doi: 10.1086/383251. [DOI] [PMC free article] [PubMed] [Google Scholar]
- 17.Ralston SH. Osteoporosis as an hereditary disease. Clinical Reviews in Bone and Mineral Metabolism. 2010;8:68–76. doi: 10.1007/s12018-010-9073-3. [DOI] [Google Scholar]
- 18.Richards JB, Rivadeneira F, Inouye M, Pastinen TM, Soranzo N, Wilson SG, Andrew T, Falchi M, Gwilliam R, Ahmadi KR, Valdes AM, Arp P, Whittaker P, Verlaan DJ, Jhamai M, Kumanduri V, Moorhouse M, van Meurs JB, Hofman A, Pols HA, Hart D, Zhai G, Kato BS, Mullin BH, Zhang F, Deloukas P, Uitterlinden AG, Spector TD. Bone mineral density, osteoporosis, and osteoporotic fractures: a genome-wide association study. Lancet. 2008;371:1505–1512. doi: 10.1016/S0140-6736(08)60599-1. [DOI] [PMC free article] [PubMed] [Google Scholar]
- 19.Styrkarsdottir U, Halldorsson BV, Gretarsdottir S, Gudbjartsson DF, Walters GB, Ingvarsson T, Jonsdottir T, Saemundsdottir J, Center JR, Nguyen TV, Bagger Y, Gulcher JR, Eisman JA, Christiansen C, Sigurdsson G, Kong A, Thorsteinsdottir U, Stefansson K. Multiple genetic loci for bone mineral density and fractures. New England Journal of Medicine. 2008;358:2355–2365. doi: 10.1056/NEJMoa0801197. [DOI] [PubMed] [Google Scholar]
- 20.Styrkarsdottir U, Halldorsson BV, Gretarsdottir S, Gudbjartsson DF, Walters GB, Ingvarsson T, Jonsdottir T, Saemundsdottir J, Snorradottir S, Center JR, Nguyen TV, Alexandersen P, Gulcher JR, Eisman JA, Christiansen C, Sigurdsson G, Kong A, Thorsteinsdottir U, Stefansson K. New sequence variants associated with bone mineral density. Nature Genetics. 2009;41:15–17. doi: 10.1038/ng.284. [DOI] [PubMed] [Google Scholar]
- 21.Duncan EL, Brown MA. Genetic determinants of bone density and fracture risk – state of the art and future directions. Journal of Clinical Endocrinology and Metabolism. 2010;95:2576–2587. doi: 10.1210/jc.2009-2406. [DOI] [PubMed] [Google Scholar]
- 22.Riancho JA, Olmos JM, Pineda B, Garcia-Ibarbia C, Perez-Nunez MI, Nan DN, Velasco J, Cano A, Garcia-Perez MA, Zarrabeitia MT, Gonzalez-Macias J. Wnt receptors, bone mass, and fractures: gene-wide association analysis of LRP5 and LRP6 polymorphisms with replication. European Journal of Endocrinology. 2011;164:123–131. doi: 10.1530/EJE-10-0582. [DOI] [PubMed] [Google Scholar]
- 23.Thiruchelvam PT, Lai CF, Hua H, Thomas RS, Hurtado A, Hudson W, Bayly AR, Kyle FJ, Periyasamy M, Photiou A, Spivey AC, Ortlund EA, Whitby RJ, Carroll JS, Coombes RC, Buluwela L, Ali S. The liver receptor homolog-1 regulates estrogen receptor expression in breast cancer cells. Breast Cancer Research and Treatment. 2011;127:385–396. doi: 10.1007/s10549-010-0994-9. [DOI] [PubMed] [Google Scholar]
- 24.Liu YJ, Papasian CJ, Liu JF, Hamilton J, Deng HW. Is replication the gold standard for validating genome-wide association findings? PLoS ONE. 2008;3:e4037–e4037. doi: 10.1371/journal.pone.0004037. [DOI] [PMC free article] [PubMed] [Google Scholar]
- 25.Kiel DP, Demissie S, Dupuis J, Lunetta KL, Murabito JM, Karasik D. Genome-wide association with bone mass and geometry in the Framingham Heart Study. BMC Medical Genetics. 2007;8(Suppl 1):S14. doi: 10.1186/1471-2350-8-S1-S14. [DOI] [PMC free article] [PubMed] [Google Scholar]


