Abstract
Histologic assessment of cartilage degradation has traditionally involved semiquantitative techniques, the most commonly utilized being the Mankin scale. Such assessments depend on human observer subjectivity, and thus have drawn criticism on the basis of associated inter- and intraobserver variability. We report a newly developed computational image analysis procedure for fully automated and fully objective assessment of the Mankin scale. Image processing routines were developed in a widely used programming environment (Matlab®) to analyze cartilage degradation. One hundred and twenty-five histology images incorporating a wide range of degradation features were analyzed by the algorithm and by seven observers experienced in cartilage histologic assessment. Based on random effects linear statistical models, the computer program performed well, showing a correlation of 0.88 between its Mankin scores and latent (average of human observers’) image scores. Regarding the four subcomponents of the Mankin scale, computer program correlations with observer scores were best for surface defect and proteoglycan depletion, but less favorable for cellularity and tidemark invasion. While limitations exist with image processing techniques, the new algorithm provides an objective and automated method for analyzing cartilage histology sections, consistent with human observer grading.
Keywords: osteoarthritis, cartilage, image processing, comparative histology
INTRODUCTION
Determining the severity of osteoarthritis (OA) is important in clinical care and in research. Organ-level assessments in the clinical setting have traditionally relied on x-ray and structural MRI,1,2 capabilities which recently have been augmented by the compositional information feasible with specialty techniques such as dGEMRIC, T1-rho, and sodium imaging.3 Tissue level analysis in research settings usually takes advantage of more definitive information available histologically. Histologic assessments of OA involve both descriptive terminology4-6 and various categorical grading scales.7-9 The most widely used of these, the Histological Histochemical Grading Scale (HHGS) of Mankin et al.8 and its modified forms, grades cartilage structural damage, reduced cationic staining, abnormality of cellularity, and presence of blood vessels in uncalcified cartilage (Table 1). Modifications of the Mankin scale include accounting for the number of clefts present on the cartilage surface, for reduction in cartilage cationic staining at different depth zones, for subchondral plate thickness, and for changes in chondrocyte size.10-19
Table 1.
Mankin Cartilage Histology Scale
| Structure | Score | Proteoglycan Staining | Score |
|---|---|---|---|
| Normal | 0 | Normal | 0 |
| Surface Irregularities | 1 | Slight Reduction | 1 |
| Pannus | 2 | Moderate Reduction | 2 |
| Cleft to Transitional Zone | 3 | Severe Reduction | 3 |
| Cleft to Radial Zone | 4 | No Dye Noted | 4 |
|
|
|||
| Cleft to Calcified Zone | 5 | Cellularity | |
| Complete disorganization | 6 | Normal | 0 |
|
|
|||
| Tidemark Integrity | Diffuse Hypercellularity | 1 | |
| Intact | 0 | Cloning | 2 |
| Crossed by Blood Vessels | 1 | Hypocellularity | 3 |
Recently, the International Cartilage Repair Society (ICRS)20 and the Osteoarthritis Research Society International (OARSI)21 each introduced additional cartilage histology scales. While potentially representing improvements due to incorporating features not included in the Mankin scale, these newer scales as yet have seen limited use. As a practical matter, the Mankin scale and its modifications remain the most widely used cartilage scoring instruments,8,12,17 and therefore merit ongoing attention for improved implementation.
The Mankin scale is by no means above criticism. Implementations are dependent on human observer judgment, thus drawing criticism regarding inter- and intraobserver variability.22,23 Also, conventional applications typically use only isolated samplings, and do not lend themselves well to continuous spatial mappings. The latter is a substantial limitation in situations where heterogeneity of cartilage pathology and/or of therapeutic response is an important consideration,24 such as for studies involving localized defects or spread of focal degeneration. The availability of automated computational imaging tools for Mankin scorings might reduce these reproducibility and spatial limitations.
Image processing techniques have seen selective application to feature analysis in osteochondral histology. Examples include measurements of surface roughness, cell density, changes of cartilage thickness,25-27 and estimation of glycosaminoglycan content.9,28,29 However, such assessments have usually required considerable user interaction, and their numerical outputs have been difficult to interpret outside of immediate context, thus limiting utility for comparison with widely used grading scales.
We report a new computational image analysis procedure for fully automated and fully objective implementation of the Mankin scale. Purpose-developed algorithm subroutines were used to assign feature-based integer scores for cartilage structural damage (0–6), proteoglycan content (0–4), cellularity (0–3), and tidemark integrity (0–1), the four subcomponents of the overall 14-point score. The algorithm’s performance was validated against Mankin scorings assigned manually by human observers well versed in cartilage pathology.
MATERIALS AND METHODS
Human osteochondral samples were collected from two cadavers and (with IRB approval) from 18 patients undergoing total joint arthroplasty. The samples consisted of 12 femoral heads, 5 femoral condyles, and 7 tibial plateaus, all sectioned at weight-bearing locations. Osteochondral specimens were fixed in neutral-buffered 10% formalin, and then decalcified in 5% formic acid. Decalcified specimens were embedded in paraffin, and sectioned to 5 μm thickness. The sections were stained with hematoxylin, safranin-O, and fast green. All cartilage sections were stained simultaneously by the same technician to maximize consistency.
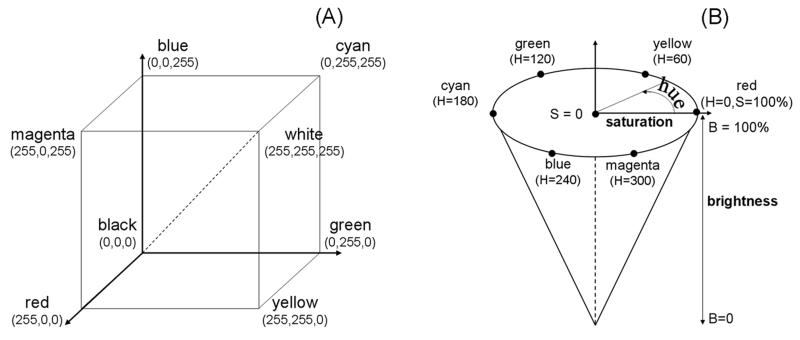
High magnification digital images were captured at 743,028 pixels/mm2 resolution, using a QICAM (QImaging, Surrey, Canada) 12-bit camera mounted on an Olympus BX60 microscope with 4x objective coupled with a stepper-motor-driven stage (Prior Scientific, Rockland, MD). Individual high resolution image fields were concatenated using Image Pro (Media Cybernetics, Silver Spring, MD) to produce (stitched) full cartilage-thickness osteochondral images. These raw data were captured in the form of RGB (red, green, blue) image files, with pixels encoded in terms of integer intensities (0–255) for each of the three independent color channels. While conveniently implemented in scanner electronics and thus widely used for digital image encoding, the RGB color scheme is not well suited for direct correspondence to human color perception, except in special cases of purely red, purely green, or purely blue images. Since an important goal of the image analysis program was to automate a grading scale designed for use by human observers, the osteochondral images were converted to HSB (hue-saturation-brightness) encodement (Fig. 1), which directly corresponds to human color perception.30 In HSB, hue (0–360°) quantifiably represents color as perceived visually. HSB holds two important attractions for Mankin scorings: it allows identification of safranin-O positive pixels, based on hues within the range of 288° (to 360°/0°) to 72°, corresponding to red-ocher values, and the saturation value (0–255) corresponds to intensity of coloration, thereby directly quantifying safranin-O staining intensity.
Figure 1.
(A) RGB color cube, with specific component values at each corner. (B) HSB color cone, with specific colors at selected values on the continuous hue circle.
Four purpose-composed independent computational processor routines were coded in Matlab 7.02 (Natick, MA) to generate Mankin scores based on summation of the four component subscores (structure, proteoglycan content, cellularity, and tidemark integrity).
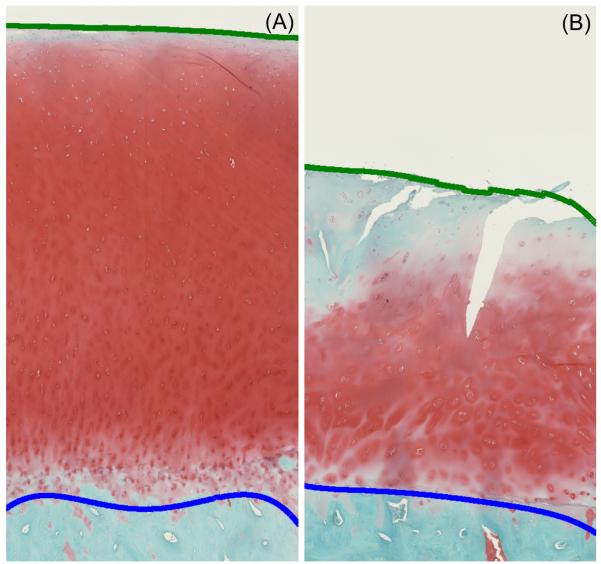
To assign quantitative structural defect scores based on depth of cartilage surface defects (clefts), the nominal topology of the OA-induced “jagged” surface was first approximated by datum quadratic curve fits. Cleft/defect depths were then calculated based on the local distance between this (datum) nominal surface and the actual surface. Cleft/defect depths in turn were normalized to nominal cartilage thickness, defined as the distance between the nominal surface quadratic curves and quadratic curves similarly fit to the nominal osteochondral junction. These relative defect depths were then stratified into pre-defined ranges corresponding to the respective Mankin structural damage categories (Fig. 2, Table 2). The structural damage ranges were assigned based on illustrative histology sections with different structural defects and on idealized thicknesses of different depth zones relative to (uncalcified and calcified) cartilage thickness.31,32 The superficial zone was taken to comprise the top 15%, the transitional and radial zones each accounted for the next 30% and 20%, respectively, and calcified cartilage accounted for the remaining 35%. Pannus formation, common in rheumatoid arthritis but not normally a feature of OA, was not observed in any of our samples.
Figure 2.
(A) Normal and (B) OA cartilage histology images with quadratic curves fit for the smoothed cartilage surface (green line) and the osteochondral boundary (blue line).
Table 2.
Mankin Structural Damage Scoring Criteria used in the Automated Program
| Cartilage structure |
Cleft depth
(% cartilage thickness) |
HHGS structural score |
|---|---|---|
|
| ||
| Normal | Less than 5% | 0 |
| Surface irregularities | 5% to 15% | 1 |
| Pannus | Disregarded | n/a for osteoarthritis |
| Cleft to transitional zone | 15% to 45% | 3 |
| Cleft to radial zone | 45% to 65% | 4 |
| Cleft to calcified zone | above 65% | 5 |
| Eburnation | No cartilage present | 6 |
The characteristic decrease in proteoglycan (PG) content in OA results in reduced intensity of cartilage staining by safranin-O, a cationic dye that binds specifically and stoichiometrically to sulfated glycosaminoglycans.33 To assign Mankin subscores for PG loss analogous to those assigned by human observers, the algorithm utilized the saturation component of the HSB color scale in the range of near-red hues (288° to 360°/ 0° to 72°) most closely corresponding to PG coloration. PG loss was determined based on a metric termed the section proteoglycan value (SPGV):
| (1) |
SPGV-based Mankin subscores for PG loss were then calculated based on thresholds (Table 3) from a pilot study (Supplementary Material: Appendix A) in which safranin-O staining of cartilage specimens was measured for varying levels of hyaluronidase-induced PG depletion.
Table 3.
Surface Proteoglycan Value (SPGV) Ranges used for Mankin PG Depletion Scores
| PG staining | HHGS PG score | SPGV range |
|---|---|---|
|
| ||
| Normal | 0 | > 0.45 |
| Slight reduction | 1 | 0.4 - 0.45 |
| Moderate reduction | 2 | 0.3 - 0.4 |
| Severe reduction | 3 | 0.15 - 0.3 |
| No staining | 4 | < 0.15 |
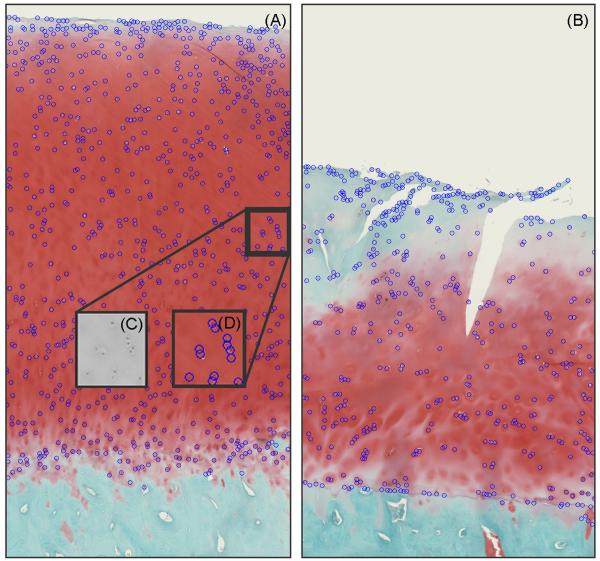
Cellularity subscoring computations utilized (hematoxylin-stained-dark) nuclei identified by means of thresholding25,34,35 and edge detection.36 A Sobel transform (i.e., spatial gradient mapping) of the HSB brightness image was used to detect nuclear boundaries. These segmented (dark) objects were filtered based on size, where objects larger than 1.19×103 μm2 or smaller than 47.8 μm2 (equivalent circular diameters of 39.0 μm and 7.8 μm, respectively) were removed. Shape per se was not considered in this object identification. Comparisons between manually selected and auto-segmented nuclei counts of hematoxylin-stained cartilage samples showed 85% to 90% concordance, indicating the algorithm’s consistent detection of the stained nuclei. Cell density scorings were then computed, based on departures in local cell density from corresponding values37,38 for normal cartilage (Fig. 3 and Table 4). Cellular cloning was detected by distance-based hierarchical tree clustering. Cells located nearest to one another were provisionally clustered (grouped) based on their (Euclidean) physical distances from one another.39 To implement this discriminant, ever-larger groups of cells were successively clustered together until the average separation distance of all members in the clusters exceeded a threshold of 100 μm, 5–10 times the typical cell radius.
Figure 3.
Labeled nuclei in (A) normal and (B) hypocellular cartilage images with (C) zoomed-in view of a small region of the HSB brightness image and (D) matching labeled nuclei.
Table 4.
Zone-Dependent Counts per Unit Area for Normal Cartilage (Mankin Cellularity score= 0)
| Cartilage zone (% cartilage thickness) |
Normal range (cells per mm2) |
|---|---|
|
| |
| Superficial (15%) | 126 to 298 |
| Transitional (15 to 45%) | 99 to 165 |
| Middle (45 to 65%) | 79 to 145 |
| Deep (above 65%) | 83 to 159 |
The presence versus absence of blood vessels penetrating the tidemark was determined by first auto-segmenting the tidemark-facing base of the red-stained PG region. Next, size filtering was used to exclude any matrix discontinuity whose area was less than 837 μm2 (cell-sized) or greater than 1.20×105μm2 (marrow space-sized). Probabilistic shape detection was then employed on remaining tidemark gaps to identify blood vessels based on goodness of fit of least–squares-error ellipses fitted to these boundary discontinuity features.40 Further technical details of the image analysis procedures are reported elsewhere.41
For purposes of algorithm validation, scores generated computationally were compared to scores independently assigned by seven experienced human observers, each scoring 25 image fields. Each scored image field involved an osteochondral section whose surface arc length was comparable to its cartilage thickness. Three observers scored the same set of image fields (to assess interobserver variability); the other four scored entirely different sets of image fields. Intraobserver variability was quantified by having each observer (unknowingly) repeat five randomly selected image fields during their scoring session.
A key consideration was how well the computer scores predicted the latent (true) image scores, where the latent score was defined as the average observer score, taken across the population of observers. These latent scores are in general different from any of the individual observer scores. The individual observer scores can be thought of as the latent scores plus reader measurement “error.” Two random effects models were fitted. Model #1 portioned the variability of the observer scores into variance components attributable either to latent image variability or to reader measurement error. Model #2 was similar, but also included the computer score as an independent variable. The two models were used to measure the prediction ability of the computer scores in terms of the proportion of variance in the latent image scores explained by the computer scores and of the correlation between the computer and latent scores. (Detailed statistical considerations are set forth in Supplementary Material: Appendix B.) Prior to performing their scorings, each observer was asked to review a series of example images of the pertinent abnormality features (Supplementary Material: Appendix C).
RESULTS
Good between- and within-observer agreement was found, based on the parameter estimates for Model #1. Scores assigned to the same image by different observers had a 0.851 correlation, indicating strong agreement between observers. Re-scorings of the same image by the same observer had a 0.967 correlation, showing very high within-observer agreement. The variability due to observer measurement error was small compared to the variability due to image differences, resulting in high correlation (0.922) between latent and individual observer scores.
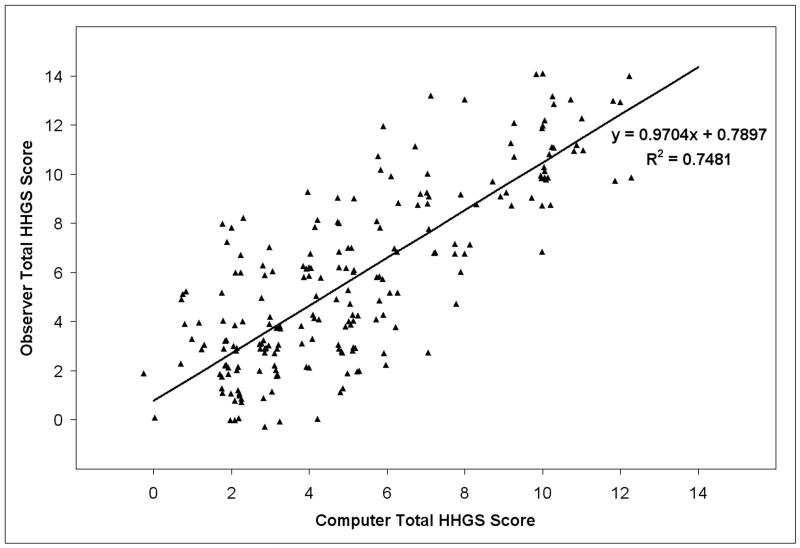
The scores generated by the computer program showed very strong agreement with those assigned by the observers (Fig. 4), with Model #2’s regression line having a slope of 0.970 (SE = 0.061). The regression line intercept deviated from zero by 0.790 (SE = 0.449), indicating that the algorithm tended to assign slightly more favorable scores than did the human observers. This difference was also reflected in a slightly lower mean computer score (5.30) compared to the mean for observer-assigned scores (5.89). As expected, the standard deviation of the observer scores (0.397), estimated using Model #1, was somewhat higher than that of the computer scores (0.268).
Figure 4.
Observer-assigned Mankin values versus computer-generated scores. Jitter has been added to separate identical data points.
Variance component estimates are presented in Table 5. A pronounced reduction in image variance (σ2I = 2.86 for Model #2, vs. 11.34 for Model #1) was found when the computer score was included as an independent variable. Since the variance estimates for Model #2 depended on the value of the computer score, it is not surprising that the latent image variance was much less for Model #2 than for Model #1, because the computer scores would be expected to be predictive of the latent image scores. Based on this reduction in image variance (R2 = 0.773), the correlation between computer and latent image scores was estimated to be 0.881. This compares favorably to the 0.922 correlation between observer and latent image scores. On the other hand, the other three variance components, which comprise reader measurement error, were similar for both models. This is reasonable, since the computer scores would not be expected to be predictive of reader measurement error.
Table 5.
Variance Component Estimates
| Variance Component | Model 1 | Model 2 |
|---|---|---|
|
| ||
| Observer (σO) | 0.3437 | 0.4200 |
| Image (σI) | 11.3350 | 2.8550 |
| Observer * Image (σOI) | 1.1975 | 1.1500 |
| Intra-obsever (replication, σε) | 0.4462 | 0.4501 |
| Total | 13.3224 | 4.8751 |
Computer-generated versus observer-assigned subscores for structural damage and for proteoglycan depletion demonstrated excellent and good agreement, respectively, with slopes of 0.835 (R2 = 0.87) and 0.697 (R2 = 0.63). However, much less agreement occurred between the computer and the human observers for cellularity (slope = 0.215, R2 = 0.07), and little to no agreement for tidemark integrity (slope = −0.016, R2 = 0.06). Although together constituting only 4 points of the overall 14-point scale, the high levels of human observer variability in both these categories effectively precluded the possibly of close computer agreement with the observer scores.
DISCUSSION
Automated, objective, image analysis-based implementation of Mankin scoring proved technically feasible and yielded results reasonably consistent with the latent scores (surrogate gold standard) assigned by human observers. This development therefore represents a step toward eliminating the observer variability recognized as compromising this widely used grading system. In principle, similarly conceived approaches could be applied for modified versions of the original Mankin classification and/or for the recently introduced OARSI and ICRS scales, even though the ICRS scale formally grades regeneration/repair rather than degeneration per se.
Integer scores for the four subcomponents of the Mankin scale required thresholding of continuous variables measured computationally (e.g., relative defect depth and proteoglycan saturation). The specific threshold levels used (Tables 2, 3, and 4) were necessarily determined empirically, based on habitual Mankin scoring practice for human hip and knee cartilage. These particular threshold values might need to be altered for other anatomic sites and/or species.
Recognition of histological artifact is one area in which computational feature detection is disadvantaged relative to human observation. Toward minimizing such confounding effects, the present dataset consisted of slides all prepared by a single highly experienced histologist, with all staining being done in a single batch. This “best case scenario” does not necessarily favor the computer program relative to the human observers (or vice versa), but it does reduce variance and therefore enhance correlation, compared to less well controlled settings characteristic of customary histologic practice. Nevertheless, to obtain maximally meaningful quantitative results (e.g., matrix staining intensity assessments), the importance of consistency of histological technique (e.g., uniform section thicknesses) cannot be overemphasized.
The reasonable overall correlation between the image analysis scores and the human observer scores arose primarily from the good agreements in the structural damage and proteoglycan subscales, which between them account for 10 of the 14 total points of the Mankin scale. Agreement for the two lesser-weighted subcomponents (cellularity and tidemark integrity) was less encouraging. Formulating algorithmic logic to quantify cellularity and tidemark violation was more complex than for detecting structural damage or PG depletion. However, the excessive underlying variance of the human observer scores for cellularity and for tidemark violation unavoidably precluded good agreement with the algorithm’s results, regardless of computational logic acuity. For these two subscales, the limitations of subjective assessment are especially evident, highlighting the value of objective determinations. The high observer variance for cellularity may have arisen in part from the non-monotonic nature of cellularity scorings, where cell densities higher than normal cartilage are scored as one, while cell densities lower than normal cartilage are scored as three. This differs conceptually from the HHGS structural defect and proteoglycan concentration scorings, which increase monotonically with the associated visual attribute (surface cleft depth or reduced cationic staining intensity, respectively.)
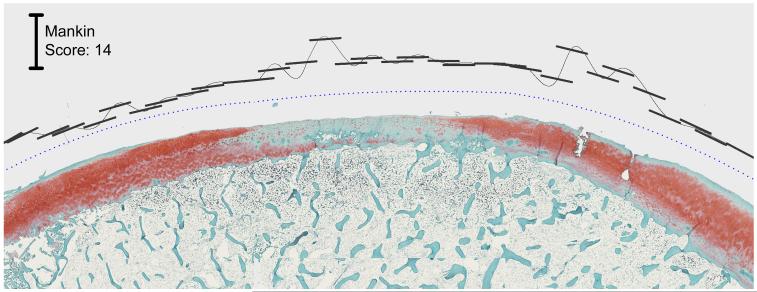
Another attraction of computational scoring lies in its ability to process efficiently much larger amounts of image data than tractable manually. Rather than traditional restriction to spot samplings, the image analysis approach enables rapid scoring of many small sectors of an articular surface. This opens the way for mapping continuous (or nearly so) spatial distributions of abnormality, an important consideration for regional degeneration or focal defects (Fig. 5).
Figure 5.
Mankin scores generated for cartilage with focal damage. The blue dotted datum line parallels global approximation of the cartilage surface. The short black line segments delimit the cartilage sectors over which local scores are computed, and these segments’ distances from the datum line identify the local score magnitude.
In summary, computational image analysis implementation of Mankin scoring proved technically feasible, yielding overall results reasonably consistent with human observer scoring. Importantly, the computational approach avoids the historical limitation of human observer variability. Additionally, this new approach lends itself to processing very large amounts of image data rapidly, enabling continuous spatial mappings of degeneration/abnormality.
Supplementary Material
ACKNOWLEDGEMENTS
Financial assistance was provided by NIH grants P50-AR048939 and P50-AR055533, and by a fellowship (FMH) from Tau Beta Pi. We appreciate the technical assistance of (histologist) Ms. Gail Kurriger. We also thank (image readers) Drs. Annunziato Amendola, Joseph Buckwalter, J. Lawrence Marsh, Todd McKinley, Jose Morcuende, Yuki Tochigi, and Brian Wolf, for their time and advice. The views expressed in this article are those of the authors and do not necessarily represent the views of the Department of Veterans Affairs.
Footnotes
Additional Supporting Information may be found in the online version of this article.
REFERENCES
- 1.Gray ML, Eckstein F, Peterfy C, et al. Toward imaging biomarkers for osteoarthritis. Clin Orthop Relat Res. 2004;427S:175–181. doi: 10.1097/01.blo.0000144972.50849.d9. [DOI] [PubMed] [Google Scholar]
- 2.Peterfy CG, Guermazi A, Zaim S, et al. Whole-organ magnetic resonance imaging score (WORMS) of the knee in osteoarthritis. Osteoarthritis Cartilage. 2004;12:177–190. doi: 10.1016/j.joca.2003.11.003. [DOI] [PubMed] [Google Scholar]
- 3.Gray ML, Burstein D, Kim Y-J, et al. Magnetic resonance imaging of cartilage glycosaminoglycan: basic principles, imaging technique, and clinical applications. J Orthop Res. 2008;26:281–291. doi: 10.1002/jor.20482. [DOI] [PubMed] [Google Scholar]
- 4.O’Driscoll SW, Keeley FW, Salter RB. The chondrogenic potential of free autogenous periosteal grafts for biological resurfacing of major full-thickness defects in joint surfaces under the influence of continuous passive motion. An experimental investigation in the rabbit. J. Bone Joint Surg[Am] 1986;68:1017–1035. [PubMed] [Google Scholar]
- 5.DePalma AF, McKeever CD, Subin DK. Process of repair of articular cartilage demonstrated by histology and autoradiography with tritiated thymidine. Clin Orthop Relat Res. 1966;48:229–242. [PubMed] [Google Scholar]
- 6.Convery FR, Akeson WH, Keown GH. The repair of large osteochondral defects. An experimental study in horses. Clin Orthop Relat Res. 1972;82:253–262. [PubMed] [Google Scholar]
- 7.Collins DH. The pathology of articular and spinal disease. Edward Arnold & Co; London: 1949. [Google Scholar]
- 8.Mankin HJ, Dorfman H, Lippiello L, et al. Biochemical and metabolic abnormalities in articular cartilage from osteoarthritic human hips. II. Correlation of morphology with biochemical and metabolic data. J. Bone Joint Surg [Am] 1971;53:523–537. [PubMed] [Google Scholar]
- 9.O’Driscoll SW, Marx RG, Beaton DE, et al. Validation of a simple histological-histochemical cartilage scoring system. Tissue Eng. 2001;7:313–320. doi: 10.1089/10763270152044170. [DOI] [PubMed] [Google Scholar]
- 10.Bulstra SK, Buurman WA, Walenkamp GH, et al. Metabolic characteristics of in vitro cultured human chondrocytes in relation to the histopathologic grade of osteoarthritis. Clin Orthop Relat Res. 1989;242:294–302. [PubMed] [Google Scholar]
- 11.Fini M, Giavaresi G, Torricelli P, et al. Pulsed electromagnetic fields reduce knee osteoarthritic lesion progression in the aged Dunkin Hartley guinea pig. J Orthop Res. 2005;23:899–908. doi: 10.1016/j.orthres.2005.01.008. [DOI] [PubMed] [Google Scholar]
- 12.Ghosh P, Holbert C, Read R, et al. Hyaluronic acid (hyaluronan) in experimental osteoarthritis. J Rheumatol Suppl. 1995;43:155–157. [PubMed] [Google Scholar]
- 13.Matsui H, Shimizu M, Tsuji H. Cartilage and subchondral bone interaction in osteoarthrosis of human knee joint: a histological and histomorphometric study. Microsc Res Tech. 1997;37:333–342. doi: 10.1002/(SICI)1097-0029(19970515)37:4<333::AID-JEMT8>3.0.CO;2-L. [DOI] [PubMed] [Google Scholar]
- 14.von Lewinski G, Pressel T, Hurschler C, et al. The influence of intraoperative pretensioning on the chondroprotective effect of meniscal transplants. Am J Sports Med. 2006;34:397–406. doi: 10.1177/0363546505281801. [DOI] [PubMed] [Google Scholar]
- 15.Lippiello L, Hall D, Mankin HJ. Collagen synthesis in normal and osteoarthritic human cartilage. J Clin Invest. 1977;59:593–600. doi: 10.1172/JCI108676. [DOI] [PMC free article] [PubMed] [Google Scholar]
- 16.Treppo S, Koepp H, Quan EC, et al. Comparison of biomechanical and biochemical properties of cartilage from human knee and ankle pairs. J Orthop Res. 2000;18:739–748. doi: 10.1002/jor.1100180510. [DOI] [PubMed] [Google Scholar]
- 17.Lovasz G, Llinas A, Benya P, et al. Effects of valgus tibial angulation on cartilage degeneration in the rabbit knee. J Orthop Res. 1995;13:846–853. doi: 10.1002/jor.1100130607. [DOI] [PubMed] [Google Scholar]
- 18.Bobinac D, Spanjol J, Zoricic S, et al. Changes in articular cartilage and subchondral bone histomorphometry in osteoarthritic knee joints in humans. Bone. 2003;32:284–290. doi: 10.1016/s8756-3282(02)00982-1. [DOI] [PubMed] [Google Scholar]
- 19.Furman BD, Strand J, Hembree WC, et al. Joint degeneration following closed intraarticular fracture in the mouse knee: a model of posttraumatic arthritis. J Orthop Res. 2007;25:578–592. doi: 10.1002/jor.20331. [DOI] [PubMed] [Google Scholar]
- 20.Mainil-Varlet P, Aigner T, Brittberg M, et al. Histological assessment of cartilage repair: a report by the Histology Endpoint Committee of the International Cartilage Repair Society (ICRS) J. Bone Joint Surg [Am] 2003;85-A9(Suppl 2):45–57. [PubMed] [Google Scholar]
- 21.Pritzker KP, Gay S, Jimenez SA, et al. Osteoarthritis cartilage histopathology: grading and staging. Osteoarthritis Cartilage. 2006;14:13–29. doi: 10.1016/j.joca.2005.07.014. [DOI] [PubMed] [Google Scholar]
- 22.van der Sluijs JA, Geesink RG, van der Linden AJ, et al. The reliability of the Mankin score for osteoarthritis. J Orthop Res. 1992;10:58–61. doi: 10.1002/jor.1100100107. [DOI] [PubMed] [Google Scholar]
- 23.Ostergaard K, Petersen J, Andersen C, et al. Histologic/histochemical grading system for osteoarthritic articular cartilage. Arthritis Rheum. 1997;40:1766–1771. doi: 10.1002/art.1780401007. [DOI] [PubMed] [Google Scholar]
- 24.Custers RJH, Creemers LB, Verbout AJ, et al. Reliability, reproducibility, and variability of traditional histologic/histochemical grading system vs the new OARSI osteoarthritis cartilage histopathology assessment system. Osteoarthritis Cartilage. 2007;15:1241–1248. doi: 10.1016/j.joca.2007.04.017. [DOI] [PubMed] [Google Scholar]
- 25.Yoshioka M, Coutts RD, Amiel D, et al. Characterization of a model of osteoarthritis in the rabbit knee. Osteoarthritis Cartilage. 1996;4:87–98. doi: 10.1016/s1063-4584(05)80318-8. [DOI] [PubMed] [Google Scholar]
- 26.Hacker SA, Healey RM, Yoshioka M, et al. A methodology for the quantitative assessment of articular cartilage histomorphometry. Osteoarthritis Cartilage. 1997;5:343–355. doi: 10.1016/s1063-4584(97)80038-6. [DOI] [PubMed] [Google Scholar]
- 27.Pastoureau P, Leduc S, Chomel A, et al. Quantitative assessment of articular cartilage and subchondral bone histology in the meniscectomized guinea pig model of osteoarthritis. Osteoarthritis Cartilage. 2003;11:412–423. doi: 10.1016/s1063-4584(03)00050-5. [DOI] [PubMed] [Google Scholar]
- 28.O’Driscoll SW, Marx RG, Fitzsimmons JS, et al. Method for automated cartilage histomorphometry. Tissue Eng. 1999;5:13–23. doi: 10.1089/ten.1999.5.13. [DOI] [PubMed] [Google Scholar]
- 29.Martin I, Obradovic B, Freed LE, et al. Method for quantitative analysis of glycosaminoglycan distribution in cultured natural and engineered cartilage. Ann Biomed Eng. 1999;27:656–662. doi: 10.1114/1.205. [DOI] [PubMed] [Google Scholar]
- 30.Gonzalez RC, Woods RE. Digital image processing. Prentice Hall; Upper Saddle River, NJ: 2002. [Google Scholar]
- 31.Muller-Gerbl M, Schulte E, Putz R. The thickness of the calcified layer of articular cartilage: a function of the load supported? J Anat. 1987;154:103–111. [PMC free article] [PubMed] [Google Scholar]
- 32.Lane LB, Bullough PG. Age-related changes in the thickness of the calcified zone and the number of tidemarks in adult human articular cartilage. J. Bone Joint Surg [Br] 1980;62:372–375. doi: 10.1302/0301-620X.62B3.7410471. [DOI] [PubMed] [Google Scholar]
- 33.Rosenberg L. Chemical basis for the histological use of safranin O in the study of articular cartilage. J. Bone Joint Surg [Am] 1971;53:69–82. [PubMed] [Google Scholar]
- 34.Tseleni S, Kavantzas N, Yova D, et al. Findings of computerised nuclear morphometry of papillary thyroid carcinoma in correlation with known prognostic factors. J. Exp Clin Cancer Res. 1997;16:401–406. [PubMed] [Google Scholar]
- 35.Loukas CG, Linney A. A survey on histological image analysis-based assessment of three major biological factors influencing radiotherapy: proliferation, hypoxia and vasculature. Comput Methods Programs Biomed. 2004;74:183–199. doi: 10.1016/j.cmpb.2003.07.001. [DOI] [PubMed] [Google Scholar]
- 36.Mouroutis T, Roberts SJ, Bharath AA. Robust cell nuclei segmentation using statistical modelling. Bioimaging. 1998;6:79–91. [Google Scholar]
- 37.Mitrovic D, Quintero M, Stankovic A, et al. Cell density of adult human femoral condylar articular cartilage. Lab Invest. 1983;49:309–316. [PubMed] [Google Scholar]
- 38.Vignon E, Arlot M, Patricot LM, et al. The cell density of human femoral head cartilage. Clin Orthop Relat Res. 1976;121:303–308. [PubMed] [Google Scholar]
- 39.Chen CH, Pau LF, Wamg PS. Handbook of pattern recognition & computer vision. World Scientific; Singapore: 1999. [Google Scholar]
- 40.Halir R, Flusser J. International Conference on Computer Graphics and Visualization. University of West Bohemia Press; Plzen, Czech Republic: 1998. Numerically stable direct least squares fitting of ellipses; pp. 125–132. [Google Scholar]
- 41.Moussavi-Harami SF. MS Thesis. Department of Biomedical Engineering, University of Iowa; 2007. Custom image analysis program for automated objective scoring of histologically apparent cartilage degeneration. [DOI] [PMC free article] [PubMed] [Google Scholar]
Associated Data
This section collects any data citations, data availability statements, or supplementary materials included in this article.


