

Abstract
Reduction and oxidation (redox) chemistry is increasingly implicated in cancer pathogenesis. To interrogate the redox status of prostate tumors noninvasively, we developed hyperpolarized [1-13C]dehydroascorbate (13C-DHA), the oxidized form of vitamin C, as an MR probe. In a model of transgenic adenocarcinoma of the mouse prostate (TRAMP), increased reduction of hyperpolarized 13C-DHA to vitamin C was observed in tumor, as compared with normal prostate and surrounding benign tissue. We hypothesized that this difference was due to higher concentrations of glutathione and increased transport of hyperpolarized 13C-DHA via the glucose transporters (GLUT1, GLUT3, and GLUT4) in TRAMP tumor. To test these hypotheses, hyperpolarized 13C-DHA MR spectroscopy (MRS) and 18F-FDG PET were applied as complementary technologies in the TRAMP model.
Methods
Late-stage TRAMP tumors (>4 cm3) were studied at similar time points (MR studies conducted < 24 h after PET) in fasting mice by 18F-FDG PET and hyperpolarized 13C-DHA MR imaging on a small-animal PET/CT scanner and a 1H/3C 3-T MR scanner. PET data were processed using open-source AMIDE software to compare the standardized uptake values of tumor with those of surrounding muscle, and 13C-DHA MRS data were processed using custom software to compare the metabolite ratios (vitamin C/[vitamin C + 13C-DHA]). After in vivo studies, the tumor glutathione concentrations were determined using a spectrophotometric assay, and thiol staining was performed using mercury orange. Real-time polymerase chain reaction was used to evaluate the relevant transporters GLUT1, GLUT3, and GLUT4 and vitamin C transporters SVCT1 and SVCT2. GLUT1 was also evaluated by immunohistochemistry.
Results
The average metabolite ratio was 0.28 ± 0.02 in TRAMP tumor, versus 0.11 ± 0.02 in surrounding benign tissue (n = 4), representing a 2.5-fold difference. The corresponding tumor-to-nontumor 18F-FDG uptake ratio was 3.0. The total glutathione was 5.1 ± 0.4 mM in tumor and 1.0 ± 0.2 mM in normal prostate, whereas reduced glutathione was 2.0 ± 0.3 mM and 0.8 ± 0.3 mM, respectively, corresponding to a 2.5-fold difference. In TRAMP tumor, mercury orange staining demonstrated increased thiols. Real-time polymerase chain reaction showed no significant difference in GLUT1 messenger RNA between TRAMP tumor and normal prostate, with immunohistochemistry (anti-GLUT1) also showing comparable staining.
Conclusion
Both hyperpolarized 13C-DHA and 18F-FDG provide similar tumor contrast in the TRAMP model. Our findings suggest that the mechanism of in vivo hyperpolarized 13C-DHA reduction and the resulting tumor contrast correlates most strongly with glutathione concentration. In the TRAMP model, GLUT1 is not significantly upregulated and is unlikely to account for the contrast obtained using hyperpolarized 13C-DHA or 18F-FDG.
Keywords: hyperpolarized, ascorbate, redox, positron emission tomography, FDG
Prostate cancer is the second most common cancer occurring among American men, resulting in an estimated 33,720 deaths in 2011 (1). Radiation therapy, with or without concomitant hormonal therapy, is a mainstay of prostate cancer therapy, with more than 750,000 patients treated per year. Of newly diagnosed prostate cancer patients, approximately 30% have high-risk disease (stage T3–T4, initial prostate-specific antigen level greater than 20 μg/L, or Gleason score of 8–10) and are at risk for biochemical and clinical failure after therapy (2). Even with modern conformal radiation therapy, treatment failure occurs in approximately 45% of patients with locally defined disease (3). A variety of biochemical events is implicated in radiation resistance, including acid ceramidase upregulation (4), downregulation of DAB2IP RAS glutamyl transpeptidase expression (5), and the effects of androgens (6). Increasingly, redox (reduction and oxidation) mechanisms are considered critical in this process (7). The cytotoxic effect of radiation therapy is mediated by generation of reactive oxygen species in tissue, which cause oxidative damage in DNA, proteins, and lipids leading to DNA strand breaks, loss of protein function, and membrane damage. A recent study demonstrated that reduced nicotinamide adenine dinucleotide phosphate oxidase enzymes are upregulated in response to androgens, stimulating the production of stress molecules and antioxidative enzymes; inhibition of these enzymes sensitizes human prostate cancer cells in vitro to radiation (6). Additional studies have found a critical role for glutathione in mediating radiation resistance in prostate cancer (8,9). Intracellular redox status is often characterized by the ratio of reduced to oxidized glutathione (glutathione-to-GSSG ratio), and decreasing this ratio in vitro (by addition of selenite) was found to radiosensitize prostate cancer cells (10). Elevated glutathione and other antioxidants observed in cancer are increasingly seen as “redox adaptation,” which several new therapies aim to exploit, including the thiol-depleting agent 4-benzyl-2-methyl-1,2,4-thiadiazolidine-3,5-dione (11). To determine therapy efficacy and identify those patients at high risk for therapy failure, companion biomarkers for the redox state of prostate cancer are needed.
Hyperpolarized 13C MR spectroscopy (MRS) has tremendous potential to address limitations in prostate cancer management and customize treatment to the molecular phenotypes of individual patients. This methodology is based on polarizing nuclear spins in an amorphous solid state at approximately 1.2°K through coupling of the nuclear spins with unpaired electrons that are added to the sample via an organic free radical (12,13). In the solid state, the high electron spin polarization is in part transferred to the nuclear spins by microwave irradiation (14) and then the sample is rapidly dissolved for injection into a system of interest. 13C-labeled substrates have recently been polarized to obtain dramatic enhancements of the 13C nuclear MR signals (>50,000 fold at 3 T) of the substrate as well as subsequent metabolic products (15,16). [1-13C]pyruvate (13C-pyruvate) has been the most widely used probe for hyperpolarized MR studies since it polarizes well, has a long spin-lattice relaxation time, and is rapidly taken up by the cell and metabolized at the juncture of glycolysis, tricarboxylic acid cycle, amino acid biosynthesis, and other critical pathways. In vivo MRS studies using hyperpolarized 13C-pyruvate have been correlated with aggressiveness and response to therapy. Specifically, in a model of transgenic adenocarcinoma of the mouse prostate (TRAMP), increases in hyperpolarized [1-13C]lactate (13C-lactate) observed after injection of hyperpolarized 13C-pyruvate correlated with tumor grade (17). This technique has recently been extended to human patients in a phase 1 clinical trial at the University of California, San Francisco, demonstrating the potential for rapid clinical translation (18).
Recently, we developed hyperpolarized [1-13C]dehydroascorbate (13C-DHA) as an MR probe to investigate the redox changes in prostate cancer (19). This probe shares several features with 13C-pyruvate, including a long spin-lattice relaxation time and rapid in vivo conversion on the time scale of the hyperpolarized MR experiment. These features suggest similar outstanding potential for clinical translation. The goal of this probe is noninvasive determination of redox status, which may be critical in therapy selection and timing. Previous studies showed significantly higher reduction of hyperpolarized 13C-DHA to vitamin C in TRAMP tumor than in normal prostate (Fig. 1) (19). In the present study, these in vivo findings were validated in a larger cohort of mice and correlated with the concentrations of glutathione and the expression of relevant transporters. The results have implications both for the diagnostic utility of the probe and for new therapies targeting redox.
FIGURE 1.
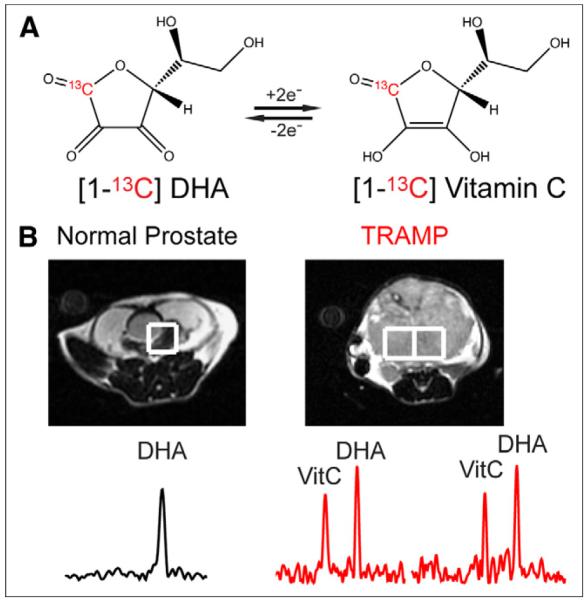
Hyperpolarized 13C-DHA in TRAMP model. (A) Two-electron interconversion of 13C-DHA and [1-13C]vitamin C. (B) Characteristic MRS spectra for voxels corresponding to normal prostate and TRAMP tumor after injection of hyperpolarized 13C-DHA, demonstrating increased conversion to hyperpolarized vitamin C in TRAMP. VitC = vitamin C.
In contrast to vitamin C, which is transported via the Na+-dependent cotransporters SVCT1 and SVCT2, 13C-DHA enters cells by the glucose transporters GLUT1, GLUT3, and GLUT4 and is subsequently reduced (20). The uptake and conversion of 13C-DHA and vitamin C are summarized in Figure 2. This mechanism suggests that the differences in vitamin C signals observed in hyperpolarized 13C-DHA in vivo studies may be transporter-dependent and analogous to the GLUT-dependent uptake of 18F-FDG. The uptake and metabolism of 18F-FDG have been extensively studied in vitro and in vivo, and GLUT transport, followed by intracellular phosphorylation by hexokinase, has been identified as a key step for subsequent tissue accumulation (21). The best-studied transporter is GLUT1, although several other isoforms are implicated (22). GLUT1 is highly expressed in a variety of neoplasms, including lung, breast, and colorectal cancers (23–25). In metastatic non–small cell lung cancer, GLUT1 expression was higher in true-positive lymph nodes than in false-negative lymph nodes, and the relatively low 18F-FDG uptake in lung adenocarcinomas (making them more difficult to detect) is considered secondary to their relatively weak expression of GLUT1 (26). These results indicate a correlation between GLUT1 expression and 18F-FDG uptake that can be used to detect a variety of fast-growing cancers.
FIGURE 2.
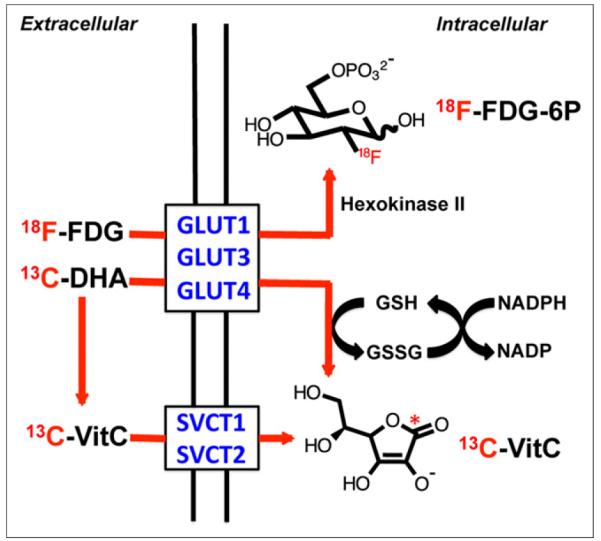
Mechanism for transport of 18F-FDG, 13C-DHA, and [1-13C]vitamin C into cells. 18F-FDG and 13C-DHA are transported by glucose transporters, notably GLUT1, GLUT 3, and GLUT4 for 13C-DHA, which have also been implicated in 18F-FDG uptake. 18F-FDG is phosphorylated by hexokinase to form charged, trapped adduct, whereas 13C-DHA (neutral molecule) is reduced to [1-13C] vitamin C, negatively charged at physiologic pH. In contrast, extracellular [1-13C]vitamin C enters cells by SVCT1 and SVCT2 transporters. 13C-VitC = [1-13C]vitamin C.
GLUT1 expression has been poorly characterized in prostate cancer, with a recent study finding the transporter immunohistochemically undetectable in 28 human specimens (27). This feature, as well as the urinary excretion of radiotracer, may explain the limited clinical utility of 18F-FDG PET in prostate tumors. GLUT transport has also not been characterized in the TRAMP murine model. The aim of this study was to compare the ability of 18F-FDG PET and hyperpolarized 13C-DHA MRS to distinguish between cancer and benign tissue in a prostate cancer model. In addition, we explored some of the possible mechanisms involved in the contrast obtained, including both transport and redox components known to mediate dehydroascorbate reduction in vivo.
MATERIALS AND METHODS
Hyperpolarized 13C-DHA MRS Studies
All animal experiments were conducted under approved protocols in accordance with the guidelines of the University of California, San Francisco, Institutional Animal Care and Use Committee. Mice (n = 4) were kept fasting for at least 6 h before image acquisition. A 2.2 M solution of 13C-DHA (prepared as previously described) in dimethyacetamide containing 15 mM OX063 trityl radical (Oxford Instruments) was hyperpolarized on a HyperSense DNP instrument (Oxford Instruments) (19). The frozen sample was dissolved in distilled water containing 0.3 mM ethylenediaminetetraacetic acid. Imaging was performed using a 3-T MR scanner (GE Healthcare) equipped with the multinuclear spectroscopy hardware package. The radiofrequency coil used in these experiments was a dual-tuned 1H/13C coil with a quadrature 13C channel and a linear 1H channel. Before 13C-DHA studies, 3-plane T2-weighted images were acquired for anatomic localization (echo time, 100 ms; repetition time, 4 s; 6 averages) using a standard fast spin echo sequence. 13C-DHA MRS studies were performed at 6-mm isotropic resolution, as previously published (19). In vivo 13C-DHA MRS data were processed using custom software written in IDL 8 (ITT Visual Information Solutions) and Matlab 2009b (MathWorks). The peak heights of 13C-DHA and vitamin C resonances were used to calculate relevant ratios. The reduction of hyperpolarized 13C-DHA to vitamin C was expressed by the metabolite ratio (vitamin C/[vitamin C + 13C-DHA]) for a given voxel that corresponded either to tumor or to surrounding normal tissue (predominantly muscle). Voxels were assigned to a given tissue type if more than 70% of a given voxel corresponded to the tissue of interest as validated by the corresponding T2-weighted image.
Small-Animal 18F-FDG PET/CT Scanning
A small-animal PET/CT scanner (Inveon; Siemens Medical Solutions) was used for imaging. The TRAMP mice (n = 4) used for the subsequent hyperpolarized 13C-DHA MRS study were kept fasting for at least 6 h before image acquisition. A heating pad at 37°C was used to dilate the tail vein for injection and to keep the animal warm. Fifty-five minutes after a tail vein injection of 5.55–7.4 MBq (150–200 μCi) of 18F-FDG in 100 μL of phosphate-buffered saline, a 600-s PET scan was acquired in a single frame under isoflurane and oxygen anesthesia. CT images were acquired in 120 projections of continuous rotation to cover 220°, with the x-ray tube operating at 80 kVp and 0.5 mA and with a 175-ms exposure time. CT images were created using a cone-beam Feldkamp reconstruction algorithm provided by Exxim Computing Corp. The matrix size of the reconstructed CT images was 512 × 512 × 662, with an isotropic voxel size of 0.19 × 0.19 × 0.19 mm. PET images were reconstructed with CT-based attenuation using a manufacturer-provided ordered-subsets expectation maximization algorithm resulting in a 128 × 128 × 159 matrix with a voxel size of 0.776 × 0.776 × 0.796 mm. Using open-source AMIDE software (28), freehand 3-dimensional regions of interest (ROIs) were manually drawn around the prostate tumor and the thigh muscles. The mean activities were recorded for each region of interest, and the standardized uptake value was calculated by multiplying the region-of-interest activity by the mouse weight divided by the injected dose.
Mercury Orange Staining and Fluorescent Microscopy
Eight-micrometer tissue sections from TRAMP tumor (n = 4) and normal murine prostate (n = 4) were immersed in and rinsed with 50 μM mercury orange in toluene for 4 min and then mounted. Slides were viewed by dark-field, phase-contrast transmission fluorescence on an Eclipse Ti microscope (Nikon) with an excitation frequency of 450–490 nm and an emission filter barrier frequency of 600 nm. Mean fluorescent intensity was measured in 3 separate fields and averaged using NIS-Elements software (Nikon). Hematoxylin and eosin staining was also performed on tissue sections from TRAMP tumors studied by diffusion-weighted MR at 14 T.
Glutathione Measurements
TRAMP and normal prostate tissues were homogenized in phosphate-buffered saline with ethylenediaminetetraacetic acid. Protein was precipitated with 10% metaphosphoric acid, and glutathione concentrations were assayed spectrophotometrically using a commercially available 5,5′-dithio-bis-2-(nitrobenzoic acid)–based absorbance assay (Cayman).
Real-Time Polymerase Chain Reaction (PCR)
Total RNA was isolated from frozen tissue extracts of TRAMP tumor (n = 4) and normal murine prostate (n = 4) using the TriPure Isolation Reagent (Roche) and reverse transcribed using Superscript III Reverse Transcriptase (Invitrogen) according to the manufacturer’s instructions. PCR primers were obtained from Applied Biosciences (Life Technologies), and real-time PCR determination of complementary DNA amounts was performed. Relative expression to control gene cyclophilin was determined using the ΔCt method.
Immunohistochemistry
Antimouse GLUT1 polyclonal antibodies were obtained from Santa Cruz Biotechnologies. Percentage staining was visually evaluated by 2 independent observers.
Statistical Analysis
A Student t test assessed differences between the tissue of the 2 groups using the statistical software package JMP (SAS Institute). All values are reported as mean ± SE. A P value of less than 0.05 was considered statistically significant.
RESULTS
In Vivo Hyperpolarized 13C-DHA MRS and 18F-FDG PET Studies
Hyperpolarized 13C-DHA MRS and 18F-FDG PET studies were performed on 4 tumor-bearing TRAMP mice. Since 18F-FDG is administered at tracer concentrations, the PET studies were conducted first, with MRS following within 24 h. In all cases, the mice were kept fasting for more than 6 h to mimic the typical preparation for human studies. The results are summarized in Figure 3. A typical small-animal PET/CT image of the TRAMP model is shown in the coronal plane (Fig. 3A), with increased 18F-FDG uptake observed within tumor and the highest activity observed in the bladder (displaced superiorly). In Figures 3B and 3D, 13C-DHA MRS data are overlaid with a T2-weighted 1H image in the same animal, showing increased conversion of hyperpolarized 13C-DHA to vitamin C within tumor. A typical spectrum (highlighted) shows both 13C-DHA and vitamin C resonances used to calculate the metabolite ratio. Figure 3C compares the average standardized uptake value of TRAMP tumor with that of adjacent muscle, representing a 3.0-fold difference. Figure 3D compares the average metabolite ratio for TRAMP tumor with that of surrounding tissues. The average metabolite ratio was 0.28 ± 0.02 in TRAMP tumor, versus 0.11 ± 0.02 in surrounding benign tissues (predominantly muscle), representing a 2.5-fold difference.
FIGURE 3.
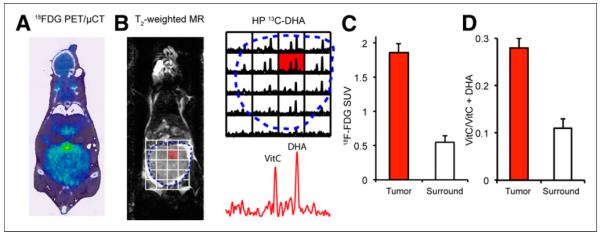
(A) Small-animal PET/CT image of TRAMP mouse in coronal plane after administration of 18F-FDG. Margins of tumor are depicted by dotted line. Tumor demonstrates diffuse uptake whereas intense signal is seen in bladder, displaced superiorly. (B) T2-weighted coronal MR image of same TRAMP mouse, with overlaid spectra from 13C-DHA MRS study performed after injection of hyperpolarized 13C-DHA. Significantly higher hyperpolarized vitamin C resonances are seen in voxels corresponding to tumor than in those corresponding to surrounding tissues. (C) Calculated standardized uptake values for TRAMP tumor relative to adjacent muscles, corresponding to 3-fold difference. (D) Relative metabolite ratios between TRAMP tumor and surrounding benign voxels, demonstrating increased conversion to vitamin C (2.5-fold difference). HP = hyperpolarized; PET/μCT = small-animal PET/CT; SUV = standardized uptake value; VitC = vitamin C.
Glutathione Studies
Our hypothesis is that the observed in vivo reduction of hyperpolarized 13C-DHA reflects, in part, the concentration of reduced glutathione, and our previous study found a higher rate of hyperpolarized 13C-DHA reduction in TRAMP tumor than in normal prostate tissue. To test this hypothesis, we assayed both TRAMP tumor (n = 4) and normal prostate (n = 4) for glutathione concentrations using an enzymatic recycling method (29). Both total glutathione (glutathione + GSSG) and reduced glutathione concentrations were calculated. In addition, TRAMP tumor and normal prostate were sectioned and stained with mercury orange, a thiol stain that predominantly reacts with glutathione (30). Fluorescent microscopy of the stained tissue sections was performed, with quantification of the fluorescence intensities. The results are summarized in Figure 4. Figure 4A shows the structure of reduced glutathione, the critical determinant of the redox capacity of the cell. The total glutathione was 5.1 ± 0.4 mM in tumor and 1.0 ± 0.2 mM in normal prostate, whereas reduced glutathione was 2.0 ± 0.3 mM and 0.8 ± 0.3 mM, respectively, corresponding to a 2.5-fold difference (Fig. 4B). Increased thiol staining using mercury orange is visually apparent in TRAMP tumor, confirmed by fluorescence quantification (Fig. 4C). These results indicate that both the total glutathione pool size and glutathione are markedly elevated in TRAMP tumor relative to normal prostate.
FIGURE 4.
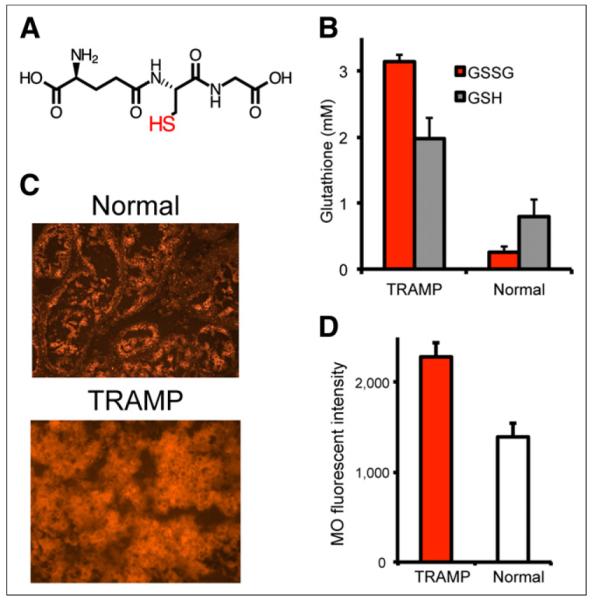
Glutathione levels in TRAMP tumor vs. normal prostate. (A) Chemical structure of reduced glutathione. (B) Calculated glutathione and GSSG (oxidized glutathione) concentrations using spectrophotometric assay. Concentrations of total glutathione (glutathione + GSSG) and glutathione are markedly elevated in TRAMP, although glutathione-to-GSSG ratio is much higher. (C and D) Mercury orange staining in TRAMP shows increased thiol staining, with higher calculated mean fluorescence intensities. GSH = glutathione; MO = mercury orange.
Transporter Expression
To investigate the role of transporter expression on hyperpolarized 13C-DHA reduction and 18F-FDG accumulation in TRAMP tumor, real-time PCR studies were used to study GLUT1, GLUT3, GLUT4, SVCT1, and SVCT2 messenger RNA transcripts (31). In addition, immunohistochemistry was performed using GLUT1 polyclonal antibodies since the role of this transporter in 13C-DHA and 18F-FDG uptake has been best established. As discussed previously, 13C-DHA is transported via GLUT1, GLUT3, and GLUT4 whereas its reduced counterpart vitamin C enters cells via the SVCT1 and SVCT2 Na+-dependent cotransporters. 18F-FDG studies have also found significant correlations between in vivo tracer accumulation and the expression of GLUT1, GLUT3, and GLUT4 in human cancers (32–34). The results of real-time PCR analysis are shown in Figure 5 for both TRAMP tumor (n = 4) and normal murine prostate (n = 4). The expression of the 5 transporters is shown relative to the control gene cyclophilin. The expression of GLUT3 and SVCT2 was significantly higher for TRAMP tumor than for normal murine prostate (P = 0.03 and 0.002, respectively). In contrast, the expression of GLUT1 and GLUT4 was not significantly different. SVCT1 expression was not observed in either TRAMP tumor or normal prostate. Figure 5B shows a typical result obtained for anti-GLUT1 immunohistochemistry studies, with similar staining observed between TRAMP tumor and normal prostate.
FIGURE 5.

Transporter expression in TRAMP vs. normal prostate. (A) Messenger RNA transcripts corresponding to relevant transporters GLUT1, GLUT3, GLUT4, SVCT1, and SVCT2 were evaluated by real-time PCR. Although GLUT3 and SVCT2 expression was significantly increased in TRAMP, GLUT1 and GLUT4 expression was not significantly different, and SVCT1 was not detected. (B) Immunohistochemical staining using anti-GLUT1 antibodies demonstrates similar degree of staining.
DISCUSSION
In the evaluation of prostate cancer, 18F-FDG has significant limitations because it is excreted in the urine. Clinical 18F-FDG PET scans typically take place after a significant delay (45 min to 1.5 h) during which radiotracer accumulates in the bladder, making examination of the prostate difficult. In addition, low levels of 18F-FDG accumulation by prostate tumors may reflect low expression of GLUT1, the glucose transporter isoform most closely linked to 18F-FDG activity. In this study, we used the new 13C probe hyperpolarized 13C-DHA, which shares an uptake mechanism with 18F-FDG via the glucose transporter. One potential benefit of hyperpolarized 13C-DHA MRS, in the context of prostate and renal tumors, is that imaging typically takes place within 1–2 min after agent injection, thus avoiding the excretory phase of contrast. The first 13C MR study in humans, using 13C-pyruvate, demonstrated the benefit of early imaging and showed differences in 13C-lactate generation between tumor and normal prostate (18). We developed hyperpolarized 13C-DHA to further investigate redox changes in prostate cancers that potentially render them more resistant to radiotherapy, especially the accumulation of glutathione, which is a response to oxidative stress. In the TRAMP murine model, both hyperpolarized 13C-DHA and 18F-FDG resulted in significant contrast between tumor and surrounding benign tissue, with a similar contrast-to-noise ratio obtained for hyperpolarized 13C-DHA. However, in its present incarnation hyperpolarized 13C-DHA MRS is limited by signal-to-noise ratio, and the obtained spatial resolution (6 mm isotropic) is lower than that obtained for 18F-FDG. Future studies will focus on improving spatial resolution via several methods, including increased polarization and K-space undersampling (35).
We believe that the contrast obtained using hyperpolarized 13C-DHA most closely correlates with the increased glutathione concentration in TRAMP tumor and the redox machinery involved in maintaining glutathione. Consistent with this hypothesis, the reduction rate of hyperpolarized 13C-DHA to vitamin C in vitro has been shown to correlate with the concentration of reducing agent, both for glutathione and for the water-soluble reducing agent sodium cyanoborohydride (19,36). As previously noted, these in vitro reduction rates are too slow to account for the hyperpolarized vitamin C signal observed in vivo. One interpretation of these results is that the hyperpolarized 13C-DHA reduction rate in TRAMP tumor depends both on glutathione concentration and on the expression of key enzymes related to 13C-DHA reduction (e.g., glutaredoxin) and glutathione regeneration (e.g., glutathione reductase). Additional work is needed to elucidate the roles of these redox components in hyperpolarized 13C-DHA reduction in the TRAMP model. For TRAMP tumor, we found the concentration of total glutathione (and glutathione) to be significantly increased relative to normal prostate. Interestingly, in TRAMP tumor, the glutathione-to-GSSG ratio was markedly increased, suggesting a more oxidized redox state (37) that likely reflects long-standing oxidative stress. Therefore, it appears that hyperpolarized 13C-DHA primarily detects redox capacity, determined by the concentration of glutathione (elevated 2.5-fold in TRAMP tumor) and the cell’s ability to regenerate it. Future studies will focus on whether elevated glutathione in prostate tumors (reflected by in vivo hyperpolarized 13C-DHA reduction) confers resistance to radiotherapy, and the effect of radiosensitizing agents on both glutathione concentration and therapeutic outcomes.
The role of transporter expression on hyperpolarized 13C-DHA conversion and 18F-FDG accumulation in prostate tumors (both human and TRAMP) warrants future investigation. In this study, we focused on the glucose transporter isoforms GLUT1, GLUT3, and GLUT4 since these are principally responsible for 13C-DHA uptake. With respect to the transport of 18F-FDG, GLUT1 has been most broadly studied, but many isoforms are implicated. It is likely that both hyperpolarized 13C-DHA and 18F-FDG enter cells via the same transporters in the TRAMP model, but since both probes differ structurally from glucose, their relative affinity for GLUT isoforms may not be the same. Our experiments suggest that neither real-time PCR nor immunohistochemical methods show significant overexpression of GLUT1 in the TRAMP model. However, we observed increased expression of GLUT3 in TRAMP tumor relative to normal prostate, and this increase may partially account for the tumor contrast observed using hyperpolarized 13C-DHA and 18F-FDG. The increase in expression of GLUT3 was small relative to overall expression of GLUT1. It is also possible that increased hexokinase activity would result in increased trapping of 18F-FDG in TRAMP cells. Future studies will focus on teasing out whether there is a relationship between hexokinase expression and 18F-FDG uptake. Elevated SVCT2 transporter expression is also an unlikely correlate for in vivo hyperpolarized 13C-DHA results given what is known about 13C-DHA uptake and metabolism.
CONCLUSION
Hyperpolarized 13C-DHA MRS can provide significant information complementary to 18F-FDG PET in the evaluation of prostate cancer, and the results of the first human hyperpolarized 13C-pyruvate trial were promising. Although hyperpolarized 13C-pyruvate probes the carbon flux through lactate dehydrogenase, a hallmark of the Warburg phenotype, hyperpolarized 13C-DHA was designed to investigate an entirely different mechanism whereby advanced tumors accumulate antioxidants (in particular glutathione). Our study suggests that hyperpolarized 13C-DHA reduction in TRAMP tumor does correlate strongly with glutathione concentration, although transporters (other than GLUT1) and the enzymes that mediate its reduction may also play a role.
Acknowledgments
This work was supported by the National Institutes of Health (grants R01 CA166766, R21 CA171766, K99 EB014328, P41 EB013598, and RSNA RSD1014)
Footnotes
DISCLOSURE No other potential conflict of interest relevant to this article was reported.
REFERENCES
- 1.Siegel R, Naishadham D, Jemal A. Cancer statistics, 2012. CA Cancer J Clin. 2012;62:10–29. doi: 10.3322/caac.20138. [DOI] [PubMed] [Google Scholar]
- 2.Al-Mamgani A, Lebesque JV, Heemsbergen WD, et al. Controversies in the treatment of high-risk prostate cancer: what is the optimal combination of hormonal therapy and radiotherapy: a review of literature. Prostate. 2010;70:701–709. doi: 10.1002/pros.21102. [DOI] [PubMed] [Google Scholar]
- 3.Nichol A, Chung P, Lockwood G, et al. A phase II study of localized prostate cancer treated to 75.6 Gy with 3D conformal radiotherapy. Radiother Oncol. 2005;76:11–17. doi: 10.1016/j.radonc.2005.06.002. [DOI] [PubMed] [Google Scholar]
- 4.Mahdy AE, Cheng JC, Li J, et al. Acid ceramidase upregulation in prostate cancer cells confers resistance to radiation: AC inhibition, a potential radiosensitizer. Mol Ther. 2009;17:430–438. doi: 10.1038/mt.2008.281. [DOI] [PMC free article] [PubMed] [Google Scholar]
- 5.Kong Z, Xie D, Boike T, et al. Downregulation of human DAB2IP gene expression in prostate cancer cells results in resistance to ionizing radiation. Cancer Res. 2010;70:2829–2839. doi: 10.1158/0008-5472.CAN-09-2919. [DOI] [PubMed] [Google Scholar]
- 6.Lu JP, Monardo L, Bryskin I, et al. Androgens induce oxidative stress and radiation resistance in prostate cancer cells though NADPH oxidase. Prostate Cancer Prostatic Dis. 2010;13:39–46. doi: 10.1038/pcan.2009.24. [DOI] [PMC free article] [PubMed] [Google Scholar]
- 7.Sun Y, St Clair DK, Xu Y, Crooks PA, St Clair WH. A NADPH oxidase-dependent redox signaling pathway mediates the selective radiosensitization effect of parthenolide in prostate cancer cells. Cancer Res. 2010;70:2880–2890. doi: 10.1158/0008-5472.CAN-09-4572. [DOI] [PMC free article] [PubMed] [Google Scholar]
- 8.Husbeck B, Peehl DM, Knox SJ. Redox modulation of human prostate carcinoma cells by selenite increases radiation-induced cell killing. Free Radic Biol Med. 2005;38:50–57. doi: 10.1016/j.freeradbiomed.2004.09.022. [DOI] [PubMed] [Google Scholar]
- 9.Sainz RM, Reiter RJ, Tan DX, et al. Critical role of glutathione in melatonin enhancement of tumor necrosis factor and ionizing radiation-induced apoptosis in prostate cancer cells in vitro. J Pineal Res. 2008;45:258–270. doi: 10.1111/j.1600-079X.2008.00585.x. [DOI] [PubMed] [Google Scholar]
- 10.Husbeck B, Nonn L, Peehl DM, Knox SJ. Tumor-selective killing by selenite in patient-matched pairs of normal and malignant prostate cells. Prostate. 2006;66:218–225. doi: 10.1002/pros.20337. [DOI] [PubMed] [Google Scholar]
- 11.Guzman ML, Li X, Corbett CA, et al. Rapid and selective death of leukemia stem and progenitor cells induced by the compound 4-benzyl, 2-methyl, 1,2,4-thiadiazolidine, 3,5 dione (TDZD-8) Blood. 2007;110:4436–4444. doi: 10.1182/blood-2007-05-088815. [DOI] [PMC free article] [PubMed] [Google Scholar]
- 12.Borghini M. Spin-temperature model of nuclear dynamic polarization using free radicals. Phys Rev Lett. 1968;20:419. [Google Scholar]
- 13.Deboer W, Borghini M, Morimoto K, Niinikos TO, Udo F. Sizeable pure tensor polarization of deuterons in a solid. Phys Lett A. 1973;A-46:143–144. [Google Scholar]
- 14.Abragam A, Goldman M. Principles of dynamic nuclear-polarization. Rep Prog Phys. 1978;41:395–467. [Google Scholar]
- 15.Ardenkjaer-Larsen JH, Fridlund B, Gram A, et al. Increase in signal-to-noise ratio of > 10,000 times in liquid-state NMR. Proc Natl Acad Sci USA. 2003;100:10158–10163. doi: 10.1073/pnas.1733835100. [DOI] [PMC free article] [PubMed] [Google Scholar]
- 16.Golman K, Ardenkjaer-Larsen JH, Petersson JS, Mansson S, Leunbach I. Molecular imaging with endogenous substances. Proc Natl Acad Sci USA. 2003;100:10435–10439. doi: 10.1073/pnas.1733836100. [DOI] [PMC free article] [PubMed] [Google Scholar]
- 17.Albers MJ, Bok R, Chen AP, et al. Hyperpolarized 13C lactate, pyruvate, and alanine: noninvasive biomarkers for prostate cancer detection and grading. Cancer Res. 2008;68:8607–8615. doi: 10.1158/0008-5472.CAN-08-0749. [DOI] [PMC free article] [PubMed] [Google Scholar]
- 18.Kurhanewicz J, Vigneron DB, Brindle K, et al. Analysis of cancer metabolism by imaging hyperpolarized nuclei: prospects for translation to clinical research. Neoplasia. 2011;13:81–97. doi: 10.1593/neo.101102. [DOI] [PMC free article] [PubMed] [Google Scholar]
- 19.Keshari KR, Kurhanewicz J, Bok R, Larson PE, Vigneron DB, Wilson DM. Hyperpolarized 13C dehydroascorbate as an endogenous redox sensor for in vivo metabolic imaging. Proc Natl Acad Sci USA. 2011;108:18606–18611. doi: 10.1073/pnas.1106920108. [DOI] [PMC free article] [PubMed] [Google Scholar]
- 20.Liang WJ, Johnson D, Jarvis SM. Vitamin C transport systems of mammalian cells. Mol Membr Biol. 2001;18:87–95. doi: 10.1080/09687680110033774. [DOI] [PubMed] [Google Scholar]
- 21.Aloj L, Caraco C, Jagoda E, Eckelman WC, Neumann RD. Glut-1 and hexokinase expression: relationship with 2-fluoro-2-deoxy-D-glucose uptake in A431 and T47D cells in culture. Cancer Res. 1999;59:4709–4714. [PubMed] [Google Scholar]
- 22.Medina RA, Owen GI. Glucose transporters: expression, regulation and cancer. Biol Res. 2002;35:9–26. doi: 10.4067/s0716-97602002000100004. [DOI] [PubMed] [Google Scholar]
- 23.Higashi K, Ueda Y, Sakurai A, et al. Correlation of Glut-1 glucose transporter expression with. Eur J Nucl Med. 2000;27:1778–1785. [PubMed] [Google Scholar]
- 24.Bos R, van Der Hoeven JJ, van Der Wall E, et al. Biologic correlates of 18fluorodeoxyglucose uptake in human breast cancer measured by positron emission tomography. J Clin Oncol. 2002;20:379–387. doi: 10.1200/JCO.2002.20.2.379. [DOI] [PubMed] [Google Scholar]
- 25.Haber RS, Rathan A, Weiser KR, et al. GLUT1 glucose transporter expression in colorectal carcinoma: a marker for poor prognosis. Cancer. 1998;83:34–40. doi: 10.1002/(sici)1097-0142(19980701)83:1<34::aid-cncr5>3.0.co;2-e. [DOI] [PubMed] [Google Scholar]
- 26.Ung YC, Maziak DE, Vanderveen JA, et al. 18Fluorodeoxyglucose positron emission tomography in the diagnosis and staging of lung cancer: a systematic review. J Natl Cancer Inst. 2007;99:1753–1767. doi: 10.1093/jnci/djm232. [DOI] [PubMed] [Google Scholar]
- 27.Reinicke K, Sotomayor P, Cisterna P, Delgado C, Nualart F, Godoy A. Cellular distribution of Glut-1 and Glut-5 in benign and malignant human prostate tissue. J Cell Biochem. 2012;113:553–562. doi: 10.1002/jcb.23379. [DOI] [PubMed] [Google Scholar]
- 28.Loening AM, Gambhir SS. AMIDE: a free software tool for multimodality medical image analysis. Mol Imaging. 2003;2:131–137. doi: 10.1162/15353500200303133. [DOI] [PubMed] [Google Scholar]
- 29.Rahman I, Kode A, Biswas SK. Assay for quantitative determination of glutathione and glutathione disulfide levels using enzymatic recycling method. Nat Protoc. 2006;1:3159–3165. doi: 10.1038/nprot.2006.378. [DOI] [PubMed] [Google Scholar]
- 30.Vukovic V, Nicklee T, Hedley DW. Microregional heterogeneity of non-protein thiols in cervical carcinomas assessed by combined use of HPLC and fluorescence image analysis. Clin Cancer Res. 2000;6:1826–1832. [PubMed] [Google Scholar]
- 31.Lao K, Xu NL, Sun YA, Livak KJ, Straus NA. Real time PCR profiling of 330 human micro-RNAs. Biotechnol J. 2007;2:33–35. doi: 10.1002/biot.200600119. [DOI] [PubMed] [Google Scholar]
- 32.Kaira K, Endo M, Abe M, et al. Biologic correlates of 18F-FDG uptake on PET in pulmonary pleomorphic carcinoma. Lung Cancer. 2011;71:144–150. doi: 10.1016/j.lungcan.2010.05.021. [DOI] [PubMed] [Google Scholar]
- 33.McBrayer SK, Cheng JC, Singhal S, Krett NL, Rosen ST, Shanmugam M. Multiple myeloma exhibits novel dependence on GLUT4, GLUT8, and GLUT11: implications for glucose transporter-directed therapy. Blood. 2012;119:4686–4697. doi: 10.1182/blood-2011-09-377846. [DOI] [PMC free article] [PubMed] [Google Scholar]
- 34.Avril N. GLUT1 expression in tissue and 18F-FDG uptake. J Nucl Med. 2004;45:930–932. [PubMed] [Google Scholar]
- 35.Leupold J, Mansson S, Petersson JS, Hennig J, Wieben O. Fast multiecho balanced SSFP metabolite mapping of 1H and hyperpolarized 13C compounds. MAGMA. 2009;22:251–256. doi: 10.1007/s10334-009-0169-z. [DOI] [PubMed] [Google Scholar]
- 36.Bohndiek SE, Kettunen MI, Hu DE, et al. Hyperpolarized [1-13C]-ascorbic and dehydroascorbic acid: vitamin C as a probe for imaging redox status in vivo. J Am Chem Soc. 2011;133:11795–11801. doi: 10.1021/ja2045925. [DOI] [PMC free article] [PubMed] [Google Scholar]
- 37.Schafer FQ, Buettner GR. Redox environment of the cell as viewed through the redox state of the glutathione disulfide/glutathione couple. Free Radic Biol Med. 2001;30:1191–1212. doi: 10.1016/s0891-5849(01)00480-4. [DOI] [PubMed] [Google Scholar]