

Background: TasA is an extracellular matrix protein that makes amyloid-like fibers in Bacillus subtilis biofilms.
Results: An isolated TasA matrix precursor self-assembled in vitro into fibers on hydrophobic surfaces and in acidic solutions.
Conclusion: TasA is purified as stable, structured oligomers that aggregate in response to simple physical external cues.
Significance: TasA aggregation principles can be used to design new anti-biofilm drugs and surfaces.
Keywords: Amyloid Precursor Protein, Bacillus, Biofilm, Extracellular Matrix, Extracellular Matrix Proteins, Microbiology, Protein Aggregation
Abstract
Biofilms are surface-associated groups of microbial cells that are embedded in an extracellular matrix (ECM). The ECM is a network of biopolymers, mainly polysaccharides, proteins, and nucleic acids. ECM proteins serve a variety of structural roles and often form amyloid-like fibers. Despite the extensive study of the formation of amyloid fibers from their constituent subunits in humans, much less is known about the assembly of bacterial functional amyloid-like precursors into fibers. Using dynamic light scattering, atomic force microscopy, circular dichroism, and infrared spectroscopy, we show that our unique purification method of a Bacillus subtilis major matrix protein component results in stable oligomers that retain their native α-helical structure. The stability of these oligomers enabled us to control the external conditions that triggered their aggregation. In particular, we show that stretched fibers are formed on a hydrophobic surface, whereas plaque-like aggregates are formed in solution under acidic pH conditions. TasA is also shown to change conformation upon aggregation and gain some β-sheet structure. Our studies of the aggregation of a bacterial matrix protein from its subunits shed new light on assembly processes of the ECM within bacterial biofilms.
Introduction
Biofilms are surface-associated communities of microbial cells. They originate from individual cells that, upon encountering a suitable environment, form multicellular communities that are encased in self-produced extracellular matrix (ECM).3 The ECM is a network of biopolymers, mainly polysaccharides, proteins, and nucleic acids that comprises >90% of the dry weight of biofilms (1). In addition to acting as intercellular glue, the ECM protects cells within a biofilm from antibiotics (1, 2), provides mechanical stability to biofilms (3, 4), affects the hydrophobicity of the biofilm (5, 6), and mediates cell adhesion to surfaces (1).
ECM proteins in bacteria serve a variety of structural roles and often form fibrous appendages. These include adhesive fimbriae, type IV pili, and flagella (which are also used for motility), and proteins that form amyloid-like proteins such as curli (7) (produced by Escherichia coli), phenol soluble modulins (8) (produced by Staphylococcus aureus), FapC (9) (produced by Pseudomonas aeruginosa), and TasA (10–12) (produced by Bacillus subtilis). The assembly of the bacterial amyloid-like fibers is important for the integrity of biofilms, yet little is known about this process at the molecular level (13, 14).
Curli is the most studied bacterial amyloid (7, 15, 16). Curli fibers are composed of a major and minor subunit, CsgA and CsgB, respectively. Their assembly involves four accessory proteins, CsgC, CsgE, CsgF, and CsgG. CsgG forms a pore in the outer membrane through which the curli proteins are secreted. CsgE acts as a chaperone for CsgA and helps prevent CsgA polymerization in vitro, whereas CsgF is required for CsgB surface exposure and aggregation of CsgA (17). CsgA is commonly purified from inclusion bodies in E. coli cells under denaturing conditions, resulting in unstructured CsgA monomers that aggregate spontaneously upon removal of the denaturant (16).
Similarly to curli, the amyloid-like fibers produced by B. subtilis are also composed of two components: the major subunit TasA and a minor subunit TapA (18). These proteins are encoded in an operon with a third gene, sipW, which encodes the signal peptidase responsible for processing and secretion of TasA and TapA. There are no other accessory proteins analogous to the Csg system, possibly because in B. subtilis there is no outer membrane that must be crossed prior to fiber assembly. Both TasA and TapA are present in purified biofilm matrix protein preparations that have been extracted from the cell surface (18). When these matrix protein preparations were analyzed on an electron microscopy (EM) grid, fibers were observed. In addition, fibers that labeled with anti-TasA antibody connected cells within a biofilm (12).
Here, using dynamic light scattering (DLS) and atomic force microscopy (AFM) we show that B. subtilis matrix protein preparations are not purified in the form of fibers. Rather, these preparations contain oligomers that do not spontaneously aggregate in solution. In contrast to the purification methods described for most amyloid precursors, we did not purify the protein from inclusion bodies, and therefore our preparations resulted in a nondenatured, α-helical, and stable protein. Because these oligomers did not aggregate spontaneously in solution, we were able to determine which external cues gave rise to protein aggregation into fibrous structures where the constituent protein gained in β-sheet content. In particular, we show that hydrophobic (but not hydrophilic) surfaces, as well as acidic solution conditions, trigger the oligomers to form fibers.
EXPERIMENTAL PROCEDURES
TasA Purification
TasA was purified as described previously (12). Cells from a sinR eps double mutant of B. subtilis (ZK4363) were grown in MSgg broth (11) under shaking conditions. By choosing to work with cells that lack their eps genes, we ensured the lack of the exopolysaccharide component in our preparations. At the same time, the cells produced more TasA than the wild-type strain because they were also mutated in their sinR gene, which encodes a repressor of tasA transcription (19). After 20 h of growth at 37 °C the cells were pelleted (10,000 × g, 15 min) and extracted once with a saline extraction buffer as described previously (12). The supernatant was then collected after an additional centrifugation (10,000 × g, 15 min) and filtered through a 0.4-μm PolyEtherSulfone (PES) bottle-top filter. To precipitate less soluble proteins we added ammonium sulfate (ground into a fine powder) to 30% (w/v) saturation. The supernatant was collected after centrifugation (20,000 × g, 10 min), concentrated with Amicon centrifugal filter tubes and passed through a HiLoad 26/60 Superdex S200 sizing column that was preequilibrated with a 50 mm NaCl, 20 mm Tris solution at pH 8. TasA eluted in the void volume and concentrated with Amicon centrifugal filter tubes. We have shown previously that following this protein purification protocol, TasA is purified with some TapA (18). We nevertheless refer to the purified protein as TasA because the TapA fraction was below the detection limits of the Edman degradation analysis.
Atomic Force Microscopy
We show the height-field AFM images of TasA adsorbed on the different surfaces (see sample preparation below). We used an Asylum SPM with AC mode for high resolution visualization of the protein on the surfaces. Probes were etched silicon (NSC18, 75 kHz, 3.5 N/m) from MikroMasch. We used the freeware Gwyddiion to analyze AFM images unless otherwise specified.
Sample Preparation for AFM
Preparation of Hydrophobic Surfaces
Silicon wafers (University Wafers, 3″, p-type, test grade) were cut to 5 × 5-mm pieces and cleaned by boiling in toluene and ethanol. The surfaces were further cleaned with an oxygen plasma for 10 min and immersed immediately in a 0.4 mm trichloro(octyl)silane (OTS) (97%; Sigma-Aldrich) solution in toluene for 40 min. After rinsing with toluene and subsequently immersing for 10–30 min in toluene the surfaces came out dry and were further purged in a stream of nitrogen.
Hydrophilic Surfaces
We used freshly cleaved mica (Grade I; S&J Trading Inc., New York). The surface of freshly cleaved mica is clean, atomically smooth, and hydrophilic.
TasA Adsorption on Surfaces
A 3–5-μl drop of TasA (5 μm in 50 mm NaCl, 20 mm Tris, pH 8) was placed on the relevant (hydrophobic or hydrophilic) surface for a period of 2 h. To prevent water evaporation, we kept the surfaces in a humid, sealed, container throughout the adsorption process. The surfaces were then immersed in aqueous solutions: phosphate-buffered saline (PBS) and deionized water, under shaking conditions for a period of 10 and 20 min, respectively. The surfaces were taken out of the deionized water container and allowed to dry in ambient air.
Dynamic Light Scattering
DLS measurements were performed with an ALV system, equipped with an ALV/SP-125 goniometer and an AVL-5000 correlator excited with a Coherent Verdi 2W laser (532 nm) running at 0.2–0.4 watts. Measurements were performed by focusing a vertically polarized light onto the sample and collecting the scattered light with a detector at 90 °C. We used the CUMULANTS method (20) to analyze the normalized intensity correlation function and extract an average decay rate, Γav. A translational diffusion coefficient Deff was then calculated using the equation
where q is a wave vector, q = (4π n/λ) sin (θ/2), n is the refractive index of the medium, λ is the laser wavelength, and θ is the scattering angle. Finally, we used the Stokes-Einstein relation to calculate the average hydrodynamic radius,
where KB is the Boltzmann constant, T is the absolute temperature, η is the viscosity of the medium at a given temperature, and Deff is the particle effective diffusion constant. Scattering of a TasA (5 μm in 50 mm NaCl, 20 mm Tris, pH 8) solution was collected for 30–60 s at 30–60-s intervals with a count rate of (20–150) × 103 counts/s. The temperature was kept constant at 25 °C.
In the DLS experiments where we probed the growth of the protein with time after adjusting the solution pH to 2.5 (Fig. 6A) the protein concentration was 2 μm. To adjust the pH to 2.5 (Fig. 6A) we used formic acid, but similar results were obtained when we used hydrochloric acid. Aggregation is a concentration-dependent process and starting with a higher concentration resulted with larger aggregates that settle faster. At higher protein concentrations, lower pH, and times longer than 4 h we could not probe the growth of the aggregates due to their faster settling. To observe the aggregates that were formed after 3 h from the point when we adjusted the pH in solution, we placed a 3–5-μl droplet of the protein solution that we used for DLS on both hydrophobic or hydrophilic surfaces (described above). After 15–30 min the surface was rinsed with PBS and then water, for 10 and 20 min, respectively, and allowed to air dry prior to examining by AFM.
FIGURE 6.
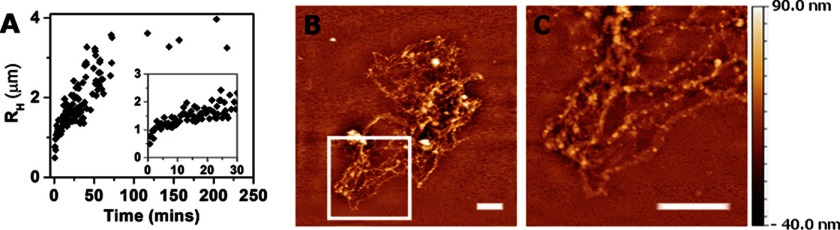
Aggregation of oligomers in solution at acidic pH. A, hydrodynamic radius, RH, as a function of time measured with DLS after the addition of formic acid and pH adjustment to 2.5. Inset, magnified view of the first 30 min. B, AFM image of a typical aggregate formed after 3 h at pH 2.5 in solution. C, enlarged view of boxed region in B. Scale bars, 2 μm.
Circular Dichroism (CD) Measurements
CD was measured with a JASCO apparatus both in 10-mm and 1-mm optical path cuvettes. Using the 10-mm cuvette enabled us to stir (at 270 rpm) the solution during the aggregation process so that signal was not lost due to settling of the aggregates. In balancing between the need to get a reasonable CD signal and the need to work in a concentration comparable with that used for DLS, we measured the CD spectra of 0.5–1 μm and 3–4 μm protein with cuvettes of 10- and 1-mm optical lengths, respectively. In addition, because Tris buffer gives a large background signal with CD measurements, we dialyzed the protein against 10 mm potassium phosphate buffer, pH 7.4, for these measurements. CD was measured at pH 7.4 and 3, with the latter obtained by adding concentrated formic acid. Because formic acid absorbs the light substantially in the UV range, we were limited to working at pH values higher than 3. Similar results were obtained when using hydrochloric acid and pH adjustment to 3 or 2.5.
The spectrum of SDS-treated TasA was performed in 10 mm sodium phosphate because the potassium salt of SDS is water-insoluble. Guanidine HCl (ultrapure, MP Biomedicals 99% min) was used as a denaturing agent.
Thioflavin T Fluorescence Measurements
TasA was mixed with a thioflavin T (ThT) stock solution (that was prepared in 50 mm NaCl, 20 mm Tris, pH 8) to a final concentration of 2–4 μm protein, 25 mm ThT. The final volume was 200 μl, and measurements were performed in 96-well plates with a clear bottom (Costar). We used a BMG LABTECH microplate reader equipped with fixed excitation/emission filter of 430/480 nm, respectively. Data were collected after adjusting the pH to 2.5 or at pH 8 (the latter served as the control experiment) every 2–5 min. The plate was shaking with an orbital mode between measurements. In the reported experiments we did not block the plates before use, but similar results were obtained with plates that were blocked with 2.5 mg/ml bovine serum albumin (BSA) prior to the addition of the protein solutions.
Fourier Transform Infrared (FTIR) Spectroscopy
We used a Bruker Tensor 27 FTIR spectrometer, equipped with a Germanium Attenuated Total Reflection module and a liquid N2-cooled MCT detector to measure the spectra of the protein monolayers on the surfaces. As a hydrophobic surface we used the OTS-hydrophobized silicon/silicon oxide surface, and the model hydrophilic surface was either freshly cleaved mica or pieces of a silicon wafer that was cleaned with oxygen plasma prior to protein adsorption. For each sample, 1000 interferograms were accumulated at a spectral resolution of 4 cm−1. The spectra of the protein-free surfaces were recorded under conditions identical to those of the protein/surface samples and subtracted from the protein spectra.
The spectra of the protein in aqueous solutions were recorded with a Bruker Alpha spectrometer in Absorbance mode. We used 0.3–0.5 mm protein solutions in phosphate buffer (pH 7.4), and hydrochloric acid was used to adjust the pH to 2.5. For each sample, 512 interferograms were accumulated at a spectral resolution of 4 cm−1. The spectra of the buffer were recorded under conditions identical to those of the protein samples and subtracted from the protein spectra. All spectra were scaled independently to a full scale on the ordinate axis. The first and second derivatives of the amide I band were calculated and used to identify maximum and the additional spectral components of the band, respectively.
Transmission Electron Microscopy
To prepare the samples we used carbon-coated grids that were placed on top of a 3–5-μl drop of TasA in 50 mm NaCl, 20 mm Tris, pH 8 (we used 2.5 μm because the fibers formed from a 5-μm solution formed a dense mesh of fibers, and single fibers could not be resolved from the images) for 1–5 min. The grid was floated briefly on a drop of water, and the excess liquid was blotted off on a filter paper (Whatman no. 1) and negatively stained with uranyl acetate (1–2% aqueous solution). The samples were dried and examined in a JEOL 1200EX transmission electron microscope at an accelerating voltage of 80 kV. Images were taken with an AMT 2k CCD camera.
Contact Angle Measurements
We used a ramé-hart goniometer to measure the contact angle of water on mica and on a silicon/silicon oxide surface modified with a monolayer of trichloro(octyl)silane.
Image Analysis
AFM images were passed through a threshold filter to filter the background (noise). This resulted in black and white images such as those in Fig. 5, A and B. The surface coverage of the protein was then calculated from such images where the protein appeared as white pixels on a black background. To separate the contribution of fibers and oligomers in the total surface coverage (such as in Fig. 5, D and E) we applied a Matlab particle analysis algorithm that sorts the particles in the images based on surface area. We chose an area corresponding to r = 30 nm as a cutoff below which the particles were considered to be oligomers. Particles with larger area were considered to be fibers.
FIGURE 5.

Image analysis of D and H from Fig. 4. A–C show a black and white form of images from Fig. 4, D and H, after a threshold was applied to discriminate background from features (A and B). Such images (three to five images per time point) were used to calculate the total surface coverage of the protein, and this is summarized for different time points in on hydrophobic and hydrophilic surfaces (circles and squares, respectively) (C). D and E show A separated into fibers (D) and oligomers (E). F, the relative coverage contribution of fibers (diamonds) or oligomers (triangles) was calculated over time on a hydrophobic surface. For more information on image analysis, see “Experimental Procedures.”
RESULTS
Matrix Protein Purification Yields Structured and Stable Oligomers in Solution
To analyze the assembly process of B. subtilis amyloid fibers, we purified the matrix protein from cells. We first used a solution containing 1 m sodium chloride to extract peripheral proteins that were electrostatically bound to the cells. After filtration and ammonium sulfate precipitation, the protein was purified by size exclusion chromatography (for a detailed purification protocol, see “Experimental Procedures”). A denaturing SDS-PAGE of the purified protein showed a single band stained with Coomassie Blue with an apparent molecular mass of about 30 kDa, as expected for TasA (Fig. 1A). In addition, LC-MS data showed a single peak of molecular mass 25,734.8, in line with the predicted molecular mass of TasA lacking its signal peptide (25,734.6). Finally, we used Edman degradation to determine the N-terminal sequence of the protein. The sequencing identified the expected start site of TasA lacking the 27-amino acid signal sequence that is processed by the dedicated signal sequence peptidase SipW (10, 11). No other sequences within the detection limit were present. Thus, based on three lines of evidence, our purification method yielded a reasonably homogeneous TasA protein preparation.
FIGURE 1.

Characterization of the purified matrix protein. A, SDS-PAGE of the protein preparations showing a single band approximately at 30 kDa. B, DLS analysis. Typical intensity autocorrelation functions calculated from the scattering of TasA at pH 8 (green line) and after the addition of 2% SDS (red line) are shown. The black solid lines are best fits of the data to the CUMULANTS expression (see “Experimental Procedures”). C, average hydrodynamic radius (RH, marked by a dashed line) and size distribution of the protein before (green histogram) and after adding 2% SDS (red histogram), calculated from the best fits to the plots in B. D–F, AFM of the protein adsorbed from a 5 μm solution on mica for 2 h (D and E) and 2 min (F). E is a magnified image of the boxed region in D. Scale bars, 200 nm.
We used DLS (20) to measure the size of the purified protein present in the solution to determine its appearance in solution as monomers (defined here as single polypeptide chains), oligomers or fibers. The green curve in Fig. 1B shows an intensity autocorrelation function calculated from the scattering of the protein in solution (50 mm NaCl, 20 mm Tris, pH 8). An average hydrodynamic radius, RH = 70 ± 10 nm was calculated from a best fit (black line) to the data in Fig. 1B with the CUMULANTS analysis (see “Experimental Procedures”). The average RH and the calculated distribution of particles around that average are shown in Fig. 1C in a green histogram.4 That we could fit a single exponential term to the green curve in Fig. 1B and the relatively tight distribution of sizes around the average suggests that the particles that scatter the light are relatively uniform and of low aspect ratio, which is not a characteristic of stretched fibers (20). This calculated radius was also significantly larger than that expected for a monomer. The radius of a monomer in solution can be approximated from the number of amino acids (n = 234 for TasA lacking its signal peptide) using the empirical relation RH = 4.75 × N0.29 Å (22) (typical for poor solvent conditions where R ∼ N1/3) (23). We approximated the hydrodynamic radius of a TasA monomer to be 2.3 nm for a natively folded chain and 4.9 nm for a highly denatured one.5 However, we could not rule out the presence of monomers in solution because when mixed with larger oligomers, their contribution to the scattering of light would be negligible (in light scattering measurements the scattering intensity scales with R6 (20)). We therefore complemented the DLS measurements with AFM imaging of the proteins adsorbed on the surface of mica (a hydrophilic surface).
The AFM images in Fig. 1, D and E, show that the protein preparation adsorbed on mica in a manner consistent with the results from DLS: the surface was covered by a large number of homogeneously sized structures that are larger than the 2.3-nm or 4.9-nm calculated size of a monomer. We therefore conclude that these are oligomers. Because it was hard to evaluate the size of a single oligomer from the densely packed oligomers in Fig. 1, D and E, we imaged the surface after a shorter exposure (2 min instead of 2 h) to the protein solution (Fig. 1F). This image indeed shows separate oligomers of which radius was Rc = 20 ± 5 nm. To correct the effect of profile broadening (due to tip-sample convolution when the feature size is similar to the tip radius; the radius of the tip we used was 10 nm), we calculated the real oligomer radius, R, using the relation Rc = 2 (Rtip ×R)0.5, where Rc is the apparent feature radius, Rtip is the tip radius and R is the real size of the measured feature. We find that r = 15 ± 5 nm, corresponding to about 40 or 300 monomers/oligomer if the oligomer was shaped either as a disk or a sphere, respectively. The size measured by light scattering (RH = 70 ± 10 nm) is larger than that measured for a single oligomer with AFM (r = 15 ± 5 nm). This is expected if in addition to single oligomers present in solution there were also “clumps” of oligomers (e.g. those observed in Fig. 1D). Because the radius found with DLS is the intensity-weighted average of the radius of different particles in solution, the presence of oligomer clumps would shift the average radius toward higher values. In contrast, using AFM images such as that in Fig. 1F, we could resolve the size of single oligomers that is therefore smaller and representative of the real size of a single oligomer. From these DLS and AFM results we concluded that the matrix protein preparations, when purified as we describe here, exist as oligomers rather than monomers or long fibers in solution and on a hydrophilic surface. We therefore refer to these preparations as TasA oligomers.
The observation that the TasA oligomers ran as a single polypeptide chain in SDS-PAGE after treatment with 2% SDS and heating to 90 °C (Fig. 1A) prompted us to investigate the effect of 2% SDS on purified protein using DLS. We found that SDS treatment resulted in a narrow distribution of molecules of a radius (RH) of only 2.0 ± 0.2 nm even at room temperature (see red line in Fig. 1B and the corresponding fit in black and red histogram in Fig. 1C). This value is in close agreement with the 2.3-nm radius calculated for monomeric TasA, suggesting that the TasA oligomers can be dissociated to monomers by treatment with SDS.
To evaluate the stability of the TasA oligomers in solution and to determine whether they aggregated after purification, we followed their size over a period of time. A continuous measurement of the hydrodynamic radius of TasA after purification showed that the radius of TasA remained unchanged over the course of 3 h at pH 8 (Fig. 2A). The average radius of the protein remained unchanged over a wide range of concentrations (0.5–5 μm) and even after 24 h (data not shown).
FIGURE 2.

A, scatter in the hydrodynamic radius of the protein oligomers, measured over the course of 3 h using DLS. B, CD spectra of the purified TasA, measured at pH 7.4 (black symbols), following a 2% SDS treatment and 1-h boiling and treatment with 5 m guanidine HCl (red and blue symbols, respectively). The latter spectrum is truncated at 210 nm due to large absorbance by guanidine HCl at smaller wavelengths. MRE, mean residue ellipticity.
Witnessing the nonamyloid character of the oligomers, as shown by their decomposition into monomers with SDS, we used CD to investigate the secondary structure of the purified TasA oligomers. The CD spectrum in Fig. 2B (black symbols) shows that at pH 7.4 the protein had clear α-helical characteristics, as indicated by two minima at 208 and 222 nm. This α-helical-rich state of TasA served as an additional indication that the protein had not lost structure when it was purified. The α-helical structure of the oligomers as well as their conversion to monomers after SDS treatment indicated that these oligomers are in a nonamyloid state. It is remarkable, though, that the α-helical structure of TasA was not lost upon treatment with 2% SDS and 1-h boiling (Fig. 2B, red symbols) and only after a 5 m guanidine HCl did the protein lose its structure (Fig. 2B, blue symbols). The results obtained from the DLS, AFM, and CD analyses of TasA preparations thus revealed the existence of stable and structured oligomers in solution and on a hydrophilic surface.
Matrix Protein Oligomers Self-assemble into Fibers on a Hydrophobic Surface
The ability to purify a stable oligomeric amyloid precursor directly from cells and without denaturation or renaturation provided a unique opportunity to study its aggregation in detail under controlled conditions. In particular, because these oligomers did not aggregate spontaneously, we could ask which external cues gave rise to protein aggregation. One clue to a potential aggregation factor was that we had previously observed purified TasA preparations in the form of fibers on an EM grid (12). We hypothesized that being hydrophobic (either carbon or formvar), the EM grid itself might have induced the oligomers to aggregate and self-assemble into fibers.
To test this hypothesis, we analyzed the protein preparation adsorbed on a model hydrophobic surface: a silicon/silicon oxide wafer onto which we first adsorbed a trichloro(octyl)silane monolayer (25, 26). The contact angle of water on this surface, θ = 100 ± 5°, indicated that it was hydrophobic. AFM of TasA adsorbed onto this hydrophobic surface shows that TasA oligomers indeed formed fibers (Fig. 3A). At higher magnification, the AFM images showed that the fibers were formed by the assembly of oligomers (Fig. 3B), reminiscent of similar observations with yeast prions (27). To compare the fibers that formed on the hydrophobized silicon/silicon oxide surfaces with our prior electron microscopy observations of TasA fibers on a hydrophobic EM grid, we repeated that experiment and adsorbed the newly purified protein also on a carbon-coated EM grid. The images shown in Fig. 3, C and D, are consistent with our previous observations and show that TasA oligomers formed fibers also on the hydrophobic EM grid. We nevertheless note that the appearance of the fibers on an EM grid is different from that observed with AFM on our designed hydrophobic surfaces. In particular, the latter are thicker and branched whereas the former are thinner and linear. This difference itself suggests that the properties of the surface as well as sample preparation methods (e.g. staining) might affect the formation of the fibers on a surface. The different hydrophobic surfaces we used therefore served as triggers for the aggregation of TasA oligomers into fibers.
FIGURE 3.

AFM images of the TasA oligomers adsorbed from solution on a hydrophobic surface (see “Results”). A, fibers that are formed. B, magnified image of the boxed region in A showing that fibers are composed of oligomers. The Z scale is shown to right of the AFM image. C and D, transmission electron microscopy images of TasA fibers forming on carbon-coated EM grids. D, zoomed-in view of the boxed region in C. Scale bars, 200 nm.
To study the surface-induced self-assembly process in more detail, we analyzed the adsorption of the protein from a 5 μm solution over a period of time. Fig. 4 shows AFM images of the hydrophobic and hydrophilic surfaces after exposure to the protein solution for periods of time ranging from 0.5 to 120 min. These images showed that the oligomers adsorbed on both surfaces. However, the adsorption kinetics, as well as the final structures formed, were very different. Qualitatively, on a hydrophobic surface the oligomers evenly coated the surface at earlier time points although as time progressed they assembled into fibers of which thickness was growing with time (Fig. 4, A–D). On a hydrophilic surface, on the other hand, there was much less adsorption initially, but at later times we observed a densely packed layer of oligomers that essentially covered the whole surface (Fig. 4, E–H).
FIGURE 4.

AFM images of the protein adsorbed from solution on the hydrophobic surface (A–D) and on the hydrophilic surface of mica (E–H) over time. The Z scale of the relevant images is shown to the right in each row. Scale bars, 200 nm.
For a quantitative analysis of the adsorption process, we used image analysis to determine the total surface coverage as well as the relative surface coverage of fibers and oligomers over time (see “Experimental Procedures” and Fig. 5). This analysis revealed that the adsorption time was much faster on the hydrophobic surface (Fig. 5C): a plateau was reached after approximately 5 min on hydrophobic surfaces, but not until 40 min on the hydrophilic surfaces (Fig. 5C). In addition, a plateau value of approximately 40% surface coverage was reached on a hydrophobic surface compared with almost 100% coverage on a hydrophilic surface (Fig. 5C). Such a difference in the adsorption kinetics may be explained by different oligomer-surface and oligomer-oligomer interactions on both surfaces (28). The fraction of fibers and oligomers in images such as Fig. 5, D and E, was plotted as a function of time in Fig. 5F (fiber-, oligomer-relative coverage is denoted by diamonds and triangles, respectively), and it indeed shows that oligomers rearranged into fibers: an increase in fiber coverage over time was correlated with a decrease of coverage by oligomers.
The adsorption of the protein also depended on its bulk concentration. Similar to what we observed with the adsorption process over time (Fig. 4), fibers formed on a hydrophobic surface from oligomers, and the fibers thickened as the protein concentration increased in the range from 0.05 μm to 5 μm (data not shown). However, no fibers were formed at any concentration tested on a hydrophilic surface. Interestingly, on a hydrophilic surface at low concentrations the oligomers condense together to form larger oligomers (data not shown).
TasA Forms Fibrous Aggregates in Acidic Solutions
Having determined that surface hydrophobicity can serve as a trigger for TasA oligomer aggregation into fibers, we wanted to test whether there were any conditions that might trigger oligomer aggregation in solution. There is precedent in the literature that acidic conditions lead to the aggregation of several amyloid precursors of human (29–33) and bacterial (34, 35) proteins. However, in some cases formic acid can also break down pre-formed amyloid fibers instead of stimulating amyloid fiber formation (7, 34). Given our present results that our starting material is in an oligomeric form (rather than in the form of fibers as we previously suggested (12)), we tested the effect of acidic pH on aggregation.
To this end, we utilized DLS to measure the average hydrodynamic radius of the protein solution at different time points after adjusting the pH in solution to 2.5 with formic acid. The particle size increased dramatically over time and reached saturation at a few μm in radius, ∼60 min after the pH was adjusted to 2.5 (Fig. 6A). Similar results were obtained when adjusting the pH to 2.5 with hydrochloric acid, suggesting that aggregation was not specific to formic acid. Focusing on the earlier time points (Fig. 6A, inset), shows that aggregation began almost immediately, without any observable lag time. The lack of a lag time agrees with other aggregation processes of amyloid precursors, starting from oligomers (and not monomers) (36). Aggregation of TasA was also observed with DLS after reducing the pH to 4.5 (data not shown).
To analyze the appearance of the larger aggregates that formed after 3 h of incubation at pH 2.5, we examined them using AFM. When adsorbed on a hydrophobic surface (identical to that used in Fig. 3) the sample appeared to be composed of fibrous aggregates (compare Fig. 6, B and C, with the stretched fibers in Fig. 3). Similar aggregates were observed on mica (a hydrophilic surface), but their density was much lower. Occasionally, fibers similar in appearance to those shown in Fig. 3A were also observed on the hydrophobic surface; we attribute the formation of these fibers to oligomers that had not aggregated yet in the acidic solution.
Aggregation Involves a Structural Change in TasA
What drives the aggregation of TasA into fibrous networks on a hydrophobic surface and in response to decreasing the pH in solution? Specifically, does TasA change structure upon such changes in the environment?
We used CD to measure changes in secondary structure of TasA in solution over the course of 10 h either before or after the addition of formic acid (Fig. 7A, filled and open symbols, respectively). As also seen in Fig. 2B, before formic acid addition, at pH 7.4, the protein had clear α-helical characteristics (Fig. 7A, filled symbols). Upon adjusting the pH to 3 using formic acid (due to large absorbance by the formic acid we adjusted the pH to be 3 instead of 2.5 in our CD measurements; see “Experimental Procedures”), the two minima that are characteristic of α-helices were lost (Fig. 7A, open symbols). The loss of the α-helical structure is seen more clearly in Fig. 7B where we plotted the ellipticity value at 222 and 230 nm (open circles and open diamonds, respectively) as a function of time. The loss of ellipticity (loss of α-helical content) appeared to saturate at ∼100 min after the addition of formic acid.
FIGURE 7.

The protein changes conformation at acidic pH. A, CD spectra measured at pH 7.4 (filled squares) and 10 h after pH adjustment to 3 (open squares). B, CD measured at 222 (open circles) and 230 nm (open diamonds) as a function of time after adjustment to pH 3. C, typical ThT fluorescence measurement performed after adjusting the pH to 2.5 (squares) and remaining at 8 (triangles). Similar results were obtained with protein from two different purification batches. D, zooming into the first 200 min in C, showing both ThT fluorescence measured over time at pH 2.5 (filled squares) and CD at 230 nm (open diamonds). MRE, mean residue ellipticity.
In parallel to the loss of α-helical structure, the protein gained β-sheet structure (Fig. 7A, open squares). However, because the characteristic β-sheet minimum at 215–218 nm was less pronounced than the loss of the α-helical structure, we used a complementary assay, ThT fluorescence, to follow the gain in β-sheet structure after lowering the pH. As shown in Fig. 7C (filled squares), ThT fluorescence increased almost 3-fold 3 h after lowering the pH to 2.5, whereas there was no noticeable increase in ThT fluorescence at pH 8 (Fig. 7C, triangles). The increase of fluorescence at pH 2.5 occurred in discrete steps as shown more clearly on a reduced scale (Fig. 7D, filled squares). Plotting both the loss of the α-helical signal as measured by CD at 230 nm (Fig. 7D, open diamonds) together with the measurement of ThT fluorescence (Fig. 7D, filled squares) reveals a complementary stepwise behavior, suggesting that the loss of the α-helical structure and the gain of β-sheet structure are coordinated in steps appearing at 30 and 90–100 min (note that in Fig. 7D we plotted the CD data at 230 nm only because the data are noisier at 222 nm). The first plateau after 30 min is also observed with DLS (Fig. 6A); however, conformational changes continued to take place even at time points when it seemed from the DLS that the aggregation process has reached a plateau.
We then used FTIR spectroscopy to probe the secondary structure of TasA in solution and on surfaces, through shifts within the amide I band. This band, appearing between 1600 and 1700 cm−1 is assigned mainly to the C = O stretching mode of the peptide backbone, and it is sensitive to the secondary structure of the protein (37–39). The amide I band is shown in solution (Fig. 8A) and on surfaces (Fig. 8B), and we used the first and second derivatives of these spectra to identify their global maxima (from the first derivatives, Fig. 8, C and D) as well as their additional spectral components (from the second derivatives shown in Fig. 8, E and F) (37).
FIGURE 8.
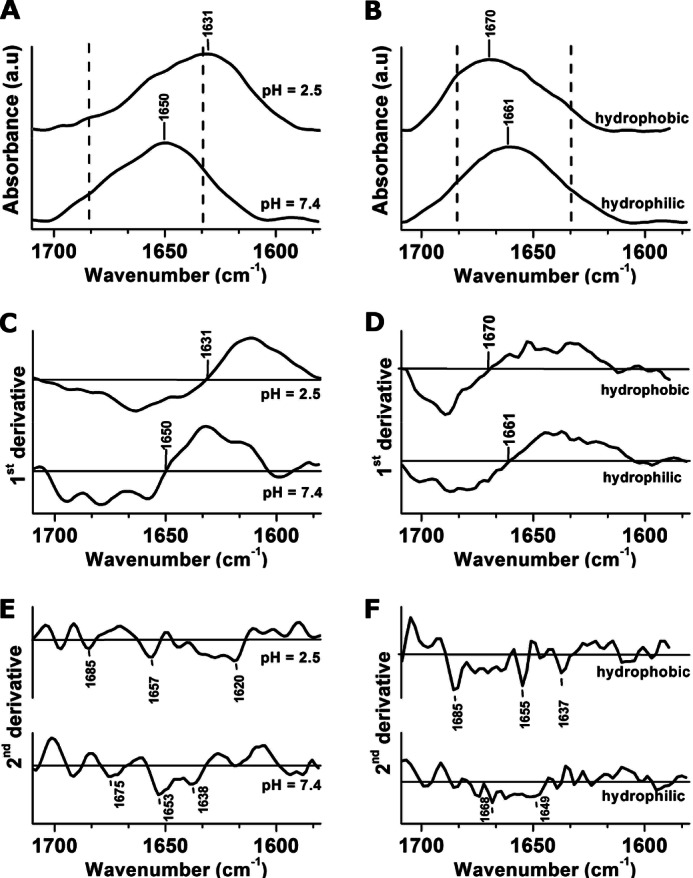
A and B, FTIR spectra of the amide I band were recorded in different environments on surfaces (A) and in solution (B), as specified in the figure. The dashed lines mark the β-sheet characteristic positions at 1633 cm−1 and 1684 cm−1 (see Table 2 in Ref. 37). C and D, the global maxima of the bands highlighted in A and B were determined from the first derivatives of the absorbance spectra with respect to wavenumber (C and D, respectively). E and F, to better resolve the additional absorbance components in the spectra in A and B we plotted their second derivatives (E and F, respectively). The additional absorbance components in A and B appear as principal minima in the second derivative of the spectra and are highlighted in E and F. The solid horizontal lines in C–F correspond to y = 0.
In solution (pH = 7.4), the amide I band centered at 1650 cm−1, and consistent with our CD data, this is typical of an α-helix in an aqueous solution (see Table 2 in Ref. 37) (Fig. 8, A and C, bottom curves). Upon adjustment of the pH to 2.5 in solution, the peak shifted to ∼1630 cm−1 (Fig. 8, A and C, top curves). In addition to the obvious shift of the band maximum, the secondary structure analysis (Fig. 8E) revealed absorbance peaks at 1620 cm−1 and 1685 cm−1. Such a shift of the amide I peak has been attributed to a β-sheet gain in several examples of amyloid (or amyloid-like) proteins that were acid-treated. Examples include a-β (40), PI3-SH3 (29), and prion proteins (42).
We also used FTIR spectroscopy to determine whether a structural change occurred when the protein adsorbed to the different surfaces. On a hydrophilic surface, the FTIR band centered at 1660 cm−1 (Fig. 7, B and D, bottom curves). This peak was shifted relative to the 1650 cm−1 peak measured in solution of pH 7.4. Such a transition may be either attributed to the protein-surface interaction or to the loss of the hydration molecules when the protein was dried on the surface (37, 43). In contrast to the shifting of the band maximum to a lower wavenumber in an acidic solution, on a hydrophobic surface we observed a shift to 1670 cm−1, a typical absorbance of a turn (see Table 2 in Ref. 37) (Fig. 7, B and D, top curves). In addition to the shift in the band primary maximum on a hydrophobic surface, the amide I band also exhibited additional overlapping bands (appearing as “shoulders” in the main spectrum) at 1637 cm−1 and 1685 cm−1, which are typical values of the split of the amide I band in β-sheet structures (see Table 2 in Ref. 37). These overlapping bands were better resolved on a second derivative analysis of the spectra (Fig. 8F, top curve), and they were not observed when we analyze the second derivative of the spectra from a hydrophilic surface (Fig. 8F, bottom curve). The second derivative of the spectra also shows some α-helical contribution to the amide I band at ∼ 1650 cm−1 on a hydrophobic surface and in an acidic solution. This may result from an incomplete transition to β-sheet or from the residual nonaggregated oligomers that did not change structure.
DISCUSSION
We purified a matrix protein, TasA, that forms amyloid-like fibers in biofilms (12). Using DLS and AFM we showed that the purified protein appeared as soluble oligomers. These oligomers remained stable in solutions of pH larger than the protein isoelectric point (the calculated isoelectric point of TasA lacking its signal peptide is 5). Under these conditions TasA is negatively charged, and this might explain the stability of the oligomers in solution.
Previously, when we added such protein preparations to the growth medium of mutants lacking TasA they were biologically active in that they complemented the lack of TasA: biofilms that were thin and fragile in the absence of TasA became robust and similar to those made by wild-type cells after the addition of TasA (12). The complementation ability of the purified oligomers indicated that they were precursor to the formation of amyloid-like fibers. In contrast to commonly used purification protocols of recombinant proteins from inclusion bodies, our purification protocol of the matrix protein from the surface of B. subtilis cells yielded an amyloid-like precursor that preserved its native α-helical structure.
Recently, α-synuclein, a human amyloid precursor that is related to Parkinson disease, was isolated under nondenaturing conditions in the presence of phospholipid small unilamellar vesicles where it appeared as α-helically structured tetramers (44). This is the only report to date of a human amyloid precursor that was isolated in a native form. We show here that a bacterial amyloid-like precursor, TasA, can also be purified in a natively folded state and that in similarity with the human example, it is α-helical as well. For comparison, the extensively studied bacterial amyloid precursor CsgA, which is the major subunit of the functional amyloid curli, is commonly purified by overexpression in E. coli as CsgA-His under denaturing conditions (7, 45). Upon a buffer exchange CsgA (-His) is found as random coil, and in contrast to the stable oligomers of TasA, it aggregates spontaneously (16). Our purification method for TasA therefore offers an alternative that will enable the study of the aggregation of functional amyloids from their natively folded precursors and will therefore represent their condition in vivo.
We further showed that exposure of such oligomers to a hydrophobic surface triggered their aggregation into stretched fibers whereas exposure to acidic solution conditions induced their aggregation into fibrous aggregates. The AFM images of these aggregates showed that they were composed of lined-up oligomers. Formation of similar fibers by the islet amyloid polypeptide, related to type 2 diabetes, has been recently reported (46). The fibrous aggregates formed in an acidic solution are reminiscent of the amyloid plaques that are observed in histopathology of brain tissues from Alzheimer patients (36, 47). The AFM images of a single aggregate being composed of lined-up oligomers revealed a novel perspective on amyloid plaques that have been previously analyzed at lower resolution. Whereas TasA is composed of interspersed hydrophobic/hydrophilic segments, the fact that the fibrous aggregates adsorb better to a hydrophobic surface suggests that they are hydrophobic themselves. Similarly to other amyloid and amyloid-like precursors, we have shown that the aggregates of TasA on hydrophobic surfaces and in an acidic solution changed structure and gained β-sheet characteristics upon aggregation.
What are the in vivo conditions that may be responsible for a local hydrophobic and/or acidic environment within biofilms? We speculate that the assembly of TasA into fibers or fibrous networks over time and space during biofilm formation is triggered by external conditions, similar to those demonstrated here. This idea is supported by the conversion of (what we now identify as) TasA oligomers into amyloid-like fibers in biofilms made by tasA mutant cells (12). The cell surface itself, as well as other components of the extracellular matrix including acidic exopolysaccharides (21, 24, 41) or protein components, among them TapA (18), might provide the physical triggers required for the aggregation of TasA in vivo.
Acknowledgments
We thank David Weitz and Susan Lindquist for illuminating discussions, Tom Kodger for help with dynamic light scattering measurements, Martin Mwangi for help with contact angle measurements, Maria Ericsson for help with electron microscopy, the Harvard Center for Nanoscale Systems (CNS) for use of their SEM and AFM imaging facilities (CNS is a member of the National Nanotechnology Infrastructure Network), and the Harvard Microchemistry and Proteomics Analysis Facility for MS and Edman Analysis of TasA.
This work was supported, in whole or in part, by National Institutes of Health Grants GM58213 (to R. K.) and GM18546 (to R. L.). This work was also supported by grants from the BASF (Badische Anilin- und Soda-Fabrik) Advanced Research Initiative at Harvard University (to R. L. and R. K.).
The average radius of protein purified at different purification batches ranged between 70 and 250 nm.
RH = 2.21 × N0.57 for a highly denatured protein (22).
- ECM
- extracellular matrix
- AFM
- atomic force microscopy
- DLS
- dynamic light scattering
- ThT
- thioflavin T.
REFERENCES
- 1. Flemming H. C., Wingender J. (2010) The biofilm matrix. Nat. Rev. Microbiol. 8, 623–633 [DOI] [PubMed] [Google Scholar]
- 2. Mulcahy H., Charron-Mazenod L., Lewenza S. (2008) Extracellular DNA chelates cations and induces antibiotic resistance in Pseudomonas aeruginosa biofilms. PLoS Pathog. 4, e1000213. [DOI] [PMC free article] [PubMed] [Google Scholar]
- 3. Wilking J. N., Angelini T. E., Seminara A., Brenner M. P., Weitz D. A. (2011) Biofilms as complex fluids. MRS Bull. 36, 385–391 [Google Scholar]
- 4. Rubinstein S. M., Kolodkin-Gal I., McLoon A., Chai L., Kolter R., Losick R., Weitz D. A. (2012) Osmotic pressure can regulate matrix gene expression in Bacillus subtilis. Mol. Microbiol. 86, 426–436 [DOI] [PMC free article] [PubMed] [Google Scholar]
- 5. Epstein A. K., Pokroy B., Seminara A., Aizenberg J. (2011) Bacterial biofilm shows persistent resistance to liquid wetting and gas penetration. Proc. Natl. Acad. Sci. U.S.A. 108, 995–1000 [DOI] [PMC free article] [PubMed] [Google Scholar]
- 6. Kobayashi K., Iwano M. (2012) BslA(YuaB) forms a hydrophobic layer on the surface of Bacillus subtilis biofilms. Mol. Microbiol. 85, 51–66 [DOI] [PubMed] [Google Scholar]
- 7. Chapman M. R., Robinson L. S., Pinkner J. S., Roth R., Heuser J., Hammar M., Normark S., Hultgren S. J. (2002) Role of Escherichia coli curli operons in directing amyloid fiber formation. Science 295, 851–855 [DOI] [PMC free article] [PubMed] [Google Scholar]
- 8. Schwartz K., Syed A. K., Stephenson R. E., Rickard A. H., Boles B. R. (2012) Functional amyloids composed of phenol soluble modulins stabilize Staphylococcus aureus biofilms. PLoS Pathog. 8, e1002744. [DOI] [PMC free article] [PubMed] [Google Scholar]
- 9. Dueholm M. S., Petersen S. V., Sønderkær M., Larsen P., Christiansen G., Hein K. L., Enghild J. J., Nielsen J. L., Nielsen K. L., Nielsen P. H., Otzen D. E. (2010) Functional amyloid in Pseudomonas. Mol. Microbiol. 77, 1009–1020 [DOI] [PubMed] [Google Scholar]
- 10. Stöver A. G., Driks A. (1999) Secretion, localization, and antibacterial activity of TasA, a Bacillus subtilis spore-associated protein. J. Bacteriol. 181, 1664–1672 [DOI] [PMC free article] [PubMed] [Google Scholar]
- 11. Branda S. S., Chu F., Kearns D. B., Losick R., Kolter R. (2006) A major protein component of the Bacillus subtilis biofilm matrix. Mol. Microbiol. 59, 1229–1238 [DOI] [PubMed] [Google Scholar]
- 12. Romero D., Aguilar C., Losick R., Kolter R. (2010) Amyloid fibers provide structural integrity to Bacillus subtilis biofilms. Proc. Natl. Acad. Sci. U.S.A. 107, 2230–2234 [DOI] [PMC free article] [PubMed] [Google Scholar]
- 13. Karatan E., Watnick P. (2009) Signals, regulatory networks, and materials that build and break bacterial biofilms. Microbiol. Mol. Biol. Rev. 73, 310–347 [DOI] [PMC free article] [PubMed] [Google Scholar]
- 14. Epstein E. A., Chapman M. R. (2008) Polymerizing the fibre between bacteria and host cells: the biogenesis of functional amyloid fibres. Cell. Microbiol. 10, 1413–1420 [DOI] [PMC free article] [PubMed] [Google Scholar]
- 15. Barnhart M. M., Chapman M. R. (2006) Curli biogenesis and function. Annu. Rev. Microbiol. 60, 131–147 [DOI] [PMC free article] [PubMed] [Google Scholar]
- 16. Shu Q., Crick S. L., Pinkner J. S., Ford B., Hultgren S. J., Frieden C. (2012) The E. coli CsgB nucleator of curli assembles to β-sheet oligomers that alter the CsgA fibrillization mechanism. Proc. Natl. Acad. Sci. U.S.A. 109, 6502–6507 [DOI] [PMC free article] [PubMed] [Google Scholar]
- 17. Blanco L. P., Evans M. L., Smith D. R., Badtke M. P., Chapman M. R. (2012) Diversity, biogenesis and function of microbial amyloids. Trends Microbiol. 20, 66–73 [DOI] [PMC free article] [PubMed] [Google Scholar]
- 18. Romero D., Vlamakis H., Losick R., Kolter R. (2011) An accessory protein required for anchoring and assembly of amyloid fibres in B. subtilis biofilms. Mol. Microbiol. 80, 1155–1168 [DOI] [PMC free article] [PubMed] [Google Scholar]
- 19. Kearns D. B., Chu F., Branda S. S., Kolter R., Losick R. (2005) A master regulator for biofilm formation by Bacillus subtilis. Mol. Microbiol. 55, 739–749 [DOI] [PubMed] [Google Scholar]
- 20. Berne B. J., Pecora R. (1976) Dynamic Light Scattering: With Applications to Chemistry, Biology, and Physics, John Wiley & Sons, New York [Google Scholar]
- 21. Branda S. S., Vik S., Friedman L., Kolter R. (2005) Biofilms: the matrix revisited. Trends Microbiol. 13, 20–26 [DOI] [PubMed] [Google Scholar]
- 22. Wilkins D. K., Grimshaw S. B., Receveur V., Dobson C. M., Jones J. A., Smith L. J. (1999) Hydrodynamic radii of native and denatured proteins measured by pulse field gradient NMR techniques. Biochemistry 38, 16424–16431 [DOI] [PubMed] [Google Scholar]
- 23. Flory P. J. (1953) Principles of Polymer Chemistry, Cornell University Press, Ithaca, NY [Google Scholar]
- 24. Sutherland I. (2001) Biofilm exopolysaccharides: a strong and sticky framework. Microbiology 147, 3–9 [DOI] [PubMed] [Google Scholar]
- 25. Maoz R., Netzer L., Gun J., Sagiv J. (1988) Self-assembling monolayers in the construction of planned supramolecular structures and as modifiers of surface properties. J. Chim. Phys. Chim. Biol. 85, 1059–1065 [Google Scholar]
- 26. Wasserman S. R., Tao Y. T., Whitesides G. M. (1989) Structure and reactivity of alkylsiloxane monolayers formed by reaction of alkyltrichlorosilanes on silicon substrates. Langmuir 5, 1074–1087 [Google Scholar]
- 27. Serio T. R., Cashikar A. G., Kowal A. S., Sawicki G. J., Moslehi J. J., Serpell L., Arnsdorf M. F., Lindquist S. L. (2000) Nucleated conformational conversion and the replication of conformational information by a prion determinant. Science 289, 1317–1321 [DOI] [PubMed] [Google Scholar]
- 28. Magdassi S. (1996) Surface Activities of Proteins: Chemical and Physical Modifications, Marcel Dekker, New York, NY [Google Scholar]
- 29. Zurdo J., Guijarro J. I., Jiménez J. L., Saibil H. R., Dobson C. M. (2001) Dependence on solution conditions of aggregation and amyloid formation by an SH3 domain. J. Mol. Biol. 311, 325–340 [DOI] [PubMed] [Google Scholar]
- 30. McParland V. J., Kad N. M., Kalverda A. P., Brown A., Kirwin-Jones P., Hunter M. G., Sunde M., Radford S. E. (2000) Partially unfolded states of β2-microglobulin and amyloid formation in vitro. Biochemistry 39, 8735–8746 [DOI] [PubMed] [Google Scholar]
- 31. Pfefferkorn C. M., McGlinchey R. P., Lee J. C. (2010) Effects of pH on aggregation kinetics of the repeat domain of a functional amyloid, Pmel17. Proc. Natl. Acad. Sci. U.S.A. 107, 21447–21452 [DOI] [PMC free article] [PubMed] [Google Scholar]
- 32. McGlinchey R. P., Shewmaker F., Hu K. N., McPhie P., Tycko R., Wickner R. B. (2011) Repeat domains of melanosome matrix protein Pmel17 orthologs form amyloid fibrils at the acidic melanosomal pH. J. Biol. Chem. 286, 8385–8393 [DOI] [PMC free article] [PubMed] [Google Scholar]
- 33. Orte A., Birkett N. R., Clarke R. W., Devlin G. L., Dobson C. M., Klenerman D. (2008) Direct characterization of amyloidogenic oligomers by single-molecule fluorescence. Proc. Natl. Acad. Sci. U.S.A. 105, 14424–14429 [DOI] [PMC free article] [PubMed] [Google Scholar]
- 34. Dueholm M. S., Nielsen S. B., Hein K. L., Nissen P., Chapman M., Christiansen G., Nielsen P. H., Otzen D. E. (2011) Fibrillation of the major curli subunit CsgA under a wide range of conditions implies a robust design of aggregation. Biochemistry 50, 8281–8290 [DOI] [PMC free article] [PubMed] [Google Scholar]
- 35. Shahnawaz M., Soto C. (2012) Microcin amyloid fibrils A are reservoir of toxic oligomeric species. J. Biol. Chem. 287, 11665–11676 [DOI] [PMC free article] [PubMed] [Google Scholar]
- 36. Eichner T., Radford S. E. (2011) A diversity of assembly mechanisms of a generic amyloid fold. Mol. Cell 43, 8–18 [DOI] [PubMed] [Google Scholar]
- 37. Barth A., Zscherp C. (2002) What vibrations tell us about proteins. Q. Rev. Biophys. 35, 369–430 [DOI] [PubMed] [Google Scholar]
- 38. Barth A. (2007) Infrared spectroscopy of proteins. Biochim. Biophys. Acta 1767, 1073–1101 [DOI] [PubMed] [Google Scholar]
- 39. Singh B. R. (2000) Infrared Analysis of Peptides and Proteins: Principles and Applications, ACS Symposium Series, Vol. 750, American Chemical Society, Washington, D. C [Google Scholar]
- 40. Fraser P. E., Nguyen J. T., Surewicz W. K., Kirschner D. A. (1991) pH-dependent structural transitions of Alzheimer amyloid peptides. Biophys. J. 60, 1190–1201 [DOI] [PMC free article] [PubMed] [Google Scholar]
- 41. Chang W. S., van de Mortel M., Nielsen L., Nino de Guzman G., Li X., Halverson L. J. (2007) Alginate production by Pseudomonas putida creates a hydrated microenvironment and contributes to biofilm architecture and stress tolerance under water-limiting conditions. J. Bacteriol. 189, 8290–8299 [DOI] [PMC free article] [PubMed] [Google Scholar]
- 42. Sokolowski F., Modler A. J., Masuch R., Zirwer D., Baier M., Lutsch G., Moss D. A., Gast K., Naumann D. (2003) Formation of critical oligomers is a key event during conformational transition of recombinant Syrian hamster prion protein. J. Biol. Chem. 278, 40481–40492 [DOI] [PubMed] [Google Scholar]
- 43. Parrish J. R., Jr., Blout E. R. (1972) The conformation of poly-l-alanine in hexafluoroisopropanol. Biopolymers 11, 1001–1020 [DOI] [PubMed] [Google Scholar]
- 44. Bartels T., Choi J. G., Selkoe D. J. (2011) [agr]-Synuclein occurs physiologically as a helically folded tetramer that resists aggregation. Nature 477, 107–110 [DOI] [PMC free article] [PubMed] [Google Scholar]
- 45. Wang X., Smith D. R., Jones J. W., Chapman M. R. (2007) In vitro polymerization of a functional Escherichia coli amyloid protein. J. Biol. Chem. 282, 3713–3719 [DOI] [PMC free article] [PubMed] [Google Scholar]
- 46. Keller A., Fritzsche M., Yu Y. P., Liu Q., Li Y. M., Dong M., Besenbacher F. (2011) Influence of hydrophobicity on the surface-catalyzed assembly of the islet amyloid polypeptide. ACS Nano 5, 2770–2778 [DOI] [PubMed] [Google Scholar]
- 47. Yamada M., Tsukagoshi H., Otomo E., Hayakawa M. (1987) Cerebral amyloid angiopathy in the aged. J. Neurol. 234, 371–376 [DOI] [PubMed] [Google Scholar]