Background: The S186W mutation in rhodopsin causes retinitis pigmentosa (RP).
Results: The mutation expedites thermal isomerization and hydrolysis of the Schiff base by orders of magnitude.
Conclusion: Lower thermal stability could link to higher levels of dark noise, associated with RP's early symptom, night blindness.
Significance: Further quantitative kinetic studies could potentially establish a correlation between thermal stability and RP progression.
Keywords: 7-Helix Receptor, G Protein-coupled Receptors, Membrane Proteins, Mutant, Rhodopsin, Dark Noise, Hydrogen Bond Network, Hydrolysis, Isomerization, Thermal Decay
Abstract
Over 100 point mutations in the rhodopsin gene have been associated with retinitis pigmentosa (RP), a family of inherited visual disorders. Among these, we focused on characterizing the S186W mutation. We compared the thermal properties of the S186W mutant with another RP-causing mutant, D190N, and with WT rhodopsin. To assess thermal stability, we measured the rate of two thermal reactions contributing to the thermal decay of rhodopsin as follows: thermal isomerization of 11-cis-retinal and hydrolysis of the protonated Schiff base linkage between the 11-cis-retinal chromophore and opsin protein. We used UV-visible spectroscopy and HPLC to examine the kinetics of these reactions at 37 and 55 °C for WT and mutant rhodopsin purified from HEK293 cells. Compared with WT rhodopsin and the D190N mutant, the S186W mutation dramatically increases the rates of both thermal isomerization and dark state hydrolysis of the Schiff base by 1–2 orders of magnitude. The results suggest that the S186W mutant thermally destabilizes rhodopsin by disrupting a hydrogen bond network at the receptor's active site. The decrease in the thermal stability of dark state rhodopsin is likely to be associated with higher levels of dark noise that undermine the sensitivity of rhodopsin, potentially accounting for night blindness in the early stages of RP. Further studies of the thermal stability of additional pathogenic rhodopsin mutations in conjunction with clinical studies are expected to provide insight into the molecular mechanism of RP and test the correlation between rhodopsin's thermal stability and RP progression in patients.
Introduction
Retinitis pigmentosa (RP)7 is a family of inherited visual disorders characterized by progressive degeneration of the retina and retinal pigment epithelium (1–6). About 25% of autosomal dominant RP cases are connected to one of over 100 point mutations in the rhodopsin gene (7). Understanding the molecular mechanism of the individual genetic defects that cause RP is key to developing new treatments. Mechanisms such as misfolding and mistrafficking of mutant rhodopsin have been proposed to explain the cause of RP by different mutations, but the mechanisms for about half of the mutations remain unknown (8–10). Among these, the S186W mutation was identified clinically by Ruther et al. (11), but it has remained almost unexplored at the molecular level.
Rhodopsin is a widely studied seven-helical transmembrane G protein-coupled receptor (12–21). Found in the peripheral retina, rhodopsin enables dim-light vision and accounts for over 90% of the protein in the disc membranes of the outer segment of rod cells (15, 22). Rhodopsin consists of the opsin apoprotein covalently bound to a chromophore, 11-cis-retinal, via a protonated Schiff base (SB) linkage at the Lys-296 residue (23). Upon absorption of a photon, 11-cis-retinal isomerizes to all-trans-retinal, initiating a series of conformational changes in the protein, resulting in the active form, metarhodopsin II (Meta II), which consists of all-trans-retinal bound to opsin by a deprotonated SB (21, 24–29). Meta II then activates the G protein transducin to trigger the visual signaling pathway, leading to the perception of light (30, 31).
In the early stages of RP, patients lose night vision and, in up to 35% of cases, see false flashes of light, a symptom known as photopsia (6, 32), suggesting that RP may initially affect the sensitivity of rhodopsin to light and may cause overactivation of visual signaling. Electrophysiological studies have demonstrated that rod cells are normally sensitive to single photons (33, 34), but two sources of noise limit the amount of light that the brain can consciously detect. First, discrete dark noise refers to thermally induced false signaling that resembles the single photon response and is caused by thermal isomerization of 11-cis-retinal (35–37). Second, continuous dark noise refers to the constitutive activation of transducin, which can be caused by opsin not bound to retinal, a situation resulting from hydrolysis of the SB between retinal and opsin (38–41). Therefore, the two kinds of dark noise are linked to the two chemical reactions, thermal isomerization and hydrolysis of SB. These two reactions comprise the thermal decay of rhodopsin (42, 43), and both reactions must be suppressed to attain the extreme photosensitivity needed for dim light vision. Thus, the thermal properties of rhodopsin are crucial to understanding the molecular etiology of RP.
We asked how the thermal stability of rhodopsin relates to the pathogenic mechanism of RP. Previous research points to the importance of a hydrogen bond network found throughout the protein in stabilizing the dark state of rhodopsin and preventing thermal isomerization of 11-cis-retinal (16, 42–46). Many point mutations in rhodopsin that perturb the hydrogen bond interactions are associated with RP (21). We hypothesized that such mutations could disrupt thermal stability and raise the level of dark noise, which could be associated with the night blindness experienced by RP patients in the early stage of the disease.
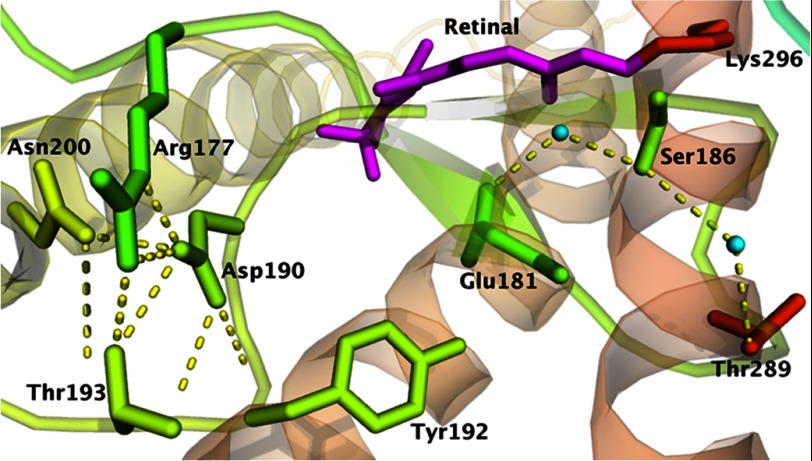
We chose to study S186W (11) because it has distinct characteristics that make it a good candidate for studying the thermal properties of rhodopsin. The residue is located on extracellular loop 2, which plugs into the binding pocket of the protein (12, 16, 17). Extracellular loop 2 is home to many important molecular interactions related to photoactivation (21, 47–49) and has been shown to play critical roles in rhodopsin stability (42–44, 46, 50–52). Ser-186 appears to form hydrogen bonds with two conserved water molecules (Fig. 1). One water molecule may form a hydrogen bond to Thr-289 (17). The other water molecule coordinates with Glu-181 (16, 17, 45, 53), which is involved in the counterion switch mechanism that underlies the activation of rhodopsin (47–49, 54–56). Ser-186 is also thought to form an intermediate interaction with the protonated SB in the proton transfer mechanism for switching the protonated SB counterion from Glu-113 to Glu-181 (48, 54). Another clue to the significance of Ser-186 is its proximity to Cys-187, which forms a disulfide bond with Cys-110 that is necessary for stabilizing rhodopsin; mutations that eliminate either cysteine result in moderate (C110F or C110Y) or severe RP (C187Y) (57, 58). Experiments on the nonpathogenic S186A mutation revealed that it increases the rate of thermal decay by 3-fold compared with wild type (WT) (46) and increases the rates of thermal isomerization and hydrolysis of SB by 2 orders of magnitude at 55 °C (43, 44). However, the pathogenic S186W mutant has not been characterized at the molecular level, although clinical studies suggest a severe phenotype (11, 59).
FIGURE 1.
Crystal structure of rhodopsin (Protein Data Bank code 1U19). The figure shows Asp-190 and Ser-186 near the binding site of 11-cis-retinal. Ser-186 forms hydrogen bonds with Glu-181 and Thr-289 via two water molecules, whereas Asp-190 forms an electrostatic interaction with Arg-177 and hydrogen bonds with Arg-177, Tyr-192, Thr-193, and Asn-200. Water molecules are colored cyan, and dashed yellow lines indicate possible hydrogen bonds.
Moreover, a quantitative kinetic study of the thermal decay process of S186W has allowed a comprehensive comparison with the thermal process of the D190N mutation, which is another mutation in the rhodopsin gene that causes RP. Although the rate of thermal decay of D190N has been previously characterized (51), how this mutation affects the rate of two thermal reactions, thermal isomerization and SB hydrolysis, has not been investigated. Tsui et al. (60) recently reported the phenotypes of one family with the D190N mutation. Their studies revealed that the D190N genotype correlates with a relatively slow progression of RP (60), which is in contrast to the severe phenotype of the S186W mutant (11). Thus, a quantitative comparison of the kinetics of the thermal reactions of S186W and D190N will introduce a new approach to associate thermal stability of pathogenic mutants at a molecular level with vision deterioration in RP patients at a clinical level.
Similar to the S186W mutant, the D190N mutant is located on extracellular loop 2 and forms hydrogen bonds at the retinal active site. In particular, Asp-190 interacts electrostatically with Arg-177 (Fig. 1) (12, 16, 17). Using NMR, Ahuja et al. (21) found that Asp-190 forms hydrogen bonds with Arg-177, Ser-176, and Asn-200. X-ray crystal structures indicate that Asp-190 forms hydrogen bonds with Arg-177, Tyr-192, Thr-193, and Asn-200 (12, 16, 17). An early biochemical study by Sung et al. (9) reported that human D190N failed to generate light-sensitive protein, misfolded, and was retained in the endoplasmic reticulum of transfected COS cells. However, Kaushal and Khorana (61) as well as Janz et al. (52) found that bovine D190N had normal absorbance spectra, likely suggesting proper folding and photochemistry. Janz et al. (51, 52) compared the stability of dark state and Meta II in the D190N mutant with WT rhodopsin and found that the mutation increased the rate of thermal decay. Here, we aim to compare the effect of D190N with that of S186W on the thermal stability of rhodopsin to gain insight into the correlation between the thermal stability of the mutants and RP progression in patients.
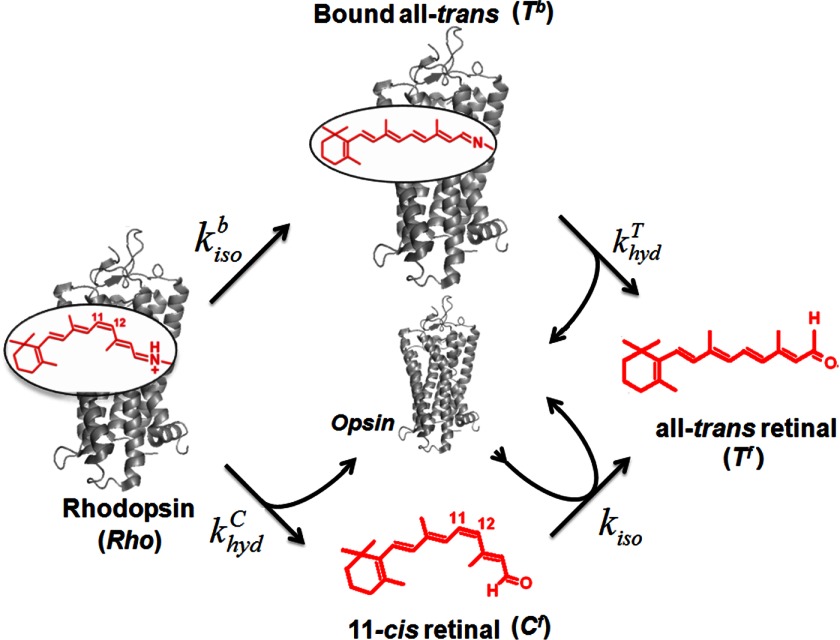
To achieve this, we sought to quantitatively compare the rates of thermal reactions of S186W with those of D190N. Previously, Janz et al. (52) measured the rate of thermal decay of D190N and found it to be faster than that of WT rhodopsin. Here, we measured not only the rate of thermal decay but also the individual rates of thermal isomerization and the SB hydrolysis of both mutants (42–44). Understanding the effects of the S186W and D190N mutations on individual thermally driven chemical reactions in both the dark state and active state is critical for determining the mechanism by which these mutations give rise to visual defects. We recently proposed a kinetic model (Fig. 2) to describe the thermal processes of rhodopsin, which enables the dissection of thermal reactions into individual steps to yield their rate constants (44).
FIGURE 2.
Kinetic model of the thermal processes of rhodopsin. The model consists of two pathways. First, dark state Rho undergoes thermal isomerization at a rate kisob to yield all-trans-retinal bound to opsin via an unprotonated SB (Tb), a Meta II-like state. The SB in Tb breaks at a rate khydT to yield all-trans-retinal free in solution (Tf). Second, Rho undergoes hydrolysis of the protonated SB at a rate khydc to form 11-cis-retinal free in solution (Cf), along with opsin protein. Then Cf isomerizes in the presence of opsin protein at a rate kiso to yield Tf.
The kinetic model of the thermal decay of dark state rhodopsin (Rho) consists of two pathways. First, thermal isomerization of 11-cis-retinal in the binding site of rhodopsin yields all-trans-retinal bound to opsin (Tb) at a rate kisob, followed by hydrolysis of the deprotonated SB to give free all-trans-retinal (Tf) at a rate khydT. Second, hydrolysis of the protonated SB of Rho yields free 11-cis-retinal (Cf) and opsin at a rate khydc, followed by opsin-catalyzed thermal isomerization of Cf to Tf at a rate kiso. The thermal isomerization in the second pathway (kiso) can be catalyzed by the presence of opsin, as we showed previously (44). Of the four rate constants, we can determine khydT experimentally using an acid denaturation assay to measure the hydrolysis of SB in activated rhodopsin. To find the remaining rate constants, we used three additional experiments as follows: UV-visible spectroscopy to measure thermal decay, HPLC analysis to measure retinal isomerization, and acid denaturation to measure hydrolysis of SB in dark state rhodopsin.
We use these three experiments because they each probe a portion of the kinetic model; combined, they elucidate each individual rate constant. The thermal decay experiment uses the absorbance at 500 nm (A500) to measure the amount of dark state rhodopsin in a sample over time; thus, this experiment reflects the rate of thermal decay through both the thermal isomerization and hydrolysis pathways. Hence, the experiment measures the sum of the rates kisob and khydc. The HPLC experiment measures the amount of 11-cis-retinal present in a sample over time (regardless of whether the retinal is bound to protein or not); thus, it is related to the rates kisob and kiso. Finally, the acid denaturation experiment measures the amount of intact Schiff base present in a sample over time (regardless of the isomeric form of retinal); thus, it is related to the rates khydc and khydT. The three experiments produce three sets of data. These three sets of data combined with the independent measurement of the rate of Meta II hydrolysis (khydT) can be fit into the kinetic model (Fig. 2) to yield the individual rate constants, khydc, kisob, and kiso. Thereby, we can quantitatively compare the effects of the S186W and D190N mutations on the rate of thermal isomerization and hydrolysis of SB, which are correspondingly associated with rhodopsin's discrete and continuous dark noise.
In this study, we apply the kinetic model to analyze the pathogenic rhodopsin mutations, aiming to understand the molecular etiology of RP. We studied the kinetics of thermal reactions of S186W at 37 and 55 °C and compared it with that of WT rhodopsin and D190N. The results show that the S186W mutation drastically destabilizes rhodopsin. Compared with D190N, S186W increases the rates of both thermal isomerization and hydrolysis of SB by at least an order of magnitude at 37 °C and close to 1 order of magnitude at 55 °C, which aligns with a faster pace of vision deterioration in patients carrying the S186W mutation. Hence, our results imply a potential association between the mutants' impact on thermal stability and RP progression in patients. Further quantitative studies of additional RP-causing mutants at the molecular level in conjunction with clinical studies could potentially establish a new pathogenic mechanism for RP and possibly allow for a better prognosis for this disease.
EXPERIMENTAL PROCEDURES
Materials
All chemicals were from Sigma, unless noted otherwise. Tissue culture reagents, LipofectamineTM, goat anti-mouse IgG secondary antibody conjugated to Alexa Fluor® 488 (54), and wheat germ agglutinin coupled to Alexa Fluor® 633 were purchased from Invitrogen. The surfactant DDM was from Anatrace, Inc. Synthetic oligonucleotides were from Genelink, Inc. Mouse monoclonal 1D4 antibody (62), specific to the C terminus of rhodopsin, was purchased from the University of British Columbia, and the 1D5 peptide (TETSQVAPA, corresponding to the C-terminal epitope) was synthesized by the W. M. Keck Foundation Biotechnology Resource Laboratory at Yale University.
Mutagenesis
Site-directed mutagenesis of the synthetic bovine opsin gene (63) was carried out in the expression vector pMT4. The D190N and S186W mutant opsin genes were subcloned into the pACMV-tetO vector (64, 65) with the KpnI/NotI restriction sites as described previously and confirmed by DNA sequencing.
Stable Cell Lines
WT opsin and the D190N and S186W mutants were expressed as described previously (42, 43, 54). The DNA constructs were transfected into HEK293 cells using LipofectamineTM. Transfected cells were selected using the antibiotic Geneticin (300 μg/ml) for 2 weeks to generate a stable cell line.
Immunocytochemistry
For subcellular localization studies, HEK293 cells stably transfected with WT or mutant opsin were grown on glass coverslips. Protein expression was induced by adding tetracycline (2 μg/ml) and sodium butyrate (5 mm) to the growth medium for 48 h. Cells were then rinsed with cold Dulbecco's phosphate-buffered saline (DPBS), and the plasma membrane was stained with wheat germ agglutinin-Alexa Fluor® 633 conjugate (10 μg/ml) at 37 °C for 15 min. After washing the cells with cold DPBS, cells were fixed in 4% paraformaldehyde for 10 min, permeabilized with 0.02% Triton X-100 for 5 min, and blocked with 3% bovine serum albumin (BSA) in DPBS for 1 h. Cells were then incubated with mAb 1D4 (5 μg/ml) for 1 h, blocked with 3% BSA in DPBS again, followed by a 1-h incubation with Alexa Fluor® 488-conjugated goat anti-mouse IgG (4 μg/ml). Nucleus was then stained with Hoechst 33342 (1 μg/ml) for 10 min. After three washes with DPBS, the coverslips were mounted on glass slides with Antifade applied. The cells were visualized with a Zeiss LSM 510 NLO META laser scanning microscope, and the images were analyzed using ImageJ. Untransfected HEK293 cells, along with WT opsin not treated with primary antibody, were used as controls.
Expression and Purification of Rhodopsin
Cells were harvested 48 h post-induction, and rhodopsin was regenerated with 5 μm 11-cis-retinal overnight at 4 °C in the dark. All manipulations of the regenerated rhodopsin were conducted under dim red light.
Membranes were detergent-solubilized in 50 mm Tris, 100 mm NaCl, 1 mm CaCl2, 1% w/v DDM, 0.1 mm PMSF, pH 6.8, for 4 h at 4 °C. Rhodopsin was purified using the C-terminal 1D4 antibody coupled to Sepharose beads as described previously (42, 43, 66, 67). The beads were washed three times with 50 mm Tris, 100 mm NaCl, 0.1% DDM, pH 6.8, and three times with 50 mm sodium phosphate, 0.1% DDM, pH 6.5 (Buffer A). The rhodopsin samples were eluted in Buffer A containing 1D5 peptide for competitive binding to the antibody. The purified samples were then concentrated to ∼25 μm.
UV-visible Spectroscopy
All UV-visible spectra were recorded on a Shimadzu UV-2450 spectrophotometer. The molar extinction coefficients of the D190N and S186W mutants were found at room temperature using acid denaturation of 100-μl samples with 4 μl of 1 m HCl (final pH 1–2) (68). The extinction coefficients of the mutants were calculated using ϵ500 = 40,600 m−1 cm−1 for WT rhodopsin (Fig. 3) (69).
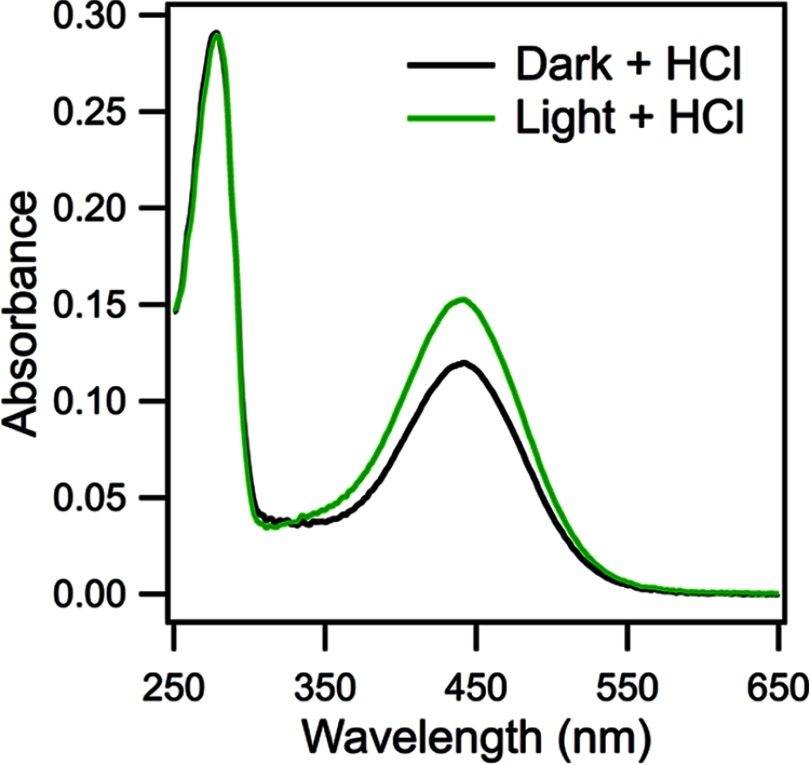
FIGURE 3.
Measurement of the extinction coefficient of the protonated Schiff base. The extinction coefficient of the protonated SB between all-trans-retinal and acid-denatured opsin is higher than that of the protonated SB between 11-cis-retinal and acid-denatured opsin. At room temperature, dark state D190N rhodopsin was acid-denatured with 4 μl of 1 m HCl and measured by UV-visible spectroscopy (black line), giving an extinction coefficient of 32,600 m−1 cm−1 for the 11-cis-retinal SB. A second sample of D190N was light-bleached for 1 min to convert all 11-cis-retinal to all-trans-retinal. The Meta II sample was denatured and measured by UV-visible spectroscopy (green line), giving an extinction coefficient of 41,600 m−1 cm−1 for the all-trans-retinal SB.
Thermal Decay
Thermal decay of dark state rhodopsin was monitored by UV-visible spectroscopy as described previously (42, 43). Buffer A was equilibrated in a water-jacketed cuvette at 37 or 55 °C. The temperature was confirmed using a thermal couple. At t = 0, ice-cold, concentrated rhodopsin solution was added to the heated buffer to give a final concentration of 1–3 μm. UV-visible spectra were recorded over time. Samples of 200 μl were removed from the cuvette at appropriate time points to ice-cold glass vials and stored on ice to quench thermal processes. The samples were used for two kinetic measurements, thermal isomerization and hydrolysis of the SB.
HPLC Analysis
Retinal was extracted from the samples removed during the thermal decay experiment using the procedure described previously. Briefly, the samples were incubated on ice for 10 min with hydroxylamine, pH 7, to break the SB linkage between retinal and the opsin protein. Methanol, dichloromethane, and hexane were added to denature opsin and extract the retinaloximes. The mixture of retinaloximes was analyzed by HPLC (Beckman Coulter SYSTEM GOLD® 125 Solvent Module) on a silica column (Beckman Coulter Ultrasphere 4.6 × 250 mm) and a mobile phase of hexane supplemented with 8% diethyl ether and 0.33% ethanol. Absorbance at 360 nm was used for detection (Beckman Coulter SYSTEM GOLD® 168 Detector) (Fig. 4).
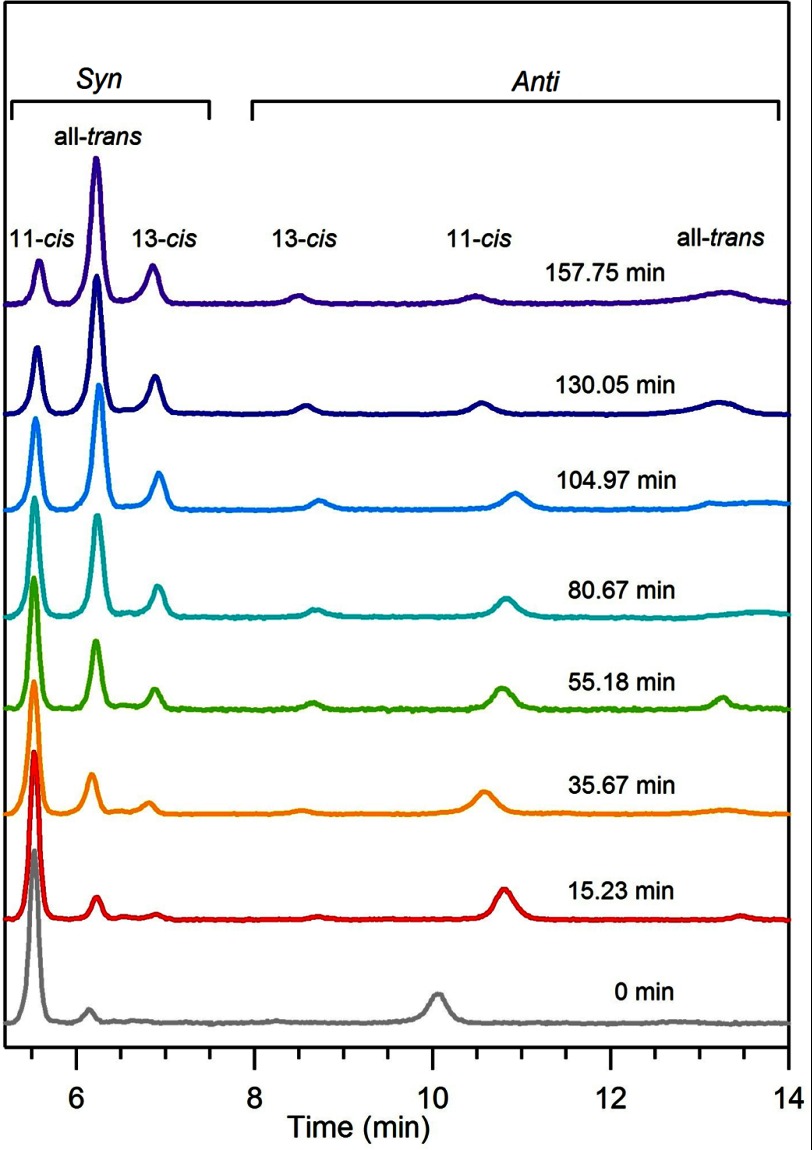
FIGURE 4.
HPLCs of the retinaloxime extracts containing the syn and anti peaks. Over time, the concentration of 11-cis-retinal decreases, and the concentration of all-trans (and 13-cis-)-retinal increases.
Acid Denaturation Assay
Samples of 100 μl from the thermal decay experiment were denatured with HCl at pH 1–2. UV-visible spectra were immediately taken for each denatured sample at room temperature.
Hydrolysis of Schiff Base in Meta II
The experiments were performed as described previously (44). Purified rhodopsin samples were photobleached with a Fiber-Lite Illuminator Model 190, equipped with a long pass filter (>500 nm), for 1 min at 20 °C to convert dark state rhodopsin to the Meta II active form. Bleaching was confirmed by the absence of a 500-nm peak on the UV-visible absorbance spectrum. At time t = 0, the bleached sample was added to Buffer A incubated at 37 or 55 °C. Aliquots of 100 μl were removed at appropriate time points, denatured using HCl at a final pH of 1–2, and analyzed by UV-visible spectroscopy.
Global Fitting
We analyzed the experimental data by global fitting (Igor Pro, version 6.2) using functions derived from our kinetic model for the thermal processes of rhodopsin (44). In our kinetic model (Fig. 2), the thermal decay of dark state rhodopsin (Rho) consists of two pathways. First, thermal isomerization of 11-cis-retinal in the binding site of rhodopsin yields all-trans-retinal bound to opsin (Tb) at a rate kisob, followed by hydrolysis of the deprotonated SB to give free all-trans-retinal (Tf) at a rate khydT. Second, hydrolysis of the protonated SB of Rho yields free 11-cis-retinal (Cf) and opsin at a rate khydc, followed by opsin-catalyzed thermal isomerization of Cf to Tf at a rate kiso.
Based on our kinetic model, we wrote rate equations for each thermal process of rhodopsin and solved them to obtain the fitting functions for our experimental data. The detailed derivation of the equations was presented in our previous study. The fitting functions are as follows.
Hydrolysis of SB in Meta II
The ratio [Tb]/[Tb]0 is directly proportional to the normalized A440. Therefore, Equation 1 is used to fit the experimental data of SB hydrolysis in the Meta II-like activated product.
 |
The normalized A440 is plotted as a function of time, which is fitted to Equation 1 using khydT as fitting parameter.
Thermal Decay
The ratio [Rho]/[Rho]0 is directly proportional to the normalized A500. Therefore, Equation 2 is used to fit the experimental data of thermal decay, the normalized A500 plotted as a function of time.
 |
The fitting parameters in Equation 2 are khydc and kisob.
HPLC Analysis
Equation 3 is used to fit the experimental data obtained from thermal isomerization, the fraction of 11-cis-retinal plotted as a function of time.
 |
where [11-cis] is the sum of the concentration of dark state rhodopsin ([Rho]) and free 11-cis-retinal ([Cf]). The fitting parameters in Equation 3 are khydc, kisob, and kiso.
Acid Denaturation Assay
Equation 4 is used to fit the experimental data of SB hydrolysis, the normalized A440 plotted as a function of time.
 |
where [link] is the sum of the concentration of dark state rhodopsin, [Rho], and all-trans-retinal bound to opsin, [Tf]. The ratio [link]/[Rho]0 is directly proportional to the normalized A440. Because khydT is determined independently (using Equation 1), the fitting parameters in Equation 4 are khydc and kisob.
In summary, Equations 2–4 share three rate constants, khydc, kisob, and kiso, which can be obtained by global fitting.
RESULTS
Immunocytochemistry
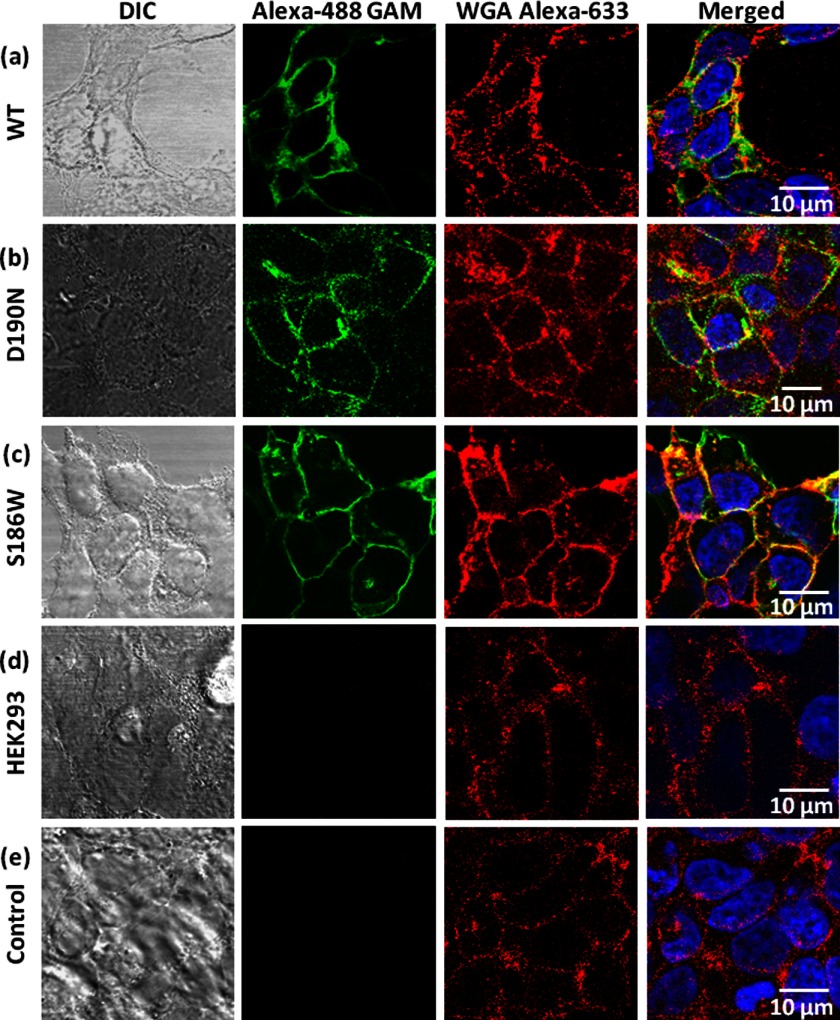
Before investigating the thermal processes of the S186W mutant and comparing them with those of WT rhodopsin and the D190N mutant, we examined the subcellular localization of the proteins to exclude misfolding and mistrafficking as the mechanism of RP for these mutations. We immunostained HEK293 cells stably transfected with the WT bovine opsin gene and the D190N and S186W mutants. Our results (Fig. 5) clearly show that the D190N and S186W opsins, similar to the WT opsin, did not form aggregate intracellularly, suggesting that the pathogenic mechanism for the mutants is not likely to be misfolding. A control of untransfected HEK293 cells (Fig. 5e) shows no fluorescence in the green channel.
FIGURE 5.
Immunolocalization of opsin in HEK293 cells. a, WT; b, D190N; c, S186W opsin; d, WT opsin not treated with primary antibody, and e, untransfected cells used as controls. The fluorescence images are side by side with the corresponding differential interference contrast (DIC) images; merged images are shown at right with the scale bars. The green, red, and blue channels show the opsin, plasma membrane, and nuclear staining, respectively.
Characterization of the S186W Mutant
The detergent-purified mutants were first characterized by UV-visible spectroscopy. All three dark state visual pigments have an absorbance maximum (λmax) of 500 nm (A500) and an additional peak at 280 nm corresponding to the absorbance of aromatic amino acids of opsin (A280) (Fig. 6). The absorbance ratios (A280/A500) for WT, D190N, and S186W are 1.7, 2.2, and 2.9, respectively. We obtained the extinction coefficient using the acid denaturation method (68). Acid denaturation with HCl at a final pH of 1–2 yields a peak at 440 nm, indicating the presence of protonated SB (70), for which we calculate the extinction coefficient to be 32,600 m−1 cm−1. From this value, the extinction coefficients of D190N and S186W rhodopsin were determined to be 38,000 and 36,300 m−1 cm−1, respectively (maximum errors of 10%), compared with 40,600 m−1 cm−1 for WT rhodopsin (69).
FIGURE 6.

UV-visible spectra of dark state (black curve) and acid-denatured (green curve) rhodopsin samples. a, WT; b, D190N, and c, S186W rhodopsin. Dark state WT and mutants have absorbance maxima of 500 nm. Addition of 4 μl of 1 m HCl reveals the protonated Schiff base, which absorbs at 440 nm. The 280-nm peak represents the absorbance of aromatic residues in the opsin protein.
Thermal Decay
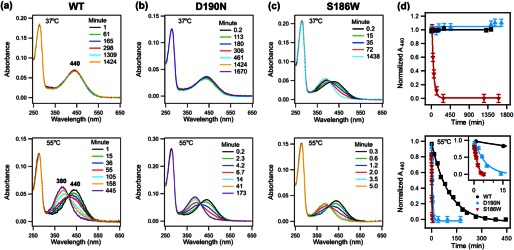
After spectral characterization of WT and mutant rhodopsin samples, we measured their rate of thermal decay, defined as the decrease of the 500-nm absorbance, at 37 and 55 °C. To initiate thermal decay, at time t = 0, purified rhodopsin was incubated at 37 or 55 °C. A series of UV-visible absorption spectra were obtained at various time points (Fig. 7, a–c). Over time, the A500 indicating dark state rhodopsin decreases, whereas the A380 increases due to the formation of free 11-cis-retinal (khydc), all-trans-retinal bound to opsin (kisob), and/or free all-trans-retinal (khydT). The spectra were normalized to the A280 to account for solvent evaporation and to the A500 at t = 0. The normalized A500 was plotted as a function of time (Fig. 7d). Although the kinetics of thermal decay for WT and D190N at 37 °C are too slow to monitor for completion under our experimental conditions, the half-lives were obtained by analyzing the initial slope and found to be 15 ± 1 and 7.0 ± 0.5 days for WT and D190N, respectively. In contrast, the S186W mutant undergoes complete decay in ∼8 h. Fitting the decay curve yields a half-life of 37 ± 1 min. However, at 55 °C, both the D190N and S186W mutations speed up the thermal decay process significantly compared with the WT (Fig. 7). The half-lives for S186W, D190N, and WT rhodopsin are 0.39 ± 0.01, 2.42 ± 0.05, and 70 ± 2 min, respectively. The thermal decay rate of S186W is 179 times faster than that of WT rhodopsin and 6.2 times faster than that of D190N at 55 °C.
FIGURE 7.
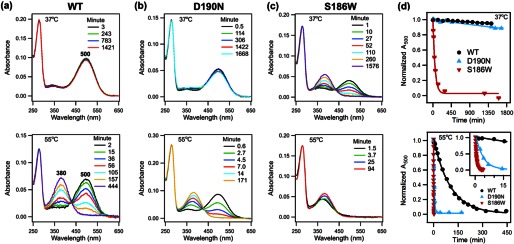
Thermal decay, UV-visible spectra of WT rhodopsin, D190N, and S186W mutants. a, WT; b, D190N, and c, S186W rhodopsin at 37 °C (top) and 55 °C (bottom). Over time, A500 decreases, and A380 increases, indicating thermal decay. d, normalized A500 plotted as a function of time. The fitted curve is added to guide the visualization of the decay trend.
HPLC Analysis
We then turned to the two components of thermal decay (Fig. 2), thermal isomerization and hydrolysis of SB. We used HPLC analysis to monitor the isomerization of both bound and free retinal in the samples of rhodopsin incubated at 37 and 55 °C. Fig. 8, a–c, shows the chromatographs of the HPLC analyses of the thermal decay products. Six isomers of retinaloxime were detected in order of appearance on the chromatograph as follows: they are 11-cis-15-syn, all-trans-15-syn, 13-cis-15-syn, 13-cis-15-anti, 11-cis-15-anti, and all-trans-15-anti, as presented in the Fig. 4. Only the syn peaks are shown in Fig. 8 for clarity because they are the predominant peaks. The peaks were fit into a Gaussian function to determine peak areas, which were then calibrated to the corresponding molar extinction coefficients at 360 nm (71). Over time, the 11-cis-retinal peak decreases, and the all-trans peak increases due to thermal isomerization of bound 11-cis-retinal (kisob) and/or isomerization of free 11-cis-retinal in the presence of opsin (kiso), as described in the kinetic model (Fig. 2). The fraction of 11-cis-retinal in each sample was plotted over time (Fig. 8d). At 37 °C, the trend of thermal isomerization agrees with that of thermal decay: WT rhodopsin barely isomerizes and D190N isomerizes slightly faster than WT, whereas S186W isomerizes considerably faster than WT rhodopsin and D190N (quantitative analysis for the rate constants will be presented below). At 55 °C, although both the D190N and S186W mutations increase the rate of thermal isomerization, S186W has a larger effect than D190N (Fig. 8d, inset).
FIGURE 8.
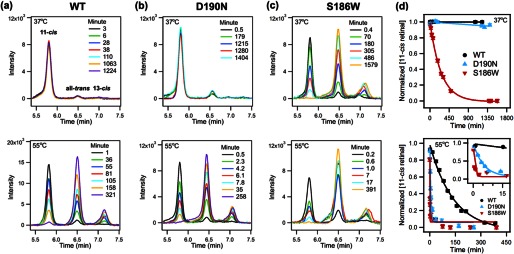
Thermal isomerization, HPLC analysis of WT rhodopsin, D190N, and S186W mutants. a, WT; b, D190N, and c, S186W rhodopsin at 37 °C (top) and 55 °C (bottom). Over time, the concentration of 11-cis-retinal decreases, and the concentration of all-trans- and 13-cis-retinal increases, indicating isomerization. d, normalized concentration of 11-cis-retinal plotted as a function of time. The fitted curve is added to guide the visualization of the decay trend.
Acid Denaturation Assay
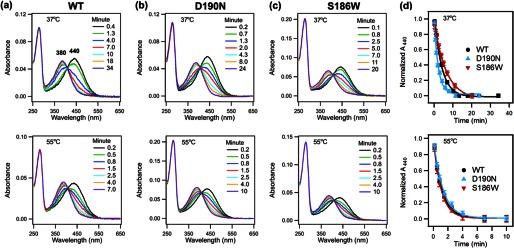
To study the second pathway of thermal decay, hydrolysis of the SB (Fig. 2), we used an acid denaturation assay to measure the amount of intact SB in thermal decay samples over time. UV-visible spectra were taken for each denatured sample at room temperature (Fig. 9, a–c). The spectra were fit into two Gaussian functions to obtain the A440, characteristic of an intact protonated SB, and the A380, characteristic of free retinal after hydrolysis of the SB. The A440 decreases and the A380 increases due to hydrolysis of 11-cis-retinal from dark state rhodopsin (khydc) and/or hydrolysis of all-trans-retinal from activated rhodopsin (khydT). The A440, normalized to the A440 at t = 0, was plotted over time (Fig. 9d). Interestingly, just like the rate of thermal isomerization increases more for S186W than for D190N, the rate of SB hydrolysis also increases in the same pattern, suggesting that the isomerization and hydrolysis pathways are both affected by the mutations, and S186W has a larger effect. Similarly, at 37 °C, the drop of the 440-nm peak for S186W is orders of magnitude faster than that for WT rhodopsin and the D190N mutant. The 440-nm peak for the D190N samples does not change within experimental error after incubation for 20–25 h. Quantitative analysis of the rates by fitting the data into the kinetic model (Fig. 2) will be presented below.
FIGURE 9.
Hydrolysis of Schiff base in rhodopsin, acid denaturation assay for WT rhodopsin, D190N, and S186W mutants. a, WT; b, D190N, and c, S186W rhodopsin at 37 °C (top) and 55 °C (bottom). Over time, A440 decreases, and A380 increases, indicating hydrolysis of the SB. d, normalized A440 plotted as a function of time. The fitted curve is added to guide the visualization of the decay trend.
Hydrolysis of Schiff Base in Meta II
As reported previously (44), to use the kinetic model (Fig. 2) to analyze the kinetic data obtained from the above three experiments, thermal decay, thermal isomerization, and hydrolysis of SB, we need to independently measure the rate of hydrolysis of SB in the activated intermediate, khydT (Fig. 2). To do so, a purified sample was photobleached for 1 min so that the 500-nm peak for the dark state completely transitioned to the 380-nm peak for Meta II. The bleached sample was then incubated at 37 or 55 °C. Aliquots were taken over time and denatured by HCl. UV-visible spectra were taken for each denatured sample (Fig. 10, a–c). The spectra were fit into two Gaussian functions to obtain the A440, which represents all-trans-retinal bound to opsin, and A380, which corresponds to free all-trans-retinal after hydrolysis. Over time, the 440-nm peak decreases and the 380-nm peak increases, indicating the hydrolysis of the SB. The A440, normalized to the A440 at t = 0, was plotted over time (Fig. 10d). In contrast to the large increase in dark state reaction rates, our results show that the D190N and S186W mutants have little impact on SB hydrolysis in the active state. At 37 °C, the D190N mutation accelerates khydT by just 1.7 times the WT rate. S186W has an approximately equal but opposite effect; it slows khydT by 1.6 times. At 55 °C, khydT is the same for WT and S186W, and D190N is 1.2-fold slower.
FIGURE 10.
Hydrolysis of Schiff base in Meta II-like activated product, acid denaturation assay for activated WT rhodopsin, D190N, and S186W mutants. a, WT; b, D190N, and c, S186W rhodopsin at 37 °C (top) and 55 °C (bottom). Over time, A440 decreases, and A380 increases, indicating hydrolysis of SB. d, normalized A440 plotted as a function of time and fit to obtain the rate constant khydT.
Rate Constants of Individual Thermal Processes
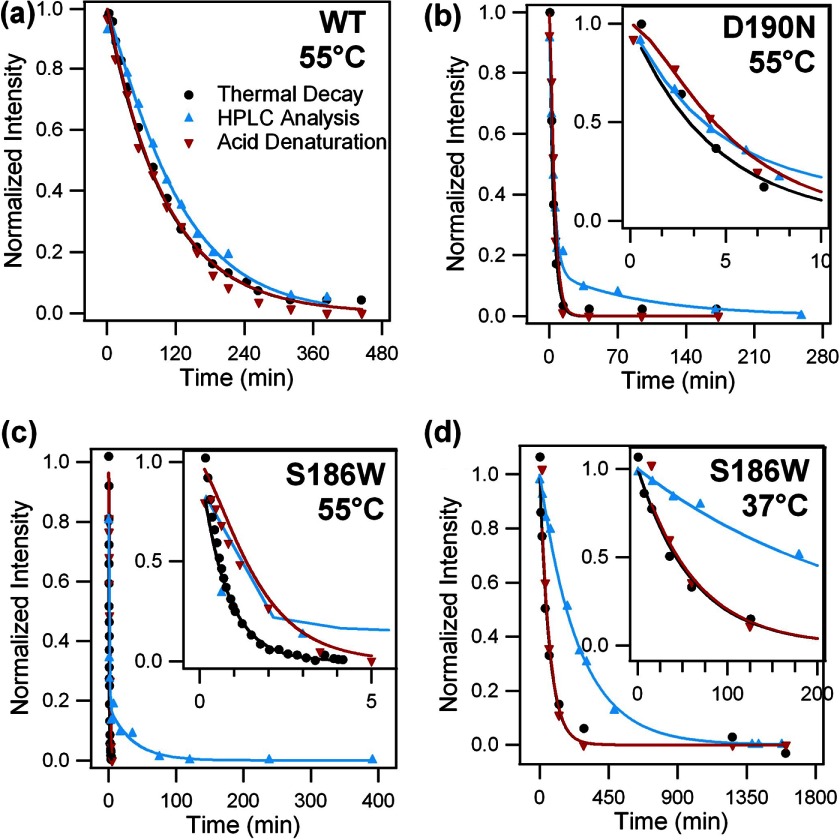
To obtain the individual rate constants khydc, kisob, and kiso, we used the solution of the kinetic model (44) to analyze the kinetic data. We measured the rates of hydrolysis of SB in Meta II by fitting data shown in Fig. 10d with a single exponential function to obtain khydT. Then, we performed global fitting of the kinetic data obtained in the experiments of thermal decay (Fig. 7d), thermal isomerization (Fig. 8d), and hydrolysis of SB (Fig. 9d) for WT, D190N, and S186W at 55 °C and for S186W at 37 °C. Because we repeated each kinetic measurement at least three times, we did global fitting to replicates of the same condition together and reported the fitting parameters in Table 1. In deriving the equation for analyzing the kinetic data of SB hydrolysis (acid denaturation) for dark state rhodopsin, we made an assumption that the error of quantifying the intact SB in rhodopsin due to the difference in the extinction coefficients of the 11-cis (ϵcis) and all-trans-retinal chromophore (ϵtrans) is negligible. Detailed verification of this assumption can be found under the “Discussion.” We did not use the kinetic model to analyze the data for WT and D190N at 37 °C because the decay rates are too slow to be measured. The half-lives of thermal decay were found to be 15 and 7 days. Because of solvent evaporation, the full decay cannot be measured in our experiments. Therefore, we focused on analyzing the kinetic data for WT, D190N, and S186W at 55 °C and S186W at 37 °C. The results of one representative global fitting are shown in Fig. 11, and the rate constants obtained from global fittings are presented in Table 1. Thus, we can quantitatively explore the thermal properties of S186W and compare the effects of S186W with those of D190N on the kinetics of thermal reactions.
TABLE 1.
Rate constants and half-lives (± S.D.) of thermal processes of WT rhodopsin, D190N, and S186W mutants
All experiments were performed 3–5 times.
| Sample | Rate constants, min−1 (half-lives, min) |
Contribution of each pathway |
||||
|---|---|---|---|---|---|---|
| kisob | khydc | kiso | khydT | kisob | khydc | |
| % | % | |||||
| WT, 55 °C | 0.005 ± 0.001 (126 ± 26) | 0.004 ± 0.001 (182 ± 61) | 0.003 ± 0.002 (236 ± 188) | 0.888 ± 0.034 (0.781 ± 0.029) | 59 ± 16 | 41 ± 16 |
| D190N, 55 °C | 0.233 ± 0.022 (2.972 ± 0.283) | 0.115 ± 0.021 (6 ± 1) | 0.138 ± 0.051 (5 ± 2) | 0.751 ± 0.023 (0.923 ± 0.029) | 67 ± 9 | 33 ± 7 |
| S186W, 55 °C | 1.549 ± 0.043 (0.447 ± 0.013) | 0.251 ± 0.037 (2.762 ± 0.403) | 0.047 ± 0.023 (15 ± 7) | 0.929 ± 0.035 (0.746 ± 0.028) | 86 ± 4 | 14 ± 2 |
| S186W, 37 °C | 0.003 ± 0.001 (245 ± 44) | 0.017 ± 0.001 (41 ± 2) | 0.005 ± 0.001 (142 ± 8) | 0.153 ± 0.003 (4.532 ± 0.075) | 14 ± 3 | 86 ± 5 |
FIGURE 11.
Global fitting of kinetic data for the thermal processes of WT rhodopsin, D190N, and S186W mutants. a, WT rhodopsin at 55 °C; b, D190N at 55 °C; c, S186W at 55 °C, and d, S186W at 37 °C. The results of thermal decay (black) are shown as the normalized A500 plotted as a function of time. The results of HPLC analysis (blue) are shown as the concentration of 11-cis-retinal plotted over time. The results of the acid denaturation assay (red) are shown as the normalized A440 plotted as a function of time. Global fitting was used to obtain the rate constants of individual thermal processes, which are presented in Table 1.
DISCUSSION
This work focuses on the pathogenic S186W mutation in the rhodopsin gene. Although the S186W mutation is associated with RP, it has not been previously characterized at the molecular level. Our study provides a quantitative description of the effects of the S186W mutation on the thermal properties of rhodopsin. This work also supplements the previous study on the thermal decay of the D190N mutant by investigating the effects of D190N on the rates of individual thermal reactions involved in thermal decay, thermal isomerization and SB hydrolysis. Our study introduces a new approach for molecular level studies of pathogenic rhodopsin mutations to show the effect of mutations on individual thermal reactions of rhodopsin. These individual reactions set the limit of sensitivity of dim-light vision. Hence, a quantitative comparison of their rates for S186W and D190N allows for a fundamental understanding of the mutations' effects on the thermal stability of rhodopsin and correlation of these effects with the pace of disease progression in RP patients.
Mutant Rhodopsins Localize to Membrane
We observed that WT and mutant opsins traffic to the plasma membrane in HEK293 cells, suggesting that the proteins are properly folded to an extent that cells are able to tolerate the mutations and transport the opsin to the plasma membrane. Studies of D190N folding, localization, and photoactivity have been performed in bovine, murine, and human rhodopsin with sometimes differing results, so the question of folding should be interpreted with caution until it can be definitively answered in a human model. Although previous in vitro studies showed human D190N to be misfolded and retained in the endoplasmic reticulum, the recent development of a knock-in mouse model heterozygous for the murine D190N mutation faithfully recapitulates the features of human disease and showed that the mutant rhodopsin indeed localizes to the membrane (72). Moreover, we could purify the bovine D190N and S186W mutants and show its activation in response to photobleaching, which attests that the D190N and S186W mutants retain WT-like function. Although the mutants had a higher A280/A500 ratio than WT rhodopsin, this was likely due to the change in the binding site, such that mutant opsin may not be regenerated to form visual pigment as efficiently as WT opsin under our experimental conditions; it is also possible that a small amount of thermal bleaching occurred during sample preparation. Thus, our experimental results together with the previous animal model study (72) indicate that, although the mutations necessarily change the protein structure at the molecular level, the structural changes are tolerated at the cellular level, so misfolding or mistrafficking is not likely to be the predominant molecular mechanism of RP for these mutations. Instead, we hypothesized that the RP genotypes are associated with thermal destabilization of rhodopsin.
Rate of SB Hydrolysis, Difference in Extinction Coefficients
In analyzing the rate of hydrolysis of SB in dark state rhodopsin, we made an assumption that the error of quantifying the intact SB in rhodopsin due to the difference in the extinction coefficients of the 11-cis(ϵcis) and all-trans-retinal chromophore(ϵtrans) is negligible. Here, we verify this assumption. In the kinetic model, two thermal processes involve SB hydrolysis as follows: 1) hydrolysis of the protonated SB of Rho at a rate khydc to form Cf, and 2) hydrolysis of the deprotonated SB of Tb at a rate khydT to form Tf. The concentration of species containing an intact SB (link) is determined by UV-visible absorption spectroscopy in the acid denaturation experiment (Equation 5).
 |
Hence, we get Equation 6.
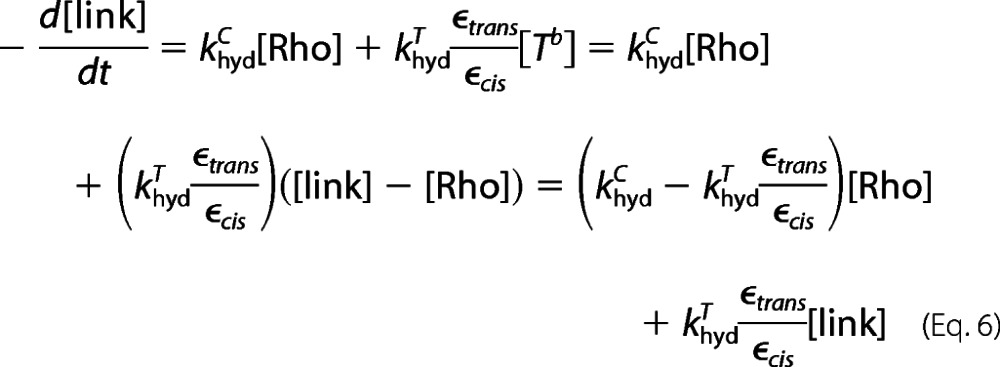 |
Substituting [Rho] from Equation 2, we obtain Equations 7–9.
 |
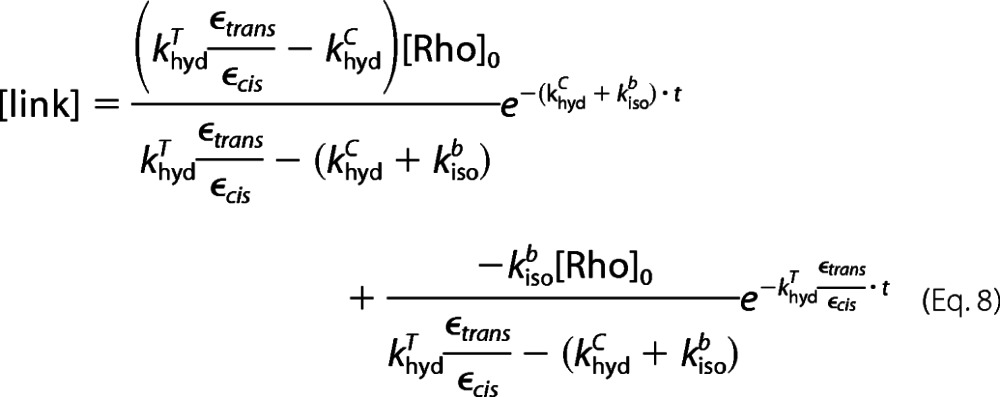 |
 |
Equation 8 is the fitting function for analyzing the rate of SB hydrolysis when the difference in ϵtrans and ϵcis is taken into consideration. However, Equation 9 is the fitting function when the difference is neglected, as presented in our previous study (44). Comparing Equations 8 and 9, we can see that there is an additional constant of ϵtrans/ϵcis in the new equation.
By using the new fitting function (Equation 8), all rate constants are obtained and listed in parentheses in Table 2, alongside the rates reported in Table 1, which were calculated without consideration of the difference in extinction coefficients. The khydT rate constant is obtained by independent experiment, so one value is used in both cases. Within experimental error, the rate constants obtained using both Equations 8 and 9 are the same. Hence, although we assume that there is negligible error in quantifying the intact SB in dark state rhodopsin due to the difference in the extinction coefficients of 11-cis-retinal (ϵcis) and all-trans-retinal (ϵtrans), this assumption is valid.
TABLE 2.
Rate constants and half-lives (± S.D.) of thermal processes of WT rhodopsin, D190N, and S186W mutants after accounting for the difference between ϵtrans and ϵcis
| Sample | Rate constants, min−1 (new model) |
Contribution of each pathway |
||||
|---|---|---|---|---|---|---|
| khydb | khydc | kiso | khydT | kisob | khydc | |
| % | % | |||||
| WT, 55 °C | 0.005 ± 0.001 (0.005 ± 0.001) | 0.004 ± 0.001 (0.004 ± 0.001) | 0.003 ± 0.002 (0.003 ± 0.002) | 0.888 ± 0.034 (0.888 ± 0.034) | 59 ± 16 (59 ± 16) | 41 ± 16 (41 ± 16) |
| D190N, 55 °C | 0.233 ± 0.022 (0.241 ± 0.021) | 0.115 ± 0.021 (0.100 ± 0.020) | 0.138 ± 0.051 (0.115 ± 0.050) | 0.751 ± 0.023 (0.751 ± 0.023) | 67 ± 9 (71 ± 9) | 33 ± 7 (29 ± 6) |
| S186W, 55 °C | 1.549 ± 0.043 (1.566 ± 0.045) | 0.251 ± 0.037 (0.213 ± 0.038) | 0.047 ± 0.023 (0.042 ± 0.025) | 0.929 ± 0.035 (0.929 ± 0.035) | 86 ± 4 (88 ± 4) | 14 ± 2 (12 ± 2) |
| S186W, 37 °C | 0.003 ± 0.001 (0.003 ± 0.001) | 0.017 ± 0.001 (0.017 ± 0.001) | 0.005 ± 0.001 (0.005 ± 0.001) | 0.153 ± 0.003 (0.153 ± 0.003) | 14 ± 3 (15 ± 3) | 86 ± 5 (85 ± 5) |
Comparison of Thermal Kinetics of S186W at 37 and 55 °C
To investigate the effects of S186W on the thermal properties of rhodopsin, we obtained the individual rate constants of thermal isomerization (kisob) and hydrolysis of SB in dark state (khydc) by applying our kinetic model at 37 and 55 °C. Hence, we can quantitatively compare the individual rates of thermal isomerization and SB hydrolysis of S186W at the two different temperatures, 37 and 55 °C (Table 1), which reveals two characteristic impacts of S186W on the kinetics of thermal reactions. First, when temperature increases from 37 to 55 °C, the rate constants of thermal isomerization (kisob) and SB hydrolysis (khydc) increase by 517 and 15 times, respectively. From this temperature dependence, the activation energies of thermal isomerization and SB hydrolysis can be roughly estimated to be 70 and 30 kcal/mol, respectively. Although these are large activation energies, they are not as high as those for WT thermal isomerization (125 kcal/mol) and SB hydrolysis (122 kcal/mol), which were obtained at temperatures around 55 °C (44). Second, at 37 °C, thermal isomerization accounts for 14 ± 3% of the thermal decay of the S186W, whereas SB hydrolysis accounts for 86 ± 5% (Table 1). These contributions change at 55 °C to 86 ± 4% for thermal isomerization and 14 ± 2% for SB hydrolysis. The shift in contributions reflects the difference in the activation energies of the two reactions. Because the process of thermal isomerization has higher activation energy, the contribution of thermal isomerization to the overall thermal decay process becomes more significant at a higher temperature (55 °C).
Rates of Thermal Isomerization and SB Hydrolysis of S186W, D190N, and WT
We studied the kinetics of thermal decay of S186W and compared it with that of WT and D190N. At 37 °C, we observed that S186W thermally decays 2 orders of magnitude faster than D190N and 3 orders of magnitude faster than WT under our experimental conditions.
The thermal decay half-lives for the D190N mutant and WT rhodopsin at 55 °C were previously measured by Janz and Farrens (52). They found that the half-lives of WT rhodopsin and D190N are 38.5 ± 3 and 2.4 ± 0.4 min, in qualitative agreement with our results. The observed differences in rate could be due to a slight difference in temperature control because the high activation energy of WT thermal decay suggests that a deviation of 1 °C in maintaining the temperature at 55 °C could lead to an ∼2-fold difference in the rates.
We further compared the rate constants of thermal isomerization (kisob) and hydrolysis of SB in dark state (khydc) of S186W, D190N, and WT rhodopsin at 55 °C. Although running the experiment at 55 °C is not physiologically relevant, this higher temperature allowed us to analyze quantitatively the rates of thermal reactions in D190N for a direct comparison with S186W. Such analysis clearly shows that the impact of S186W on both thermal isomerization and SB hydrolysis in dark state rhodopsin is larger than that of D190N under our experimental conditions.
Mutant Effects on Dark State Versus Active State
Moreover, our results demonstrate that the mutations, which specifically perturb the hydrogen bond network of rhodopsin, increase the rate of thermal isomerization and hydrolysis of SB (the dark state thermal reactions that contribute to thermal decay) without greatly affecting the stability of the photoactivated state or the ability of opsin to catalyze isomerization of free 11-cis-retinal. Unlike the kinetics of thermal processes in the dark state, the rate of SB hydrolysis in the Meta II-like photo-product (khydT) is within 2-fold of WT rhodopsin at both 37 and 55 °C. Hence, the hydrogen bond network likely exerts its stabilizing influence on dark state rhodopsin and is much less important after activation.
Association of Thermal Stability and Early Symptoms of RP
Our characterization of the thermal properties of the S186W and D190N mutations reveals an association between the thermal stability of rhodopsin and the early symptoms of RP. Normally, the hydrogen bond network of WT rhodopsin minimizes discrete dark noise by preventing thermal isomerization and suppresses constitutive activation by preventing hydrolysis of SB (16, 42, 43, 51, 53, 73). When mutations eliminate interactions in the hydrogen bond network, these restraints are weakened. Even a slight increase in the rates of thermal isomerization or SB hydrolysis would be greatly magnified by the abundance of rhodopsin in the eye, i.e. ∼1016 molecules per human eye. Thus, the increased rates of thermal isomerization and hydrolysis of SB in the S186W and D190N mutants likely correlate with a higher threshold of light intensity needed for vision and the early symptom of night blindness in RP. In addition, up to 35% of RP patients experience photopsia, the false flashes of light seen in the early stages of the disease (6, 32). The elevated continuous and discrete dark noise related to thermal destabilization could be associated with photopsia as well as night blindness.
Clinical Studies, Comparison of S186W and D190N
Most clinical studies reporting the phenotypes of patients affected by S186W and D190N describe features such as visual acuity, visual field, fundoscopy, and ERG responses. However, it is difficult to compare the phenotypes of S186W and D190N patients in terms of visual acuity, visual field, and fundoscopy, because various reports provide varying degrees of detail. Hence, we focused on the quantitative comparison of ERG responses. Ruther et al. (11) and Matias-Florentino et al. (59) have reported cases of 30- and 36-year-old S186W-affected patients, respectively, who had either barely recordable or completely abolished ERGs. However, Fishman et al. (74) reported that D190N-affected patients at ages of 36 and 80 years had ERGs with delayed but still detectable responses. Additionally, Tsui et al. (60) reported a D190N-affected patient who at 47 years of age had a reduced ERG response, which continued to decrease at a rate of about 3% per year but remained recordable. This comparison indicates that S186W patients seem to experience more severe symptoms of RP at younger ages than D190N patients, pointing to a faster rate of disease progression in S186W patients. Moreover, Ruther et al. (11) reported an S186W-affected patient who presented with greatly reduced rod ERGs at the age of 6 years. Meanwhile, Tsui et al. (60) reported two patients aged 7 and 11 who carried the D190N mutation but were clinically asymptomatic. This further demonstrates that S186W causes earlier presentation as well as faster progression of RP compared with D190N.
Thermal Stability and RP Progression of S186W and D190N
Our molecular studies allow for a comprehensive comparison of the impacts of the S186W and D190N mutations on the kinetics of thermal reactions of dark state rhodopsin. Although our experimental conditions are far from resembling the complex cellular environments of rod photoreceptor cells, our kinetic studies clearly reveal the differences in the intrinsic thermal properties of S186W and D190N at the molecular level. The S186W mutant has a much stronger impact on the thermal stability of rhodopsin, which is qualitatively consistent with the faster progression of RP in patients bearing the S186W mutation. A quantitative correlation, if one exists, remains to be found when these studies can be expanded to a larger number of RP-causing mutants.
Significance of Molecular Level Characterizations
To fully elucidate the etiology of retinal degenerative diseases will require more research on all points of the biological spectrum of understanding, from clinical reports to animal models, cellular systems, and molecular details. Our molecular studies enable the expansion of this spectrum to a level of detail not before possible, kinetic measurements of the individual chemical pathways underlying the thermal activation of rhodopsin. Extending our experimental approach to a systematic study of other pathogenic mutations, in conjunction with clinical research, holds promise to uncover knowledge that would help improve the prognosis of RP patients.
Acknowledgments
We thank Dr. Joseph Wolenski for assistance with confocal microscopy and Dr. Phillip Reeves (University of Essex) for the HEK293 cells and pACMV-tetO expression vector. We also thank Dr. Ching-Hwa Sung (Weill Medical College of Cornell University) for providing the B6–30 antibody in the preliminary immunofluorescence experiments on HEK293 cells.
Footnotes
- RP
- retinitis pigmentosa
- SB
- Schiff base
- Meta II
- metarhodopsin II
- DDM
- n-dodecyl-β-d-maltoside
- Rho
- rhodopsin
- ERG
- electroretinogram.
REFERENCES
- 1. Shastry B. S. (1994) Retinitis pigmentosa and related disorders: phenotypes of rhodopsin and peripherin/RDS mutations. Am. J. Med. Genet. 52, 467–474 [DOI] [PubMed] [Google Scholar]
- 2. Berson E. L. (1996) Retinitis pigmentosa: unfolding its mystery. Proc. Natl. Acad. Sci. U.S.A. 93, 4526–4528 [DOI] [PMC free article] [PubMed] [Google Scholar]
- 3. Kalloniatis M., Fletcher E. L. (2004) Retinitis pigmentosa: understanding the clinical presentation, mechanisms, and treatment options. Clin. Exp. Optom. 87, 65–80 [DOI] [PubMed] [Google Scholar]
- 4. Kennan A., Aherne A., Humphries P. (2005) Light in retinitis pigmentosa. Trends Genet. 21, 103–110 [DOI] [PubMed] [Google Scholar]
- 5. Hartong D. T., Berson E. L., Dryja T. P. (2006) Retinitis pigmentosa. Lancet 368, 1795–1809 [DOI] [PubMed] [Google Scholar]
- 6. Shintani K., Shechtman D. L., Gurwood A. S. (2009) Review and update: current treatment trends for patients with retinitis pigmentosa. Optometry 80, 384–401 [DOI] [PubMed] [Google Scholar]
- 7. Rakoczy E. P., Kiel C., McKeone R., Stricher F., Serrano L. (2011) Analysis of disease-linked rhodopsin mutations based on structure, function, and protein stability calculations. J. Mol. Biol. 405, 584–606 [DOI] [PubMed] [Google Scholar]
- 8. Sung C. H., Schneider B. G., Agarwal N., Papermaster D. S., Nathans J. (1991) Functional heterogeneity of mutant rhodopsins responsible for autosomal dominant retinitis pigmentosa. Proc. Natl. Acad. Sci. U.S.A. 88, 8840–8844 [DOI] [PMC free article] [PubMed] [Google Scholar]
- 9. Sung C. H., Davenport C. M., Nathans J. (1993) Rhodopsin mutations responsible for autosomal dominant retinitis pigmentosa. Clustering of functional classes along the polypeptide chain. J. Biol. Chem. 268, 26645–26649 [PubMed] [Google Scholar]
- 10. Mendes H. F., van der Spuy J., Chapple J. P., Cheetham M. E. (2005) Mechanisms of cell death in rhodopsin retinitis pigmentosa: implications for therapy. Trends Mol. Med. 11, 177–185 [DOI] [PubMed] [Google Scholar]
- 11. Ruther K., vonBallestrem C. L., Muller A., Kremmer S., Eckstein A., ApfelstedtSylla E., Gal A., Zrenner E. (1995) in Clinical Features of Autosomal Dominant Retinitis Pigmentosa Associated with the SER 186TRP Mutation of Rhodopsin (Anderson R. E., LaVail M. M., Hollyfield J. G., eds) pp. 303–312, Plenum Publishing Corp., New York [Google Scholar]
- 12. Palczewski K., Kumasaka T., Hori T., Behnke C. A., Motoshima H., Fox B. A., Le Trong I., Teller D. C., Okada T., Stenkamp R. E., Yamamoto M., Miyano M. (2000) Crystal structure of rhodopsin: A G protein-coupled receptor. Science 289, 739–745 [DOI] [PubMed] [Google Scholar]
- 13. Menon S. T., Han M., Sakmar T. P. (2001) Rhodopsin: structural basis of molecular physiology. Physiol. Rev. 81, 1659–1688 [DOI] [PubMed] [Google Scholar]
- 14. Okada T., Ernst O. P., Palczewski K., Hofmann K. P. (2001) Activation of rhodopsin: new insights from structural and biochemical studies. Trends Biochem. Sci. 26, 318–324 [DOI] [PubMed] [Google Scholar]
- 15. Filipek S., Stenkamp R. E., Teller D. C., Palczewski K. (2003) G protein-coupled receptor rhodopsin: a prospectus. Annu. Rev. Physiol. 65, 851–879 [DOI] [PMC free article] [PubMed] [Google Scholar]
- 16. Li J., Edwards P. C., Burghammer M., Villa C., Schertler G. F. (2004) Structure of bovine rhodopsin in a trigonal crystal form. J. Mol. Biol. 343, 1409–1438 [DOI] [PubMed] [Google Scholar]
- 17. Okada T., Sugihara M., Bondar A. N., Elstner M., Entel P., Buss V. (2004) The retinal conformation and its environment in rhodopsin in light of a new 2.2 Å crystal structure. J. Mol. Biol. 342, 571–583 [DOI] [PubMed] [Google Scholar]
- 18. Palczewski K. (2006) G protein-coupled receptor rhodopsin. Annu. Rev. Biochem. 75, 743–767 [DOI] [PMC free article] [PubMed] [Google Scholar]
- 19. Ridge K. D., Palczewski K. (2007) Visual rhodopsin sees the light: structure and mechanism of G protein signaling. J. Biol. Chem. 282, 9297–9301 [DOI] [PubMed] [Google Scholar]
- 20. Gleim S., Hwa J. (2008) in Visual Transduction and Non-visual Light Perception (Tombran-Tink J., Barnstable C. J., eds) pp. 171–196, Humana Press Inc., Totowa, NJ [Google Scholar]
- 21. Ahuja S., Hornak V., Yan E. C., Syrett N., Goncalves J. A., Hirshfeld A., Ziliox M., Sakmar T. P., Sheves M., Reeves P. J., Smith S. O., Eilers M. (2009) Helix movement is coupled to displacement of the second extracellular loop in rhodopsin activation. Nat. Struct. Mol. Biol. 16, 168–175 [DOI] [PMC free article] [PubMed] [Google Scholar]
- 22. Papermaster D. S., Dreyer W. J. (1974) Rhodopsin content in the outer segment membranes of bovine and frog retinal rods. Biochemistry 13, 2438–2444 [DOI] [PubMed] [Google Scholar]
- 23. Hubbard R., Wald G. (1951) The mechanism of rhodopsin synthesis. Proc. Natl. Acad. Sci. U.S.A. 37, 69–79 [DOI] [PMC free article] [PubMed] [Google Scholar]
- 24. Hug S. J., Lewis J. W., Einterz C. M., Thorgeirsson T. E., Kliger D. S. (1990) Nanosecond photolysis of rhodopsin: evidence for a new, blue-shifted intermediate. Biochemistry 29, 1475–1485 [DOI] [PubMed] [Google Scholar]
- 25. Randall C. E., Lewis J. W., Hug S. J., Bjorling S. C., Eisnershanas I., Friedman N., Ottolenghi M., Sheves M., Kliger D. S. (1991) J. Am. Chem. Soc. 113, 3473–3485 [Google Scholar]
- 26. Schoenlein R. W., Peteanu L. A., Mathies R. A., Shank C. V. (1991) The first step in vision: femtosecond isomerization of rhodopsin. Science 254, 412–415 [DOI] [PubMed] [Google Scholar]
- 27. Pan D., Ganim Z., Kim J. E., Verhoeven M. A., Lugtenburg J., Mathies R. A. (2002) Time-resolved resonance Raman analysis of chromophore structural changes in the formation and decay of rhodopsin's BSI intermediate. J. Am. Chem. Soc. 124, 4857–4864 [DOI] [PMC free article] [PubMed] [Google Scholar]
- 28. Lüdeke S., Lórenz Fonfría V. A., Siebert F., Vogel R. (2006) Time-resolved rapid-scan Fourier transform infrared difference spectroscopy on a noncyclic photosystem: rhodopsin photointermediates from Lumi to Meta II. Biopolymers 83, 159–169 [DOI] [PubMed] [Google Scholar]
- 29. Smith S. O. (2010) Structure and activation of the visual pigment rhodopsin. Annu. Rev. Biophys. 39, 309–328 [DOI] [PubMed] [Google Scholar]
- 30. Fung B. K., Hurley J. B., Stryer L. (1981) Flow of information in the light-triggered cyclic nucleotide cascade of vision. Proc. Natl. Acad. Sci. U.S.A. 78, 152–156 [DOI] [PMC free article] [PubMed] [Google Scholar]
- 31. Burns M. E., Arshavsky V. Y. (2005) Beyond counting photons: trials and trends in vertebrate visual transduction. Neuron 48, 387–401 [DOI] [PubMed] [Google Scholar]
- 32. Bhatti M. T. (2006) Retinitis pigmentosa, pigmentary retinopathies, and neurologic diseases. Curr. Neurol. Neurosci. Rep. 6, 403–413 [DOI] [PubMed] [Google Scholar]
- 33. Barlow H. B. (1956) Retinal noise and absolute threshold. J. Opt. Soc. Am. 46, 634–639 [DOI] [PubMed] [Google Scholar]
- 34. Baylor D. A., Lamb T. D., Yau K. W. (1979) Responses of retinal rods to single photons. J. Physiol. 288, 613–634 [PMC free article] [PubMed] [Google Scholar]
- 35. Ashmore J. F., Falk G. (1977) Dark noise in retinal bipolar cells and stability of rhodopsin in rods. Nature 270, 69–71 [DOI] [PubMed] [Google Scholar]
- 36. Baylor D. A., Matthews G., Yau K. W. (1980) Two components of electrical dark noise in toad retinal rod outer segments. J. Physiol. 309, 591–621 [DOI] [PMC free article] [PubMed] [Google Scholar]
- 37. Luo D. G., Yue W. W., Ala-Laurila P., Yau K. W. (2011) Activation of visual pigments by light and heat. Science 332, 1307–1312 [DOI] [PMC free article] [PubMed] [Google Scholar]
- 38. Robinson P. R., Cohen G. B., Zhukovsky E. A., Oprian D. D. (1992) Constitutively active mutants of rhodopsin. Neuron 9, 719–725 [DOI] [PubMed] [Google Scholar]
- 39. Dryja T. P., Berson E. L., Rao V. R., Oprian D. D. (1993) Heterozygous missense mutation in the rhodopsin gene as a cause of congenital stationary night blindness. Nat. Genet. 4, 280–283 [DOI] [PubMed] [Google Scholar]
- 40. Rao V. R., Cohen G. B., Oprian D. D. (1994) Rhodopsin mutation G90D and a molecular mechanism for congenital night blindness. Nature 367, 639–642 [DOI] [PubMed] [Google Scholar]
- 41. Cohen G. B., Yang T., Robinson P. R., Oprian D. D. (1993) Constitutive activation of opsin: influence of charge at position 134 and size at position 296. Biochemistry 32, 6111–6115 [DOI] [PubMed] [Google Scholar]
- 42. Liu J., Liu M. Y., Nguyen J. B., Bhagat A., Mooney V., Yan E. C. (2009) Thermal decay of rhodopsin: role of hydrogen bonds in thermal isomerization of 11-cis-retinal in the binding site and hydrolysis of protonated Schiff base. J. Am. Chem. Soc. 131, 8750–8751 [DOI] [PMC free article] [PubMed] [Google Scholar]
- 43. Liu J., Liu M. Y., Nguyen J. B., Bhagat A., Mooney V., Yan E. C. (2011) Thermal properties of rhodopsin: insight into the molecular mechanism of dim-light vision. J. Biol. Chem. 286, 27622–27629 [DOI] [PMC free article] [PubMed] [Google Scholar]
- 44. Liu J., Liu M. Y., Fu L., Zhu G. A., Yan E. C. (2011) Chemical kinetic analysis of thermal decay of rhodopsin reveals unusual energetics of thermal isomerization and hydrolysis of Schiff base. J. Biol. Chem. 286, 38408–38416 [DOI] [PMC free article] [PubMed] [Google Scholar]
- 45. Okada T., Fujiyoshi Y., Silow M., Navarro J., Landau E. M., Shichida Y. (2002) Functional role of internal water molecules in rhodopsin revealed by x-ray crystallography. Proc. Natl. Acad. Sci. U.S.A. 99, 5982–5987 [DOI] [PMC free article] [PubMed] [Google Scholar]
- 46. Janz J. M., Farrens D. L. (2004) Role of the retinal hydrogen bond network in rhodopsin Schiff base stability and hydrolysis. J. Biol. Chem. 279, 55886–55894 [DOI] [PubMed] [Google Scholar]
- 47. Yan E. C., Kazmi M. A., De S., Chang B. S., Seibert C., Marin E. P., Mathies R. A., Sakmar T. P. (2002) Function of extracellular loop 2 in rhodopsin: glutamic acid 181 modulates stability and absorption wavelength of metarhodopsin II. Biochemistry 41, 3620–3627 [DOI] [PMC free article] [PubMed] [Google Scholar]
- 48. Yan E. C., Kazmi M. A., Ganim Z., Hou J. M., Pan D., Chang B. S., Sakmar T. P., Mathies R. A. (2003) Retinal counterion switch in the photoactivation of the G protein-coupled receptor rhodopsin. Proc. Natl. Acad. Sci. U.S.A. 100, 9262–9267 [DOI] [PMC free article] [PubMed] [Google Scholar]
- 49. Lüdeke S., Beck M., Yan E. C., Sakmar T. P., Siebert F., Vogel R. (2005) The role of Glu-181 in the photoactivation of rhodopsin. J. Mol. Biol. 353, 345–356 [DOI] [PubMed] [Google Scholar]
- 50. Davidson F. F., Loewen P. C., Khorana H. G. (1994) Structure and function in rhodopsin: replacement by alanine of cysteine residues 110 and 187, components of a conserved disulfide bond in rhodopsin, affects the light-activated metarhodopsin II state. Proc. Natl. Acad. Sci. U.S.A. 91, 4029–4033 [DOI] [PMC free article] [PubMed] [Google Scholar]
- 51. Janz J. M., Farrens D. L. (2003) Assessing structural elements that influence Schiff base stability: mutants E113Q and D190N destabilize rhodopsin through different mechanisms. Vision Res. 43, 2991–3002 [DOI] [PubMed] [Google Scholar]
- 52. Janz J. M., Fay J. F., Farrens D. L. (2003) Stability of dark state rhodopsin is mediated by a conserved ion pair in intradiscal loop E-2. J. Biol. Chem. 278, 16982–16991 [DOI] [PubMed] [Google Scholar]
- 53. Angel T. E., Chance M. R., Palczewski K. (2009) Conserved waters mediate structural and functional activation of family A (rhodopsin-like) G protein-coupled receptors. Proc. Natl. Acad. Sci. U.S.A. 106, 8555–8560 [DOI] [PMC free article] [PubMed] [Google Scholar]
- 54. Yan E. C., Epps J., Lewis J. W., Szundi I., Bhagat A., Sakmar T. P., Kliger D. S. (2007) J. Phys. Chem. C 111, 8843–8848 [Google Scholar]
- 55. Yan E. C., Ganim Z., Kazmi M. A., Chang B. S., Sakmar T. P., Mathies R. A. (2004) Resonance Raman analysis of the mechanism of energy storage and chromophore distortion in the primary visual photoproduct. Biochemistry 43, 10867–10876 [DOI] [PMC free article] [PubMed] [Google Scholar]
- 56. Sandberg M. N., Amora T. L., Ramos L. S., Chen M. H., Knox B. E., Birge R. R. (2011) Glutamic acid 181 is negatively charged in the bathorhodopsin photointermediate of visual rhodopsin. J. Am. Chem. Soc. 133, 2808–2811 [DOI] [PMC free article] [PubMed] [Google Scholar]
- 57. Hwa J., Reeves P. J., Klein-Seetharaman J., Davidson F., Khorana H. G. (1999) Structure and function in rhodopsin: further elucidation of the role of the intradiscal cysteines, Cys-110, -185, and -187, in rhodopsin folding and function. Proc. Natl. Acad. Sci. U.S.A. 96, 1932–1935 [DOI] [PMC free article] [PubMed] [Google Scholar]
- 58. Krebs M. P., Holden D. C., Joshi P., Clark C. L., 3rd, Lee A. H., Kaushal S. (2010) Molecular mechanisms of rhodopsin retinitis pigmentosa and the efficacy of pharmacological rescue. J. Mol. Biol. 395, 1063–1078 [DOI] [PubMed] [Google Scholar]
- 59. Matias-Florentino M., Ayala-Ramirez R., Graue-Wiechers F., Zenteno J. C. (2009) Molecular screening of rhodopsin and peripherin/RDS genes in Mexican families with autosomal dominant retinitis pigmentosa. Curr. Eye Res. 34, 1050–1056 [DOI] [PubMed] [Google Scholar]
- 60. Tsui I., Chou C. L., Palmer N., Lin C. S., Tsang S. H. (2008) Phenotype-genotype correlations in autosomal dominant retinitis pigmentosa caused by RHO, D190N. Curr. Eye Res. 33, 1014–1022 [DOI] [PMC free article] [PubMed] [Google Scholar]
- 61. Kaushal S., Khorana H. G. (1994) Structure and function in rhodopsin. 7. Point mutations associated with autosomal dominant retinitis pigmentosa. Biochemistry 33, 6121–6128 [DOI] [PubMed] [Google Scholar]
- 62. Molday R. S., MacKenzie D. (1983) Monoclonal antibodies to rhodopsin: characterization, cross-reactivity, and application as structural probes. Biochemistry 22, 653–660 [DOI] [PubMed] [Google Scholar]
- 63. Ferretti L., Karnik S. S., Khorana H. G., Nassal M., Oprian D. D. (1986) Total synthesis of a gene for bovine rhodopsin. Proc. Natl. Acad. Sci. U.S.A. 83, 599–603 [DOI] [PMC free article] [PubMed] [Google Scholar]
- 64. Reeves P. J., Callewaert N., Contreras R., Khorana H. G. (2002) Structure and function in rhodopsin: high-level expression of rhodopsin with restricted and homogeneous N-glycosylation by a tetracycline-inducible N-acetylglucosaminyltransferase I-negative HEK293S stable mammalian cell line. Proc. Natl. Acad. Sci. U.S.A. 99, 13419–13424 [DOI] [PMC free article] [PubMed] [Google Scholar]
- 65. Reeves P. J., Kim J. M., Khorana H. G. (2002) Structure and function in rhodopsin: a tetracycline-inducible system in stable mammalian cell lines for high-level expression of opsin mutants. Proc. Natl. Acad. Sci. U.S.A. 99, 13413–13418 [DOI] [PMC free article] [PubMed] [Google Scholar]
- 66. Oprian D. D., Molday R. S., Kaufman R. J., Khorana H. G. (1987) Expression of a synthetic bovine rhodopsin gene in monkey kidney cells. Proc. Natl. Acad. Sci. U.S.A. 84, 8874–8878 [DOI] [PMC free article] [PubMed] [Google Scholar]
- 67. Min K. C., Zvyaga T. A., Cypess A. M., Sakmar T. P. (1993) Characterization of mutant rhodopsins responsible for autosomal dominant retinitis pigmentosa. Mutations on the cytoplasmic surface affect transducin activation. J. Biol. Chem. 268, 9400–9404 [PubMed] [Google Scholar]
- 68. Sakmar T. P., Franke R. R., Khorana H. G. (1989) Glutamic acid 113 serves as the retinylidene Schiff base counterion in bovine rhodopsin. Proc. Natl. Acad. Sci. U.S.A. 86, 8309–8313 [DOI] [PMC free article] [PubMed] [Google Scholar]
- 69. Wald G., Brown P. K. (1953) The molar extinction of rhodopsin. J. Gen. Physiol. 37, 189–200 [DOI] [PMC free article] [PubMed] [Google Scholar]
- 70. Kito Y., Suzuki T., Azuma M., Sekoguti Y. (1968) Absorption spectrum of rhodopsin denatured with acid. Nature 218, 955–957 [DOI] [PubMed] [Google Scholar]
- 71. Ozaki K., Terakita A., Hara R., Hara T. (1986) Rhodopsin and retinochrome in the retina of a marine gastropod, Conomulex luhuanus. Vision Res. 26, 691–705 [DOI] [PubMed] [Google Scholar]
- 72. Sancho-Pelluz J., Tosi J., Hsu C. W., Lee F., Wolpert K., Tabacaru M. R., Greenberg J. P., Tsang S. H., Lin C. S. (2012) Mice with a D190N mutation in the gene encoding rhodopsin: a model for human autosomal-dominant retinitis pigmentosa. Mol. Med. 18, 549–555 [DOI] [PMC free article] [PubMed] [Google Scholar]
- 73. Angel T. E., Gupta S., Jastrzebska B., Palczewski K., Chance M. R. (2009) Structural waters define a functional channel mediating activation of the GPCR, rhodopsin. Proc. Natl. Acad. Sci. U.S.A. 106, 14367–14372 [DOI] [PMC free article] [PubMed] [Google Scholar]
- 74. Fishman G. A., Vandenburgh K., Stone E. M., Gilbert L. D., Alexander K. R., Sheffield V. C. (1992) Ocular findings associated with rhodopsin gene codon 267 and codon 190 mutations in dominant retinitis pigmentosa. Arch. Ophthalmol. 110, 1582–1588 [DOI] [PubMed] [Google Scholar]


