

Background: FGFRL1 has a unique intracellular domain predicted to inhibit intracellular signaling.
Results: FGFRL1 localizes to pancreatic beta-cell insulin granules and enhances intracellular signaling, insulin content, and matrix adhesion. Signaling was reduced by mutation of the intracellular domain.
Conclusion: Contrary to prediction, FGFRL1 enhances biological responses in these cells.
Significance: This study reveals a novel mechanism of intracellular signaling regulation.
Keywords: Beta-cell, Fibroblast Growth Factor Receptor (FGFR), MAP Kinases (MAPKs), Receptor Tyrosine Kinase, Signal Transduction, FGFR5, FGFRL1, PTPN6, SHP-1
Abstract
FGFRL1 is a newly identified member of the fibroblast growth factor receptor (FGFR) family expressed in adult pancreas. Unlike canonical FGFRs that initiate signaling via tyrosine kinase domains, the short intracellular sequence of FGFRL1 consists of a putative Src homology domain-2 (SH2)-binding motif adjacent to a histidine-rich C terminus. As a consequence of nonexistent kinase domains, FGFRL1 has been postulated to act as a decoy receptor to inhibit canonical FGFR ligand-induced signaling. In pancreatic islet beta-cells, canonical FGFR1 signaling affects metabolism and insulin processing. This study determined beta-cell expression of FGFRL1 as well as consequent effects on FGFR1 signaling and biological responses. We confirmed FGFRL1 expression at the plasma membrane and within distinct intracellular granules of both primary beta-cells and βTC3 cells. Fluorescent protein-tagged FGFRL1 (RL1) induced a significant ligand-independent increase in MAPK signaling. Removal of the histidine-rich domain (RL1-ΔHis) or entire intracellular sequence (RL1-ΔC) resulted in greater retention at the plasma membrane and significantly reduced ligand-independent ERK1/2 responses. The SHP-1 phosphatase was identified as an RL1-binding substrate. Point mutation of the SH2-binding motif reduced the ability of FGFRL1 to bind SHP-1 and activate ERK1/2 but did not affect receptor localization to insulin secretory granules. Finally, overexpression of RL1 increased cellular insulin content and matrix adhesion. Overall, these data suggest that FGFRL1 does not function as a decoy receptor in beta-cells, but rather it enhances ERK1/2 signaling through association of SHP-1 with the receptor's intracellular SH2-binding motif.
Introduction
Fibroblast growth factors (FGFs) compose a large family of 23 polypeptides that exhibit diverse yet redundant roles in biological processes such as cellular proliferation, differentiation, and metabolism (1–5). Activation of intracellular signaling cascades is classically mediated by ligand interaction with high affinity cell surface tyrosine kinase receptors FGFR1–4 that are structurally similar and exhibit a high degree of sequence homology at the amino acid level (6, 7). Ligand binding to extracellular immunoglobulin-like (Ig-like) domains induces receptor dimerization at the cell membrane, initiating trans-autophosphorylation of intracellular tyrosine residues and intrinsic activity of a split kinase domain (4, 5). Many known substrates and adaptor proteins (i.e. FRS2, PLC, Akt, ERK1/2, and Grb2) have been identified as phosphorylation targets in FGF/FGFR3-mediated signaling pathways (8).
Fibroblast growth factor receptor-like 1 (FGFRL1) is a newly described member of the FGFR family that is expressed in embryonic bone and adult pancreas (9–11). This unique receptor exhibits an ectodomain closely resembling the canonical FGFR family members, thereby retaining the ability to bind FGF ligands with varying affinity (12). However, FGFRL1 is not likely to initiate classical intracellular tyrosine signaling cascades due to the striking absence of an intracellular kinase domain (11). As a consequence, FGFRL1 is predicted to regulate FGF signaling in a negative manner by either (i) heterodimerizing with cell surface canonical FGFRs, thereby preventing intracellular receptor trans-autophosphorylation, or (ii) binding extracellular ligand to prevent its interaction with canonical receptors. To date, no definitive experiments have confirmed either of these functions.
Rather than a split kinase domain, FGFRL1 exhibits a unique intracellular domain that consists of a tandem tyrosine-based motif (PKLYPKLYTDI) directly adjacent to a histidine-rich region (11). The tandem tyrosine-based motif is predicted to play a role in either directing receptor endocytosis and/or transmembrane trafficking (13) or in functioning as a putative SH2-binding motif due to sequence similarity to immunoreceptor tyrosine-based inhibition motifs (11). The histidine-rich region has been shown to interact with zinc and nickel ions (14), which as a consequence may directly modulate the adjacent SH2-binding motif. Binding of substrate signaling molecules and metal ions to the receptor C terminus may therefore represent alternative mechanisms to regulate FGFRL1 signaling.
It has been well established that FGF ligands and their receptors play a role in the development of the embryonic and neonatal pancreas (3, 15–17), and although both ligand and receptor have been identified in the adult pancreas (1, 18, 19), the role of this signaling system is less well defined in the mature tissue. Stimulation of rodent islets with FGFs has been shown to specifically modulate the beta-cell and potentiate insulin secretion (20, 21). Conversely, attenuation of FGF signaling by targeted beta-cell expression of a kinase-deficient (“dominant negative”) FGFR1 (but not FGFR2) induced a diabetic phenotype in mice (1). The islets of these mice contained a diminished number of beta-cells with reduced glucose sensitivity and impaired insulin processing, demonstrating the importance of FGF signaling in maintenance of beta-cell physiology and glucose homeostasis. We previously confirmed FGFR1 activity in adult murine pancreatic beta-cells, and we further showed changes in islet glucose-stimulated metabolism and insulin secretion in the presence of the FGFR1-ligand FGF21 (2, 22). Overall, these data suggest that FGFR1-induced signaling regulates beta-cell biology via classical intracellular signaling responses and may be associated with the onset and progression of metabolic disorders such as diabetes.
We hypothesized that FGFR1 activity in adult pancreatic islet beta-cells is modulated by FGFRL1. We subsequently confirmed FGFRL1 expression in beta-cells of mouse islets, as well as the βTC3 cell line. Endogenous FGFRL1 expression was detected at the cell membrane and in distinct intracellular aggregates (insulin granules and late recycling endosomes) with granular association directed by the C terminus of the receptor. Interestingly, overexpression of FGFRL1 significantly enhanced tyrosine phosphorylation of the MAPK signaling protein ERK1/2. Activation of the MAPK pathway was dependent on the SH2-binding motif, as either complete removal of the FGFRL1 C terminus or point mutation of the specific tandem tyrosine residues reduced both ligand-independent and ligand-dependent ERK1/2 phosphorylation to control levels. SHP-1 phosphatase was identified as a candidate substrate protein with the ability to bind to the SH2-binding motif of FGFRL1. Overall, these data demonstrate that FGFRL1 does not function as a decoy receptor to regulate FGF ligand-mediated signaling, but rather it directly interacts with known substrate proteins to affect ligand-independent and -dependent mechanisms of ERK1/2 activity.
EXPERIMENTAL PROCEDURES
Molecular Cloning of FGFRL1 and SHP-1 Fluorescent Protein Constructs
The complete sequence of human FGFRL1 cDNA (Open Biosystems) was excised from the pCMV_SPORT6 vector following introduction of NheI and AgeI restriction sites and a modified Kozak sequence by PCR using the following primers: sense FGFRL1-NheI 5′-CGGGGCTAGCGGGACCATGACGCCGAGCCCCCTGTT-3′ and antisense FGFRL1-AgeI 5′-GCGCGACCGGTGCGCACTGATAGTGGATGTGCTGGTGGA-3′. The FGFRL1 sequence was subsequently cloned in-frame with monomeric Venus fluorescent protein into the NheI and AgeI sites of the N1 vector (23) to create a full-length fluorescent protein-tagged FGFRL1 (RL1Ven). The RL1-ΔC-Venus construct (RL1-ΔCVen), deficient for the intracellular domain, was cloned in-frame into the NheI and AgeI sites of monomeric Venus-N1 by PCR using the sense FGFRL1-NheI primer in combination with antisense ΔC-AgeI primer 5′-GCGCGACCGGTGCAAGCCACAGGAGCAGGGTGCCCAGGAT-3′. Similarly, the RL1-ΔHis-Venus construct (RL1-ΔHisVen), deficient for the intracellular histidine-rich region of FGFRL1, was cloned in-frame of monomeric Venus-N1 by PCR using the sense FGFRL1-NheI primer in combination with antisense ΔHis-AgeI primer 5′-GCGCGACCGGTGCGATGTCTGTGTAGAGTTTGGGGTACA-3′. Additionally, all RL1 variants were transferred in-frame with mCherry (i.e. RL1Che), allowing multicolor imaging and appropriate spectral detection of constructs when co-expressed. The full-length SHP-1 gene was enzymatically cleaved from a SHP-1-eGFP vector (kindly provided by Dr. Scott Gray-Owen, University of Toronto) and subsequently ligated to the Cerulean-N1 plasmid at the NheI and AgeI sites to create SHP-1-Cerulean (SHP-1Cer). All construct sequences were verified by sequencing at The Centre for Applied Genomics (The Hospital for Sick Children, Toronto, Ontario, Canada).
FGFRL1 Fluorescent Protein SH2-binding Motif Point Mutations
Tandem tyrosine residues of the putative RL1Ven intracellular SH2-binding motif were point-mutated individually or in combination using the QuikChange® site-directed mutagenesis protocol (Stratagene). Briefly, tyrosine residues were replaced with alanine residues using Pfu polymerase and specific mutagenic primers as follows (point mutations are underlined in bold; antisense primers were the reverse complement of sense primers): Y471A, sense 5′-GTTGCTGGCCCTAAGTTGGCGCCCAAACTCTACACAGAC-3′; Y475A, sense 5′-CTAAGTTGTACCCCAAACTCGCGACAGACATCCACACACACAC-3′; and Y471/Y475A, sense 5′-CTAAGTTGGCGCCCAAACTCGCGACAGACATCCACACACACAC-3′. All mutated RL1 variants were subsequently transferred from the Venus-N1 vector into mCherry-N1 for co-transfection and multicolor confocal microscopy.
Cell Culture and Transfection
Insulin-secreting murine βTC3 cells were maintained at 37 °C in DMEM containing 4.5 g/liter glucose and 3.7 g/liter sodium bicarbonate supplemented with 1 mm sodium pyruvate, 15% horse serum, 5% FBS, and 5 units/ml penicillin/streptomycin. αTC1 cells were maintained at 37 °C in RPMI 1640 medium supplemented with 11 mm glucose, 10 mm HEPES, 10% FBS, and 5 units/ml penicillin/streptomycin. Cells were plated onto 6-well culture dishes for protein analysis by Western immunoblot or 35-mm glass bottom dishes (MatTek Corp.) for fluorescence imaging. Live cell fluorescence imaging was conducted in imaging media (125 mm NaCl, 5.7 mm KCl, 2.5 mm CaCl2, 1.2 mm MgCl2, 10 mm HEPES, and 2 mm glucose, pH 7.4).
To create stable cell lines, plasmid DNAs were introduced by electroporation into βTC3 cells (10 × 1 ms square wave pulses of 200 V at 100-ms intervals using a Bio-Rad Gene Pulser XcellTM electroporation system). Forty micrograms of each construct was electroporated into the equivalent of a near-confluent P100 dish of harvested βTC3 cells suspended in Dulbecco's PBS in a 40-mm gapped cuvette. Transfected cultures were replated overnight with fresh 10% FBS/DMEM prior to media supplementation with G418 (800 μg/ml) for selection of positively transfected cells. The concentration of G418 was reduced (400 μg/ml) for cells maintained in long term culture.
For transient intracellular localization experiments, βTC3 cells were co-transfected with each mCherry-tagged RL1 construct and either eGFP-tagged phogrin (PhogrineGFP; phosphatase of granules of insulin, a marker of insulin secretory granules) or Rab7 (Rab7eGFP; a marker of late recycling endosomes) (24–26). Cultures at ∼50–60% confluency were transfected using polyethyleneimine (linear, Mr 25,000; Polysciences, Inc.) at a ratio of 3:1 (polyethyleneimine/DNA). Alternatively, each stably-expressing RL1Ven isoform βTC3 cell line was transiently transfected with SHP-1Cer plasmid DNA by electroporation as described previously. Fluorescence expression was verified 48–72 h post-transfection. Only cultures visually assessed by fluorescence microscopy to be at least 60% transfected were used for further experimentation.
Whole Islet Harvest and Dispersion
Animal procedures were approved by the Animal Care Committee of the University Health Network, Toronto, Ontario, Canada, in accordance with the policies and guidelines of the Canadian Council on Animal Care (Animal Use Protocol number 1531). Pancreatic islets were isolated from 8- to 12-week-old C57BL6 male mice by collagenase digestion (Roche Applied Science) (22). Islets were equilibrated in full RPMI 1640 medium supplemented with 11 mm glucose, 10% FBS, and 5 units/ml penicillin/streptomycin prior to mRNA harvest or dispersion to single cells using Accutase (Sigma) for fixation and immunostaining as described previously (2).
RT-PCR
The RNA from βTC3 cells, αTC1 cells, and ∼100 whole murine islets was isolated using the RNeasy mini kit (Qiagen) and reverse-transcribed using the High Capacity cDNA reverse transcription kit protocol (Applied Biosystems). Oligonucleotide primers were designed to amplify a 238-bp amplicon of Fgfrl1 (GenBankTM accession numbers NM_054071.2 and NM_001164259.1; exons 2–5 or exons 3 and 4; respectively; sense 5′-TCTTCAGGCTTCAGGTTCTTCAAGC-3′ and antisense 5′-AGGAGGACCCAGCCAGC-3′). A DNA Engine Thermal Cycler (Bio-Rad) was used with the following cycling parameters: 95 °C for 30 s, 52 °C for 30 s, and 72 °C for 30 s (35 cycles). The housekeeping transcript glyceraldehyde-3-phosphate dehydrogenase (Gapdh) was amplified as a positive control using sense (5′-ATCGAGCTCATCCCATCACCATCTTCCAGG-3′) and antisense (5′-ACATCTAGAGCCATCACGCCACAGTTTCCC-3′) primers. All reactions included nuclease-free water as a negative control.
Immunofluorescence Protein Detection and Dual-color Confocal Imaging
Dispersed islet cells or βTC3 cells were fixed in 2% paraformaldehyde (10 min at room temperature (RT)), and nonspecific binding was blocked by sample incubation with 10% normal goat serum in 0.1% Triton X-100/PBS (1 h at RT). The samples were subsequently incubated overnight (4 °C) with FGFR5 (H-300) antibody (1:100; Santa Cruz Biotechnology) followed by incubation with anti-rabbit AlexaFluor 568 (1:1000; 45 min at RT; Invitrogen). Samples were thoroughly washed with PBS and consequently incubated with guinea pig anti-insulin antibody (1:1000; 1 h at RT; Linco) followed by anti-guinea pig AlexaFluor 488 (1:1000; 45 min at RT; Invitrogen). All antibodies were diluted in 3% normal goat serum, 0.1% Triton X-100/PBS. Samples were examined visually using a ×63 1.4 NA oil immersion lens on a Zeiss LSM710 confocal microscope. Immunofluorescence associated with insulin and FGFRL1 was detected using 488- and 543-nm laser line illumination in combination with a 519–575-nm bandpass and 568–712-nm long pass filters, respectively.
Venus fluorescent protein was visualized using the 514-nm laser line and 519–575-nm bandpass filter. DAPI nuclear stain was excited by 740-nm two-photon laser excitation and detected using a 396–502-nm bandpass filter. For all co-transfected samples, sequential images were collected to discriminate between fluorophores and eliminate potential signal bleed through. To discriminate between eGFP- and mCherry-associated fluorescence, images were collected using 488- and 543-nm laser lines in combination with 493–574-nm bandpass and 578–696-nm long pass filters, respectively. Similarly, sequential images were collected using 458- and 514-nm laser line excitation in combination with a 519–621-nm long pass filter to discriminate between Cerulean- and Venus-associated fluorescence.
Quantitative analysis on a minimum of three fields of view per sample was used to determine fluorophore co-localization using the Manders' region of interest calculator plugin of ImageJ software (National Institute of Health). Distinct punctate regions (10–30 per image) were selected for analysis of the Manders' overlap coefficient (MOC), which reports the relative co-localization between two signals with a value between 0 (low co-localization) and 1 (high co-localization) (27–29). Image intensity profiles were also used to determine the level of fluorophore association.
Immunoprecipitation
βTC3 cells were harvested as described previously (2). Cell lysates (500 μg/sample) were pre-cleared with protein A/G PLUS-agarose bead slurry (20 μl/sample; Santa Cruz Biotechnology) by incubating on a rotating platform (30 min, 4 °C). Rabbit anti-FGFRL1 or rabbit anti-SHP-1 (C-19) (2 μg/sample; Santa Cruz Biotechnology) was added to pre-cleared lysate supernatants (2 h, 4 °C, rotating platform) followed by addition of bead slurry for overnight incubation (20 μl/sample; rotation at 4 °C). Bead complexes were collected by centrifugation and washed three times with cold lysis buffer. Immunoprecipitated samples were eluted from the beads by boiling in SDS Loading Buffer (15 μl/sample) for Western immunoblotting analysis using mouse monoclonal anti-SHP-1 (D-11) (1:500; Santa Cruz Biotechnology), mouse monoclonal anti-SHP-1 (Clone 52) (1:500; BD Biosciences), or Living Colors anti-GFP (1:200; Clontech) overnight at 4 °C followed by detection with HRP-linked anti-mouse or anti-rabbit secondary as appropriate (1:2000; Cell Signaling Technology).
Western Immunoblotting
Cell cultures were serum-starved in 0.2% FBS/DMEM (11 mm glucose) for 48 h prior to stimulation. Stimulation media containing heparin sodium salt (10 units/ml; Sigma) and FGF2 (10 ng/ml; R&D Systems) were added to cells as indicated for 10 min at 37 °C. Cultures were washed with sterile PBS containing 100 μm sodium orthovanadate and harvested on ice by manual scraping. The MEK inhibitor U0126 (10 μm; Cell Signaling Technology) was added to specific cultures 2 h prior to stimulation with FGF2 (as indicated). For gene knockdown studies, SHP-1 siRNA or scrambled control siRNA-A (0.75 μg; Santa Cruz Biotechnology) was mixed with siRNA transfection reagent at a 1:1 ratio according to the manufacturer's protocol (Santa Cruz Biotechnology). The mixture was suspended in serum-free DMEM and overlaid onto cells (70% confluency). Serum was added to the culture media (7 h post-transfection; 0.2% FBS) for 24 h prior to experimentation. Harvested cells were collected by centrifugation, washed three times with ice-cold sterile PBS containing 100 μm sodium orthovanadate, and lysed in Triton lysis buffer (1% Triton X-100, 100 mm sodium chloride, 50 mm HEPES, 5% glycerol, protease inhibitor mixture and PhosphoSTOP phosphatase inhibitor (Roche Applied Science)). Whole cell lysate protein concentration was determined by colorimetric protein assay (Bio-Rad) using BSA as a standard. The equivalent of 20 μg of total protein per lane was separated by 7.5 or 10% SDS-PAGE and transferred to nitrocellulose membranes for nonspecific blocking (5% milk/TBS-T; 1 h; RT) and overnight incubation (4 °C) with the following antibodies diluted in block solution: FGFR5 (H-300) (1:2000; Santa Cruz Biotechnology), phospho-p44/42 MAPK (Thr-202/Tyr-204) (1:1000; Cell Signaling Technology), or p44/42 MAPK (1:1000; Cell Signaling Technology). Blots were subsequently incubated with anti-rabbit horseradish peroxidase-linked antibody (1:2000; Cell Signaling Technology; 45 min; RT). For SHP-1 immunoblotting, nitrocellulose membranes were blocked in 5% BSA/TBS-T (1 h; RT) and incubated overnight (4 °C) with mouse monoclonal anti-SHP-1 antibody (clone 52; 1:500; BD Biosciences) and anti-mouse horseradish peroxidase-linked antibody (1:2000; Cell Signaling Technology; 45 min; RT). Proteins were detected by enhanced chemiluminescence.
For each experiment, phospho-ERK1/2 was detected before membranes were stripped and reprobed for corresponding ERK1/2 or SHP-1 protein levels. Protein band intensities were determined using ImageJ. To quantify ERK1/2 activation, the mean intensity (minus background intensity) of each phospho-ERK1/2 band was divided by the corresponding ERK1/2 band. Each ratiometric measurement was consequently normalized to the value of the corresponding control sample.
Insulin Assay
Cell cultures at 70% confluency were equilibrated with 2 mm glucose in imaging buffer for 1 h at 37 °C. Buffer was discarded, and cultures were subsequently treated with fresh glucose-supplemented imaging buffer (2 or 11 mm; 1 h at 37 °C). The supernatants were collected, and adherent cells were harvested with 0.25% trypsin/EDTA for cell counting, as well as cell lysate preparation. Supernatants and cell lysate fractions were diluted (10- and 2000-fold, respectively), and insulin content was measured using a mouse/rat insulin ELISA kit (Millipore) according to the manufacturer's recommendations. Total insulin content was normalized to total cell number. Secreted insulin (supernatant fraction) was reported as the fraction of insulin relative to corresponding total insulin content.
Adhesion Assay
Flat-bottom, nontreated 96-well assay plates were prepared for adhesion assays as described previously (30). Briefly, individual wells were pre-coated with poly-l-lysine (0.1% in PBS; 1 h at RT) followed by laminin (100 μg/ml; Sigma), collagen type IV (1 mg/ml; Sigma) or BSA (1%) for 3 h at 37 °C. Cells were suspended in 10% FBS/DMEM, plated at 2.5 × 10⁵ cells/well, and allowed to adhere for 1 h at 37 °C. Media were aspirated, and wells were carefully washed with PBS containing Ca2+ and Mg2+ prior to cell fixation with 2% paraformaldehyde (15 min at RT). Fixed cells were stained with 0.2% toluidine blue/PBS (30 min at RT), thoroughly washed with PBS, and lysed with 1% Triton X-100 for 30 min (RT). Cellular absorbance values collected at 590 nm were corrected for background absorbance levels (control wells containing no cells) and normalized to Venus control sample values.
Proliferation Assay
Cells were plated at equivalent density (0.5 × 10⁴/well; 6-well culture plates) in stimulation media (DMEM, penicillin/streptomycin, 0.2% FBS, 0.2% BSA, 10 units/ml heparin sodium salt) supplemented with 10% FBS or FGF-2 (10 ng/ml) as indicated. At day 5, stimulation media were aspirated, and cultures were washed briefly with pre-warmed PBS. Cells were harvested with trypsin/EDTA, and total cell number was determined by visual counting using a hemocytometer and trypan blue exclusion. Values were reported as fold change in cell number compared with the Venus control sample (0.2% FBS).
Statistical Analysis
Each experiment was performed a minimum three times (as indicated). Statistical analysis of the data was performed using Origin 8 SR0 software (Origin-Lab). Data are reported as mean ± S.E. The significance level was set at p < 0.05 and verified using either Tukey's honestly significant difference test for mean comparison after one-way analysis of variance (ANOVA) or by two-tailed two-sample t test.
RESULTS
FGFRL1 Is Endogenously Expressed in Pancreatic Islets and Beta-cells
FGFRL1 is expressed in the adult pancreas of mice and humans (9–11). To determine whether FGFRL1 is specifically expressed in endocrine beta-cells, we examined transcript and protein expression in murine pancreatic islets and endocrine cell lines (Fig. 1). Fgfrl1 mRNA was amplified by RT-PCR in islets and βTC3 cells but not the αTC1 α-cell line (Fig. 1A). Two protein bands of ∼53 and 65–70 kDa were consequently identified in βTC3 cell lysates by Western immunoblotting (Fig. 1B). In dispersed islet samples, only insulin-positive cells exhibited FGFRL1 immunofluorescence (Fig. 1C). FGFRL1 immunofluorescence in βTC3 cells was subsequently observed to localize at distinct punctate regions throughout the cytoplasm, and it exhibited significant overlap with insulin granules (Fig. 1D). These data confirm that FGFRL1 is endogenously expressed in pancreatic islet beta-cells as well as the βTC3 cell line.
FIGURE 1.

FGFRL1 is expressed in insulin-secreting pancreatic islet beta-cells. A, Fgfrl1 mRNA was amplified by RT-PCR in islet samples (I) and insulin-secreting beta-cells (β = βTC3) but not α-cells (α = αTC1) or a DNA-deficient sample (−). The Gapdh housekeeping gene was amplified as a loading control. B, FGFRL1 protein bands of ∼53 and 65–70 kDa were visualized in βTC3 cell lysates by Western immunoblotting. Molecular mass markers (kDa) are indicated at left. C, polyclonal antibody co-immunofluorescent detection positively identified FGFRL1 expression (red) in insulin-positive cells (green) dispersed from whole mouse islets. FGFRL1 was not detected in insulin-negative cells (arrow). D, FGFRL1-associated immunofluorescence (red) was primarily associated with discrete intracellular punctate regions in βTC3 cells but was excluded from nuclei (DRAQ5 counterstain; blue). FGFRL1 was frequently observed to co-localize with insulin-rich regions (green; arrow). The inset reveals R5-immunofluorescence control. Scale bars, 10 μm.
C-terminal Domain of FGFRL1 Directs Intracellular Expression in βTC3 Cells
The intracellular domain of FGFRL1 contains a putative SH2-binding motif adjacent to a C-terminal histidine-rich region previously shown to bind Zn2+ (14). To explore the role of these domains in regulating receptor localization and signaling in beta-cells, we created fluorescent protein-tagged constructs with C-terminal truncations of the full-length receptor (RL1) resulting in progressive removal of the histidine-rich region (RL1-ΔHis) and putative SH2-binding domain (RL1-ΔC) (31). Live βTC3 cells expressing the full-length construct (RL1) confirmed distinct localization of the receptor at both the cell membrane as well as in distinct punctate regions within the cytosol, similar to endogenous expression (Fig. 2; RL1Ven compared with Fig. 1D). Although the truncated RL1-ΔHis and -ΔC constructs also demonstrated punctate cytoplasmic accumulation, a more predominant expression at the cell membrane was observed (Fig. 2; RL1-HisVen and RL1-ΔCVen, respectively). All cell nuclei remained void of receptor expression. These data suggest that FGFRL1 trafficking, in particular to punctate structures within the cytoplasm, is regulated by the C terminus of the receptor.
FIGURE 2.

Unique C-terminal domain directs intracellular expression of FGFRL1 in βTC3 cells. A, confocal microscopy images of live βTC3 cells overexpressing full-length FGFRL1 tagged with Venus fluorescent protein (RL1Ven) reveal receptor-associated fluorescence primarily in distinct punctate regions within the cytosol. Exclusion of the histidine-rich zinc-binding region (RL1-ΔHisVen) (B) or removal of the intracellular domain (RL1-ΔCVen) revealed enhanced receptor expression at the cell membrane (C). Scale bar, 10 μm.
FGFLR1 Associates with Insulin Secretory Granules and Late Endosomes
Previous work has revealed that FGFRL1 localizes to secretory granules in HEK293 cells, a kidney cell line (31, 32). To determine FGFRL1 localization in βTC3 cells, we co-expressed the full-length (RL1) and truncated (RL1-ΔHis and RL1-ΔC) constructs with PhogrineGFP, a marker for insulin secretory granules, and Rab7eGFP, a marker for late recycling endosomes (Fig. 3). Full-length receptor (RL1) showed significant overlap with PhogrineGFP and less pronounced overlap with Rab7eGFP consistent with preferential localization to insulin secretory granules (Fig. 3, A and E). In contrast, truncated receptors (RL1-ΔHis and RL1-ΔC) demonstrated reverse trends both visually (Fig. 3; as indicated) and by Manders' overlap coefficient (Fig. 3, D and H). These data are consistent with the C terminus of FGFRL1 directing receptor trafficking to insulin secretory granules.
FIGURE 3.

C-terminal domain of FGFRL1 directs receptor trafficking to insulin secretory granules and late recycling endosomes. A–C, two-color confocal imaging revealed that co-localization of FGFRL1 (RL1Che; red) with PhogrineGFP (phosphatase of insulin secretory granules, tagged with green fluorescent protein; green) was reduced when the receptor C-terminal domain was truncated (RL1-ΔCChe or RL1-ΔHisChe; as indicated). Protein co-localization was defined by yellow pixels in image overlays (arrows). D, MOC was calculated for distinct punctate regions in each sample image (A–C) and plotted as mean MOC ± S.E. *, p < 0.05 compared with RL1 + Phogrin using one-way ANOVA. n = 3. E–G, conversely, association of FGFRL1Che (red) with Rab7eGFP (a fluorescent marker of late recycling endosomes; green) occurred at higher frequency for the C-terminal mutant receptor constructs (as indicated; arrows). Scale bar, 10 μm. H, MOC was calculated for distinct punctate regions in each sample image (E–G) and plotted as mean MOC ± S.E. *, p < 0.05 compared with RL1 + Rab7 using one-way ANOVA. n = 3.
C Terminus of FGFRL1 Enhances MEK/MAPK Pathway Activation Independent of Ligand Stimulation
FGFRL1 has been postulated to act as a decoy receptor due to ligand binding ability and the absence of a C-terminal tyrosine kinase domain (11, 12, 32). To explore the effect of FGFRL1 on beta-cell MAPK signaling activity, we examined ERK1/2 phosphorylation in βTC3 cells stably expressing the full-length (RL1) and truncated (RL1-ΔHis and RL1-ΔC) receptor constructs (Fig. 4). Expression of full-length RL1 significantly increased ERK1/2 phosphorylation compared with the Venus fluorescent protein control in a ligand-independent manner (Fig. 4, A and B, open bars). In contrast, the truncated receptor constructs (RL1-ΔHis and RL1-ΔC) had no influence on base-line ERK1/2 phosphorylation (compared with Venus controls). All cells examined were responsive to FGF2 (a defined ligand for FGFRL1 (11)), exhibiting similar trends in ERK1/2 phosphorylation at 10 min of stimulation (Fig. 4, A and B, black bars). Cells expressing full-length receptor (RL1) were responsive to exogenous FGF2; however, the resulting increase in ERK1/2 activation was not significant compared with base-line RL1 or ligand-stimulated Venus control cells. These data demonstrate that FGFRL1 does not act as a decoy receptor, but rather it enhances both base-line and FGF2-stimulated ERK1/2 responses.
FIGURE 4.
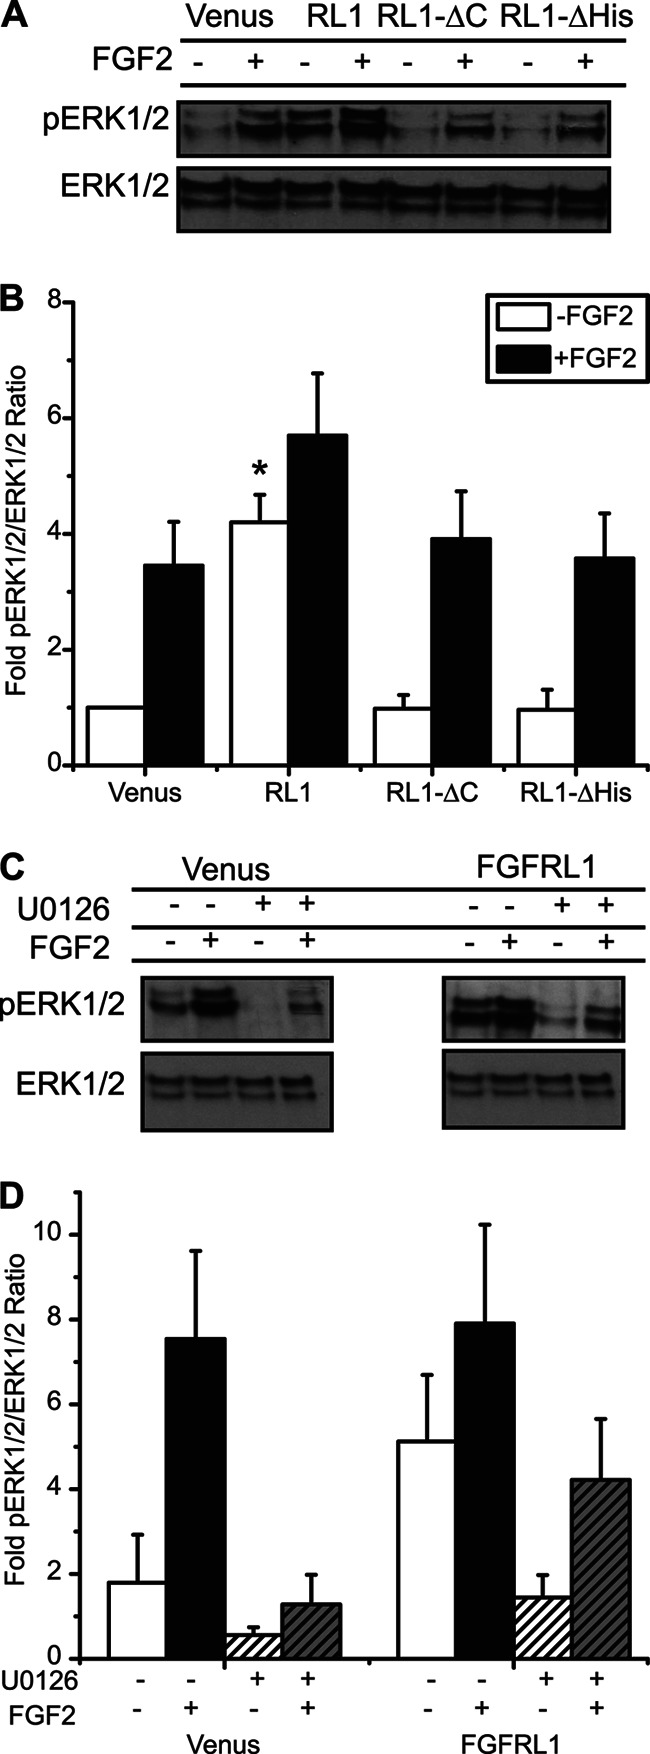
C-terminal domain of FGFRL1 activates the MEK/MAPK signaling pathway independent of receptor-ligand association. A, representative phospho-ERK1/2 (pERK1/2) and total ERK1/2 immunoblots, and B, mean fold-change in phospho-ERK1/2 responses revealed a significant increase in activity associated with overexpression of full-length FGFRL1 (RL1), both in the absence (−) and presence (+) of FGF2 ligand (10 ng/ml for 10 min). Independent of ligand stimulation, ERK1/2 phosphorylation was reduced to comparable Venus control levels when either the C-terminal domain (RL1-ΔC) or histidine-rich region (RL1-ΔHis) was removed. *, p < 0.05 compared with Venus, RL1-ΔC, and RL1-ΔHis controls using one-way ANOVA. n = 4. C and D, enhanced phosphorylation of ERK1/2 in FGFRL1-overexpressing cells (FGFRL1 −/−) was reduced to control levels when cells were pretreated with the MEK inhibitor U0126 (FGFRL1 +/− compared with Venus −/−). Pretreatment with U0126 also reduced FGF-2-stimulated phosphorylation to control levels for both control (Venus +/+ compared with Venus −/−) and FGFRL1 (FGFRL1 +/+ compared with FGFRL1 −/−) cells. Representative blots are shown; each phospho-ERK1/2 blot was stripped and reprobed for total ERK1/2 to assess sample loading integrity and determine ERK1/2 activation (pERK1/2/ERK1/2 intensity ratios). Data are plotted as the mean fold-change in phospho-ERK1/2 response ± S.E. compared with Venus control. n = three separate experiments.
To further explore the mechanisms involved in FGFRL1-dependent signaling responses, we measured ligand-independent and -dependent activation of ERK1/2 in the presence of the MEK inhibitor U0126 (Fig. 4, C and D). In Venus-expressing control cells, U0126 diminished FGF2-stimulated ERK1/2 activation to base-line control levels. In RL1-expressing cells, although U0126 diminished base-line ERK1/2 phosphorylation to control levels, the FGF2-stimulated response was not significantly reduced suggesting MEK-independent activation of ERK1/2 in these cells. These data reveal that FGFRL1 expression enhances ERK1/2 phosphorylation via MEK-mediated mechanisms and further enables ligand-stimulated responses independent of MEK.
SH2 Domain of FGFRL1 Is Required for SHP-1 Association
As a consequence of our data showing predominant FGFRL1 expression at discrete intracellular regions and enhanced ERK1/2 phosphorylation in the absence of ligand, we revisited a hypothesis by Sleeman et al. (11) suggesting that the putative SH2-binding motif might interact with SHP phosphatases to regulate intracellular signaling. We postulated that FGFRL1 sequesters SHP-1 (PTPN6), a phosphatase with two SH2 domains that is expressed in beta-cells (33, 34). We confirmed association of endogenous FGFRL1 and SHP-1 by co-immunoprecipitation (Fig. 5A). We subsequently determined that SHP-1 is a positive regulator of ERK1/2 activation in Venus- and RL1-expressing βTC3 cells by performing SHP-1 siRNA knockdown (Fig. 5B). Endogenous SHP-1 was subsequently determined to associate with the full-length receptor construct (RL1Ven) but not the C-terminal truncation constructs (RL1-ΔHis and RL1-ΔC) (Fig. 5C). Similar trends were observed by dual-color live cell imaging when ectopic fluorescent protein-tagged SHP-1 was co-expressed with each receptor isoform (Fig. 5, D and E). These data show that overlap of SHP-1Cer with full-length RL1Ven in intracellular punctate regions was significantly compromised when the histidine-rich region (RL1-ΔHis) or C terminus was removed (RL1-ΔC) (Fig. 5F). Together, these data reveal that SHP-1 phosphatase forms an activated complex with full-length RL1 at insulin secretory granules and that this association is dependent upon the receptor C terminus.
FIGURE 5.

SHP-1 associates with the C-terminal domain of intracellular FGFRL1. A, endogenous SHP-1 identified by Western immunoblotting (IB) (right lane) co-immunoprecipitated (IP) with endogenous FGFRL1 in βTC3 cell lysates (left lane; representative blot shown). B, phosphorylation of ERK1/2 was significantly decreased in both Venus control and FGFRL1-overexpressing cells when SHP-1 protein levels were reduced by SHP-1 siRNA expression (+ siRNA) compared with scrambled siRNA expression (− siRNA). Representative blots are shown; pERK1/2 membranes were stripped and reprobed for ERK1/2 (to assess sample loading and determine pERK1/2:ERK1/2 intensity ratios) and SHP-1 (to assess impact of siRNA expression). Data are plotted as the mean fold-change in phospho-ERK1/2 response ± S.E. compared with Venus control for three separate experiments. *, p < 0.05 by two-sample t test compared with scrambled siRNA control. C, lysates from βTC3 cells expressing FGFRL1Ven, -ΔHisVen, -ΔCVen, and control Venus were immunoprecipitated (left lanes) with anti-SHP-1 and immunodetected using an anti-fluorescent protein antibody (Living Colors). Comparison with nonimmunoprecipitated cell lysates (right lanes) confirmed association of the full-length FGFRL1Ven construct with endogenous SHP-1. D, dual-color confocal imaging further confirmed co-localization (yellow; arrows) of full-length FGFRL1Ven protein (RL1Ven; green) with SHP-1Cer (red) in βTC3 cells (D, left panel). The long dashed arrow represents regions of interest examined in the line profile (E). Receptor/SHP-1 co-localization was reduced or below detection levels when the histidine-rich region (RL1-ΔHisVen) or the C terminus (RL1-ΔCVen) was deleted, respectively (D, middle and right panels). Scale bar, 10 μm. E, representative line profile showing normalized intensities of SHP-1Cer (red) and FGFRL1Ven (green) along an arbitrary line in D. The numerals 1 and 2 indicate overlapping peaks that correspond to punctate regions observed to have strong co-localization in D. F, MOC was calculated for distinct punctate regions from each sample and plotted as mean MOC ± S.E. (with the exception of RL1-ΔC/SHP-1 samples where co-expression was not observed; N/A, not applicable). *, p < 0.05 compared with Venus, RL1-ΔC, and RL1-ΔHis controls using one-way ANOVA. n = 4.
To determine more specifically the contribution of the RL1 SH2-binding motif in driving the association with SHP-1, we created full-length RL1 constructs with point mutations to replace the first (Y471A), second (Y475A), and both (Y471A and Y475A) tyrosine residues of the tandem repeat motif with nonfunctional alanine residues (Fig. 6A). Immunoprecipitation of full-length RL1 (both RL1Ven construct and endogenous receptor) resulted in detection of endogenous SHP-1 by Western immunoblotting, consistent with interaction through the receptor's SH2-binding motif (Fig. 6B). As expected, the mutant receptor constructs exhibited negligible or reduced association with SHP-1. These trends in receptor/substrate interaction were similarly observed by fluorescence imaging of cells expressing SHP-1Cer and RL1Ven (Fig. 6C). Co-localization of these constructs at intracellular punctate regions was visibly reduced when the SH2-binding motif was point-mutated (Fig. 6C, as indicated). The significant reduction in overlap of SHP-1 with mutated receptor isoforms was confirmed by line plot (Fig. 6D) and Manders' overlap coefficient analysis (Fig. 6E). Interestingly, the point mutations had no apparent effect on RL1 expression at the insulin secretory granules as determined by co-localization with PhogrineGFP (supplemental Fig. S1). This suggests that the zinc-binding histidine-rich region plays the predominant role in directing receptor localization to secretory granules. Taken together, these data reveal that formation of a complex containing full-length RL1 and the signaling substrate SHP-1 is dependent upon the receptor's intracellular SH2-binding motif.
FIGURE 6.

SH2-binding motif is required for SHP-1 association. A, tyrosine residues of the intracellular SH2-binding motif (red font) were point-mutated to noncatalytic alanine residues (underlined green font; Y471A; Y475A; Y471A/Y475A). B, lysate from βTC3 cells expressing FGFRL1Ven control or mutant constructs (as indicated) was immunoprecipitated (IP) (left lanes) with anti-FGFRL1 and detected by Western immunoblotting (IB) using anti-SHP-1 (BD Biosciences). The association of SHP-1 with full-length FGFRL1 (far left lane; molecular weight confirmed in whole cell lysate samples at right) was reduced when either of the SH2-binding domain tyrosine residues was mutated. C, two-color confocal imaging also revealed that mutation of either tyrosine residue (Tyr-471 or Tyr-475) reduced association of SHP-1 with RL1. Dashed arrow represents region of interest examined in the line profile. Scale bar, 10 μm. D, representative line profile showing normalized intensities of SHP-1Cer (red) and Y475AVen (green) along an arbitrary line in B. E, Manders' overlap coefficient for distinct punctate regions from each sample compared with FGFRL1Ven/SHP-1Cer co-expression and plotted as mean MOC ± S.E. *, p < 0.05 compared with RL1 + SHP-1 using one-way ANOVA. n = 4 or n = 3 (for Y471A/Y475A + SHP-1).
Disruption of the Substrate-binding SH2 Motif Interferes with RL1-stimulated ERK1/2 Phosphorylation
To determine the effect of the SH2-binding motif on downstream intracellular signaling, we subsequently created βTC3 cells with stable expression of RL1 with SH2-binding motif mutants for comparison of ERK1/2 responses (Fig. 7). Interestingly, the significant increase in base-line (ligand-independent) ERK1/2 activity associated with overexpression of full-length RL1 was absent in cells overexpressing constructs with mutations in the SH2-binding motif (Fig. 7B, open bars). All three mutants also showed FGF2-induced phospho-ERK1/2 responses similar to Venus-expressing control cells (Fig. 7B, black bars). These data indicate that FGFRL1 requires the tyrosine residues in the SH2-binding motif to enhance phosphorylation of ERK1/2 in the absence (or presence) of ligand, and it ultimately confirms that this receptor does not act as a decoy to block FGF2-induced responses.
FIGURE 7.

Intracellular SH2-binding motif of FGFRL1 is associated with activation of the MAPK signaling pathway independent of ligand stimulation. A, representative phospho-ERK1/2 (pERK1/2) and total ERK1/2 immunoblots, and B, mean fold-change in phospho-ERK1/2 responses revealed a significant decrease in activity associated with mutation of the SH2-binding motif (either single Y471A or Y475A or double Y471A/Y475A mutations) compared with full-length receptor (RL1), both in the absence (−) and presence (+) of FGF2 ligand (10 ng/ml for 10 min). *, p < 0.05 compared with Venus in the absence of FGF2 ligand using one-way ANOVA; # indicates p < 0.05 when compared with Venus in the presence of FGF2 ligand using one-way ANOVA.
FGFRL1 Expression Increases Cellular Insulin and Matrix Adhesion
To determine the physiological relevance of FGFRL1 signaling in beta-cells, we examined the effect of the full-length and truncated RL1 constructs on a number of βTC3 responses (Fig. 8). Consistent with previous work linking FGFR signaling to insulin processing, we observed greater total insulin and secretion in βTC3 cells expressing full-length RL1Ven (Fig. 8, A and B) (1, 20, 21). Expression of this construct also resulted in greater βTC3 adhesion to both collagen type IV and laminin compared with Venus-expressing control cells (Fig. 8, C and D). Interestingly, this activity was related to the C-terminal domain of the receptor as both truncation mutants (RL1-ΔHis and -ΔC) exhibited matrix adhesion levels similar to control cells. Finally, consistent with FGFRL1 promoting limited mitogenic activity, we observed no significant differences in cellular proliferation with RL1 overexpression in the presence of either 10% FBS or FGF-2 (10 ng/ml) (Fig. 8E). Overall, these data suggest that FGFRL1 signaling in beta-cells modulates insulin processing and matrix adhesion.
FIGURE 8.

FGFRL1 expression affects β-cell insulin content and matrix adhesion but not cellular proliferation. FGFRL1 overexpressing βTC3 cells exhibited higher total insulin content (A) and greater basal insulin secretion compared with Venus control cells (B). *, p < 0.05 by two-tailed two-sample t test. C and D, FGFRL1 overexpression also enhanced cellular adherence to extracellular matrix substrate components collagen type IV and laminin. Truncation or removal of the C-terminal domain reduced cellular adherence to levels similar to that observed for Venus control cells. n = 3 experimental cultures; three wells/experiment. E, no significant differences in cellular proliferation (5 days) were observed by overexpression of FGFRL1 independent of stimulation media examined (10% FBS or FGF-2, as indicated; 0.2% FBS control cultures). n = 5–7. *, p < 0.05 and N.S. indicates no significance using one-way ANOVA.
DISCUSSION
FGFRL1 is a newly described member of the FGFR family that is expressed in adult pancreas (10, 35). This receptor has an ill-defined role in intracellular signaling due to the absence of a catalytic C-terminal kinase domain. Prevailing models suggest that FGFRL1 acts as a decoy receptor to dampen ligand-induced responses of other FGFRs. Our previous work has explored FGFR1 signaling in beta-cells and the effect on metabolism and cell survival (2, 22, 36). We therefore aimed to determine specific expression of FGFRL1 in pancreatic beta-cells and its role in regulating endogenous FGFR1 signaling.
We first confirmed FGFRL1 expression at the plasma membrane and insulin secretory granules of beta-cells. This localization pattern is consistent with evidence of FGFRL1 secretory granule association in human embryonic kidney and chondrosarcoma cells (37). We further confirmed that localization to and/or retention at granules is directed by the C-terminal portion of the receptor, with defined truncations showing progressively enhanced localization to the plasma membrane and recycling endosomes (12, 31). In this manner, the secretory granule can be considered a reservoir of FGFRL1 (Fig. 9). In contrast to the truncation constructs (RL1-ΔHis and RL1-ΔC) and also confirming previous studies (31), we continued to observe strong localization at secretory granules of constructs that contained point mutations in the SH2-binding motif (Y471A, Y475A, and Y471A/Y475A). These data suggest that localization to granules is directed by the histidine-rich region of the receptor. Because FGFRL1 likely traffics to the plasma membrane via secretory granule exocytosis and the insulin granules are a zinc-rich environment, we postulate that full-length receptor is retained at the granule by interaction with Zn2+ ions that bind to the histidine-rich region (14). We also observed increased association of the truncated mutants with recycling endosomes, further supporting the finding that the C-terminal domain of the receptor directs receptor localization post-internalization. However, this observation may simply reflect a change in the rate-limiting step of receptor turnover from granular localization to accumulation within recycling endosomes. Ultimately, the localization and signaling of FGFRL1 may be dynamically regulated by both phosphorylation and Zn2+ secondary messenger. Future studies are required to dissect the relevance and mechanisms of the regulatory pathways to reveal the contextual effect on FGFRL1 signaling in the beta-cell.
FIGURE 9.

Proposed mechanisms of FGFRL1-directed signaling via SHP-1. Canonical FGF receptors (i.e. FGFR1) activate downstream MAPK signaling events via ligand-induced receptor dimerization and trans-autophosphorylation. Conversely, association of SHP-1 with FGFRL1 at insulin secretory granules may localize the phosphatase, enabling up-regulation of the MAPK pathway (i.e. enhanced ERK1/2 phosphorylation). Alternatively, FGFRL1 at the plasma membrane may bind extracellular FGF ligand to elevate ERK1/2 phosphorylation by means of a MEK-independent signaling cascade.
Unexpectedly, overexpression of full-length FGFRL1 caused a ligand-independent increase in base-line ERK1/2 phosphorylation. We further revealed that this response required the intracellular domain of the receptor and depended upon upstream MEK, as C-terminal truncation or preincubation with the MEK inhibitor U0126 resulted in ERK1/2 phosphorylation levels comparable with controls. The tandem repeat tyrosine residues of the SH2-binding motif specifically play a role in RL1-stimulated ERK1/2 activation, as point mutation of either residue ablated activation. Overall, these data suggest that the ligand-independent ERK1/2 response depends on both the SH2-binding motif as well as the histidine-rich region. We postulate that the ability of full-length RL1 to sequester and activate effector proteins such as SHP-1 at secretory granules results in enhanced base-line ERK1/2 activation (Fig. 9). Activation upon binding to FGFRL1 is consistent with structural evidence that the unbound N-terminal SH2 domain of SHP-1 auto-inhibits its catalytic domain (38). Our evidence further suggests that even if the SH2-binding motif of FGFRL1 is nonfunctional, the receptor does not function as a decoy receptor to block ligand-induced signaling in beta-cells.
FGFRL1 localized at insulin granules is unlikely to participate in binding of extracellular ligand. However, we postulate that binding of SHP-1 to FGFRL1 at the granules accounts for the ligand-independent elevation of ERK1/2 activity (Fig. 9). Consistently, we showed association of endogenous FGFRL1 and SHP-1 in βTC3 cells by co-immunoprecipitation (Fig. 5A) that was dependent upon the intracellular SH2-binding domain of the receptor (significantly less endogenous SHP-1 was associated with the truncated and point-mutated receptor constructs) (Figs. 5C and 6B). Although we have focused on SHP-1 as a known substrate phosphatase expressed in beta-cells, it is not unreasonable to assume that other substrate molecules compete for binding to FGFRL1 at this motif. Our future studies will examine competitive binding of other relevant substrates (e.g. Src kinase, Grb2, and Raf) to determine the ability of FGFRL1 to positively or negatively regulate signaling as a consequence of substrate availability.
Association of SHP-1 with FGFRL1 at insulin secretory granules is particularly intriguing due to a growing body of evidence suggesting these vesicles act as centers/scaffolds to modulate downstream signaling (39). The insulin secretory granule is also a major sink for Zn2+ ions, which are actively pumped into granules for proper packaging and crystallization of insulin (40). A previous study has shown that the histidine-rich C terminus of FGFRL1 directly binds Zn2+ ions (14). We therefore postulate that modulation of Zn2+ ion concentration around the granule (via granule pumps/channels) will directly affect the conformation of the histidine-rich region, consequently regulating availability of the SH2-binding motif for substrate association. Our evidence that C-terminal receptor truncation impairs FGFRL1-induced ERK1/2 activation is consistent with a model in which the SH2-binding motif works in concert with the histidine-rich region. A likely mechanism is that Zn2+-induced conformational changes in the histidine-rich region may affect availability of the SH2-binding motif to offer an alternative mechanism to control FGFRL1 activity.
Our data clearly indicate that FGFRL1 also enhances ligand-induced ERK1/2 responses in beta-cells. We consistently observed greater FGF2-induced ERK1/2 phosphorylation in FGFRL1-overexpressing cells compared with Venus controls indicating that the presence of this unique receptor does not negatively regulate intracellular signaling. Interestingly, receptor truncation mutants also did not prevent FGF2-induced ERK1/2 activation. FGF2 is classically defined as an FGFR1-specific ligand with more moderate binding to FGFRL1 (11, 12). We have therefore interpreted our signaling pathway data as resulting from FGF2 interaction with canonical FGFR1 and subsequent modulation by FGFRL1 (Fig. 9). In this context, our data suggest that FGFRL1 modulates the FGFR1 response to induce MEK-independent activation of ERK1/2, as MEK inhibition was unable to block FGF2-induced ERK1/2 activation in FGFRL1-expressing cells (Fig. 4). This MEK-independent pathway has yet to be defined. Because ligand addition induces this response, it is likely due to ligand-receptor interaction at the plasma membrane; however, it is not clear whether the response is due to FGFR1 interaction with FGFRL1 at the level of the plasma membrane (Fig. 9, dashed line) or more indirectly through intracellular FGFRL1-substrate effects at insulin secretory granules (Fig. 9). MEK-independent activation of ERK1/2 has previously been shown to involve PI3K/Akt mechanisms (41) as well as protein kinase C (PKC) (42–44). The latter signaling pathway has also been postulated to occur through a scaffolded signaling complex that retains activated ERK1/2 in the cytoplasm to make the response less mitogenic (45). Consistently, FGFRL1 expression did not affect βTC3 cellular proliferation independent of stimulus, but rather it modified insulin processing and cell-matrix adhesion.
In summary, these studies showed that predominant beta-cell expression of FGFRL1 at insulin secretory granules was redirected to the cell membrane with truncation of the C terminus of the receptor. Overexpression of full-length receptor elevated ERK1/2 phosphorylation in the absence of ligand through a MEK-dependent mechanism. This response required two tandem tyrosines on the C terminus of FGFRL1 that had been previously recognized as a putative SHP phosphatase-binding site (11). We showed that this motif directed association of SHP-1, a phosphatase expressed in beta-cells, suggesting a model whereby the receptor sequesters and activates SHP-1 at secretory granules to up-regulate base-line ERK1/2 activity (Fig. 9). We postulate that numerous phosphatases/kinases compete for association with the SH2-binding motif resulting in signaling regulation dependent upon substrate availability. Finally, our data suggest that expression and intracellular signaling via FGFRL1 are associated with insulin processing and matrix adhesion in beta-cells. Future studies will need to determine the mechanisms and physiological role(s) of ligand-induced MEK-independent FGFRL1 signaling.
Acknowledgments
We thank Alan Lam (University of Toronto) for assistance with electroporation and Gord McSheffrey (University of Toronto) for consultation and advice regarding SHP-1 studies. Dr. Scott Gray-Owen (University of Toronto) kindly provided the SHP-1 expression vector and the anti-SHP-1 antibody (BD Biosciences), and Dr. Tianru Jin (University Health Network) kindly provided the αTC1 cells.
This work was supported by Canadian Institutes of Health Research Bridge Fund Grant NMD106997 (to J. V. R. and D. M. K.), a Natural Sciences and Engineering Research Council of Canada Discovery Grant (to J. V. R.), and a Novo-Nordisk student scholarship from the University of Toronto Faculty of Medicine Banting and Best Diabetes Centre (to P. N. S.). The confocal microscope used in these studies was purchased using a CFI Leaders Opportunity Fund Grant (to J. V. R.).

This article contains supplemental Fig. S1.
- FGFR
- FGF receptor
- FGFRL1
- fibroblast growth factor receptor-like 1
- SH2
- Src homology domain-2
- ANOVA
- analysis of variance
- MOC
- Manders' overlap coefficient
- eGFP
- enhanced GFP.
REFERENCES
- 1. Hart A. W., Baeza N., Apelqvist A., Edlund H. (2000) Attenuation of FGF signalling in mouse beta-cells leads to diabetes. Nature 408, 864–868 [DOI] [PubMed] [Google Scholar]
- 2. Kilkenny D. M., Rocheleau J. V. (2008) Fibroblast growth factor receptor-1 signaling in pancreatic islet beta-cells is modulated by the extracellular matrix. Mol. Endocrinol. 22, 196–205 [DOI] [PMC free article] [PubMed] [Google Scholar]
- 3. Arany E., Hill D. J. (2000) Ontogeny of fibroblast growth factors in the early development of the rat endocrine pancreas. Pediatr. Res. 48, 389–403 [DOI] [PubMed] [Google Scholar]
- 4. Basilico C., Moscatelli D. (1992) The FGF family of growth factors and oncogenes Adv. Cancer Res. 59, 115–165 [DOI] [PubMed] [Google Scholar]
- 5. Powers C. J., McLeskey S. W., Wellstein A. (2000) Fibroblast growth factors, their receptors and signaling. Endocr. Relat. Cancer 7, 165–197 [DOI] [PubMed] [Google Scholar]
- 6. Mohammadi M., Olsen S. K., Ibrahimi O. A. (2005) Structural basis for fibroblast growth factor receptor activation. Cytokine Growth Factor Rev. 16, 107–137 [DOI] [PubMed] [Google Scholar]
- 7. Haugsten E. M., Sørensen V., Brech A., Olsnes S., Wesche J. (2005) Different intracellular trafficking of FGF1 endocytosed by the four homologous FGF receptors. J. Cell Sci. 118, 3869–3881 [DOI] [PubMed] [Google Scholar]
- 8. Zhen Y., Sørensen V., Jin Y., Suo Z., Wiedl̸ocha A. (2007) Indirubin-3′-monoxime inhibits autophosphorylation of FGFR1 and stimulates ERK1/2 activity via p38 MAPK. Oncogene 26, 6372–6385 [DOI] [PubMed] [Google Scholar]
- 9. Wiedemann M., Trueb B. (2000) Characterization of a novel protein (FGFRL1) from human cartilage related to FGF receptors. Genomics 69, 275–279 [DOI] [PubMed] [Google Scholar]
- 10. Kim I., Moon S., Yu K., Kim U., Koh G. Y. (2001) A novel fibroblast growth factor receptor-5 preferentially expressed in the pancreas. Biochim. Biophys. Acta 1518, 152–156 [DOI] [PubMed] [Google Scholar]
- 11. Sleeman M., Fraser J., McDonald M., Yuan S., White D., Grandison P., Kumble K., Watson J. D., Murison J. G. (2001) Identification of a new fibroblast growth factor receptor, FGFR5. Gene 271, 171–182 [DOI] [PubMed] [Google Scholar]
- 12. Steinberg F., Zhuang L., Beyeler M., Kälin R. E., Mullis P. E., Brändli A. W., Trueb B. (2010) The FGFRL1 receptor is shed from cell membranes, binds fibroblast growth factors (FGFs), and antagonizes FGF signaling in Xenopus embryos. J. Biol. Chem. 285, 2193–2202 [DOI] [PMC free article] [PubMed] [Google Scholar]
- 13. Trueb B. (2011) Biology of FGFRL1, the fifth fibroblast growth factor receptor. Cell. Mol. Life Sci. 68, 951–964 [DOI] [PMC free article] [PubMed] [Google Scholar]
- 14. Zhuang L., Karotki A. V., Bruecker P., Trueb B. (2009) Comparison of the receptor FGFRL1 from sea urchins and humans illustrates evolution of a zinc-binding motif in the intracellular domain. BMC Biochem. 10, 33. [DOI] [PMC free article] [PubMed] [Google Scholar]
- 15. Dichmann D. S., Miller C. P., Jensen J., Scott Heller R., Serup P. (2003) Expression and misexpression of members of the FGF and TGFβ families of growth factors in the developing mouse pancreas. Dev. Dyn. 226, 663–674 [DOI] [PubMed] [Google Scholar]
- 16. Seymour P. A., Shih H. P., Patel N. A., Freude K. K., Xie R., Lim C. J., Sander M. (2012) A Sox9/Fgf feed-forward loop maintains pancreatic organ identity. Development 139, 3363–3372 [DOI] [PMC free article] [PubMed] [Google Scholar]
- 17. Xu X., Browning V. L., Odorico J. S. (2011) Activin, BMP and FGF pathways cooperate to promote endoderm and pancreatic lineage cell differentiation from human embryonic stem cells. Mech. Dev. 128, 412–427 [DOI] [PMC free article] [PubMed] [Google Scholar]
- 18. Hughes S. E. (1997) Differential expression of the fibroblast growth factor receptor (FGFR) multigene family in normal human adult tissues. J. Histochem. Cytochem. 45, 1005–1019 [DOI] [PubMed] [Google Scholar]
- 19. Fon Tacer K., Bookout A. L., Ding X., Kurosu H., John G. B., Wang L., Goetz R., Mohammadi M., Kuro-o M., Mangelsdorf D. J., Kliewer S. A. (2010) Research resource: Comprehensive expression atlas of the fibroblast growth factor system in adult mouse. Mol. Endocrinol. 24, 2050–2064 [DOI] [PMC free article] [PubMed] [Google Scholar]
- 20. Hiriart M., Vidaltamayo R., Sánchez-Soto M. C. (2001) Nerve and fibroblast growth factors as modulators of pancreatic beta cell plasticity and insulin secretion. Isr. Med. Assoc. J. 3, 114–116 [PubMed] [Google Scholar]
- 21. Rivas-Carrillo J. D., Navarro-Alvarez N., Soto-Gutierrez A., Okitsu T., Chen Y., Tabata Y., Misawa H., Noguchi H., Matsumoto S., Tanaka N. (2006) Amelioration of diabetes in mice after single-donor islet transplantation using the controlled release of gelatinized FGF-2. Cell Transplantat. 15, 939–944 [DOI] [PubMed] [Google Scholar]
- 22. Sun M. Y., Yoo E., Green B. J., Altamentova S. M., Kilkenny D. M., Rocheleau J. V. (2012) Autofluorescence imaging of living pancreatic islets reveals fibroblast growth factor-21 (FGF21)-induced metabolism. Biophys. J. 103, 2379–2388 [DOI] [PMC free article] [PubMed] [Google Scholar]
- 23. Nagai T., Ibata K., Park E. S., Kubota M., Mikoshiba K., Miyawaki A. (2002) A variant of yellow fluorescent protein with fast and efficient maturation for cell-biological applications. Nat. Biotechnol. 20, 87–90 [DOI] [PubMed] [Google Scholar]
- 24. Wasmeier C., Hutton J. C. (1996) Molecular cloning of phogrin, a protein-tyrosine phosphatase homologue localized to insulin secretory granule membranes. J. Biol. Chem. 271, 18161–18170 [DOI] [PubMed] [Google Scholar]
- 25. Pouli A. E., Emmanouilidou E., Zhao C., Wasmeier C., Hutton J. C., Rutter G. A. (1998) Secretory-granule dynamics visualized in vivo with a phogrin-green fluorescent protein chimaera. Biochem. J. 333, 193–199 [DOI] [PMC free article] [PubMed] [Google Scholar]
- 26. Choudhury A., Dominguez M., Puri V., Sharma D. K., Narita K., Wheatley C. L., Marks D. L., Pagano R. E. (2002) Rab proteins mediate Golgi transport of caveola-internalized glycosphingolipids and correct lipid trafficking in Niemann-Pick C cells. J. Clin. Invest. 109, 1541–1550 [DOI] [PMC free article] [PubMed] [Google Scholar]
- 27. Manders E. M., Stap J., Brakenhoff G. J., van Driel R., Aten J. A. (1992) Dynamics of three-dimensional replication patterns during the S-phase, analysed by double labelling of DNA and confocal microscopy. J. Cell Sci. 103, 857–862 [DOI] [PubMed] [Google Scholar]
- 28. Zinchuk O., Fukushima A., Hangstefer E. (2004) Dynamics of PAF-induced conjunctivitis reveals differential expression of PAF receptor by macrophages and eosinophils in the rat. Cell Tissue Res. 317, 265–277 [DOI] [PubMed] [Google Scholar]
- 29. Beazely M. A., Lim A., Li H., Trepanier C., Chen X., Sidhu B., Macdonald J. F. (2009) Platelet-derived growth factor selectively inhibits NR2B-containing N-methyl-d-aspartate receptors in CA1 hippocampal neurons. J. Biol. Chem. 284, 8054–8063 [DOI] [PMC free article] [PubMed] [Google Scholar]
- 30. Micou M. K., Kilkenny D. M. (2012) A Laboratory Course in Tissue Engineering, Taylor & Francis Ltd., London [Google Scholar]
- 31. Rieckmann T., Zhuang L., Flück C. E., Trueb B. (2009) Characterization of the first FGFRL1 mutation identified in a craniosynostosis patient. Biochim. Biophys. Acta 1792, 112–121 [DOI] [PubMed] [Google Scholar]
- 32. Trueb B., Zhuang L., Taeschler S., Wiedemann M. (2003) Characterization of FGFRL1, a novel fibroblast growth factor (FGF) receptor preferentially expressed in skeletal tissues. J. Biol. Chem. 278, 33857–33865 [DOI] [PubMed] [Google Scholar]
- 33. Burren O. S., Adlem E. C., Achuthan P., Christensen M., Coulson R. M., Todd J. A. (2011) T1DBase: update 2011, organization and presentation of large-scale data sets for type 1 diabetes research. Nucleic Acids Res. 39, D997–D1001 [DOI] [PMC free article] [PubMed] [Google Scholar]
- 34. Rankin M. M., Kushner J. A. (2010) Aging induces a distinct gene expression program in mouse islets. Islets 2, 345–352 [DOI] [PMC free article] [PubMed] [Google Scholar]
- 35. Su A. I., Wiltshire T., Batalov S., Lapp H., Ching K. A., Block D., Zhang J., Soden R., Hayakawa M., Kreiman G. (2004) A gene atlas of the mouse and human protein-encoding transcriptomes. Proc. Natl. Acad. Sci. U.S.A. 101, 6062–6067 [DOI] [PMC free article] [PubMed] [Google Scholar]
- 36. Ming A. Y., Yoo E., Vorontsov E. N., Altamentova S. M., Kilkenny D. M., Rocheleau J. V. (2012) Dynamics and Distribution of Klothoβ (KLB) and fibroblast growth factor receptor-1 (FGFR1) in living cells reveal the fibroblast growth factor-21 (FGF21)-induced receptor complex. J. Biol. Chem. 287, 19997–20006 [DOI] [PMC free article] [PubMed] [Google Scholar]
- 37. Rieckmann T., Kotevic I., Trueb B. (2008) The cell surface receptor FGFRL1 forms constitutive dimers that promote cell adhesion. Exp. Cell Res. 314, 1071–1081 [DOI] [PubMed] [Google Scholar]
- 38. Wang W., Liu L., Song X., Mo Y., Komma C., Bellamy H. D., Zhao Z. J., Zhou G. W. (2011) Crystal structure of human protein-tyrosine phosphatase SHP-1 in the open conformation. J. Cell. Biochem. 112, 2062–2071 [DOI] [PMC free article] [PubMed] [Google Scholar]
- 39. Suckale J., Solimena M. (2010) The insulin secretory granule as a signaling hub. Trends Endocrinol. Metab. 21, 599–609 [DOI] [PubMed] [Google Scholar]
- 40. Hutton J. C., Penn E. J., Peshavaria M. (1983) Low-molecular-weight constituents of isolated insulin-secretory granules. Bivalent cations, adenine nucleotides, and inorganic phosphate. Biochem. J. 210, 297–305 [DOI] [PMC free article] [PubMed] [Google Scholar]
- 41. Aksamitiene E., Kholodenko B. N., Kolch W., Hoek J. B., Kiyatkin A. (2010) PI3K/Akt-sensitive MEK-independent compensatory circuit of ERK activation in ER-positive PI3K-mutant T47D breast cancer cells. Cell. Signal. 22, 1369–1378 [DOI] [PMC free article] [PubMed] [Google Scholar]
- 42. Bapat S., Verkleij A., Post J. (2001) Peroxynitrite activates mitogen-activated protein kinase (MAPK) via a MEK-independent pathway: a role for protein kinase C. FEBS Lett. 499, 21–26 [DOI] [PubMed] [Google Scholar]
- 43. Albrecht D. S., Clubbs E. A., Ferruzzi M., Bomser J. A. (2008) Epigallocatechin-3-gallate (EGCG) inhibits PC-3 prostate cancer cell proliferation via MEK-independent ERK1/2 activation. Chem. Biol. Interact. 171, 89–95 [DOI] [PubMed] [Google Scholar]
- 44. Tapinos N., Rambukkana A. (2005) Insights into regulation of human Schwann cell proliferation by Erk1/2 via a MEK-independent and p56Lck-dependent pathway from leprosy bacilli. Proc. Natl. Acad. Sci. U.S.A. 102, 9188–9193 [DOI] [PMC free article] [PubMed] [Google Scholar]
- 45. DeFea K. A., Zalevsky J., Thoma M. S., Déry O., Mullins R. D., Bunnett N. W. (2000) β-Arrestin-dependent endocytosis of proteinase-activated receptor 2 is required for intracellular targeting of activated ERK1/2. J. Cell Biol. 148, 1267–1281 [DOI] [PMC free article] [PubMed] [Google Scholar]