

Abstract
Metabolites, the chemical entities that are transformed during metabolism, provide a functional readout of cellular biochemistry. With emerging technologies in mass spectrometry, thousands of metabolites can now be quantitatively measured from minimal amounts of biological material, which has thereby enabled systems-level analyses. By performing global metabolite profiling, also known as untargeted metabolomics, new discoveries linking cellular pathways to biological mechanism are being revealed and shaping our understanding of cell biology, physiology, and medicine.
Metabolites are small molecules that are chemically transformed during metabolism and, as such, they provide a functional readout of cellular state. Unlike genes and proteins, whose function is subject to epigenetic regulation and post-translational modifications respectively, metabolites serve as direct signatures of biochemical activity and they are therefore easier to correlate with phenotype. In this context, metabolite profiling, or metabolomics, has become a powerful approach that has been widely adopted for clinical diagnostics.
The metabolome, typically defined as the collection of small molecules produced by cells, offers a window to interrogate how mechanistic biochemistry relates to cellular phenotype. With developments in mass spectrometry, it is now possible to rapidly measure thousands of metabolites simultaneously from only minimal amounts of sample1. In particular, recent innovations in instrumentation, bioinformatic tools, and software enable the comprehensive analysis of cellular metabolites without bias. In many instances, these metabolites can be spatially localized within biological specimens with imaging mass spectrometry2, 3.
The application of these technologies has revealed system-wide alterations of unexpected metabolic pathways in response to phenotypic perturbations. Moreover, many of the molecules detected are currently not included in databases and metabolite repositories, indicating the extent to which our picture of cellular metabolism is incomplete4, 5. Nonetheless, the field of metabolomics has made remarkable progress within the last decade and implemented new tools that have offered mechanistic insights by allowing for the correlation of biochemical changes with phenotype.
In this Innovation article we first define, and differentiate between the targeted and untargeted approaches to metabolomics. We then highlight the value of untargeted metabolomics in particular and outline a guide to performing such studies. Finally, selected applications of untargeted metabolomics are described and their potential in cell biology is discussed.
Designing a metabolomic experiment
The first step in performing metabolomics is to determine the number of metabolites to be measured. In some instances, it may be of interest to examine a defined set of metabolites by using a targeted approach. In other cases, an untargeted or global approach may be taken in which as many metabolites as possible are measured and compared between samples without bias. Ultimately, the number and chemical composition of metabolites to be studied is a defining attribute of any metabolomic experiment that and shapes experimental design with respect to sample preparation and choice of instrumentation.
Targeted metabolomics
This approach refers to a method in which a specified list of metabolites is measured, typically focusing on one or more related pathways of interest6. Targeted metabolomic approaches are commonly driven by a specific biochemical question or hypothesis that motivates the investigation of a particular pathway. This approach can be effective for pharmacokinetic studies of drug metabolism as well as for measuring the influence of therapeutics or genetic modifications on a specific enzyme7. Developments in mass spectrometry (MS) and nuclear magnetic resonance (NMR) offer distinct advantages for performing targeted metabolomic studies because of their specificity and quantitative reproducibility, however, there are many analytical tools available for measuring metabolites that could in principle be considered such as ultraviolet-visible spectroscopy and flame ionization. Although the term “metabolomics” was only recently coined, examples of targeted studies of metabolites date back to the earliest of scientific inquiries8–12. Therefore, there is a wealth of literature investigating optimal protocols for the sample preparation and analysis of specific classes of metabolites that has been discussed extensively elsewhere13–17.
Not to diminish their significance, targeted approaches have undoubtedly played an important role in the development of the field of metabolomics. In particular, advances have been made in using triple quadrupole (QqQ) MS to perform selected reaction monitoring experiments such that routine methods are now available to analyze most of the metabolites in central carbon metabolism as well as amino acids and nucleotides at their naturally occurring physiological concentrations18–20. These developments provide a highly sensitive and robust method to measure a significant number of biologically important metabolites with relatively high throughput. Additionally, QqQ MS methods are quantitatively reliable and therefore offer opportunities to achieve absolute quantitation of low-concentration metabolites that are difficult to detect with less sensitive methods such as NMR (Fig. 2). (Fig. 2) By applying QqQ MS-based methods to human plasma, targeted lists of metabolites can be screened as potential metabolic signatures for disease. For example, targeted screening recently revealed citric acid metabolites and a small group of essential amino acids as metabolic signatures of myocardial ischemia and diabetes respectively.21, 22 In another diabetes-related study, targeted metabolomic methods were used to investigate patient response to glucose challenge.23 Here, the levels of specific plasma metabolites were measured after glucose ingestion to determine insulin response in patients.
Figure 2. The untargeted and targeted workflow for LC/MS-based metabolomics.
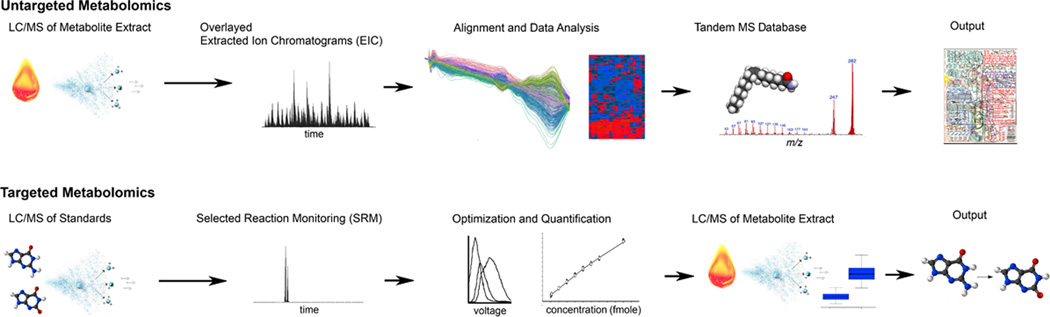
The untargeted metabolomic workflow (top). Metabolites are first isolated from tissues, biofluids, or cell cultures and subsequently analyzed by LC/MS. After data acquisition, the results are processed by using bioinformatic software such as XCMS to perform nonlinear retention time alignment and identify metabolite features that are changing between the groups of samples measured. Metabolite features of interest are searched in metabolite databases on the basis of accurate mass to obtain putative identifications. Putative identifications are then confirmed by comparison of MS/MS and retention time data to that of standards. The untargeted workflow is global in scope and outputs data related to comprehensive cellular metabolism. The targeted metabolomic workflow (bottom). First, standard compounds for the metabolites of interest are obtained and used to setup selected reaction monitoring methods. Here instrument voltages are established and concentration curves are generated for absolute quantitation. After the targeted methods have been established on the basis of standards, the metabolic extract is analyzed from the research samples. The data output provides quantitation only of those metabolites for which standard methods have been built.
Untargeted metabolomics
Untargeted metabolomic methods are global in scope and have the aim to simultaneously measure as many metabolites as possible from biological samples without bias. Although untargeted metabolomics can be performed by using either NMR or MS technologies, liquid chromatography followed by MS (LC/MS) enables the detection of the most metabolites and has therefore been the technique of choice for global metabolite profiling efforts24–27. By using LC/MS-based metabolomic methods, thousands of peaks can be routinely detected from biological samples14, 28, 29. Each of these peaks are referred to as metabolite features and correspond to a detected ion with a unique mass-to-charge ratio and a unique retention time (it should be noted that some metabolites may produce more than one feature).
In contrast to targeted metabolomic results, untargeted metabolomic datasets are exceedingly complex with file sizes on the order of gigabytes per sample for some new high-resolution MS instruments. Manual inspection of the thousands of peaks detected is impractical and complicated by experimental drifts in instrumentation. In LC/MS experiments, for example, there are deviations in retention time from sample to sample as a consequence of column degradation, sample carryover, small fluctuations in room temperature and mobile phase pH, and so on. Although these challenges initially presented significant obstacles for interpreting untargeted profiling data, major progress has been made in the last decade such that the ability to measure dysregulated features in global metabolomic datasets has now become routine with the introduction of metabolomic software such as MathDAMP, MetAlign, MZMine, and XCMS1, 30–34. These accomplishments have already had an impact in revealing not only that an astounding number of metabolites remain uncharacterized with respect to their structure and function, but also that many of these uncharacterized metabolites change as a function of health and disease4. It is in this area that untargeted metabolomics has great potential to provide insights into fundamental biological processes. The remainder of this article will focus on the untargeted metabolomic approach.
Impetus for untargeted metabolomics
In 1941, G. Beadle and E. L. Tatum proposed the one gene–one enzyme hypothesis. This hypothesis was based on their experimental results showing that X-ray-induced mutant strains of the fungus Neurospora crassa were unable to carry out specific biochemical reactions35, 36. By systematically adding individual compounds to minimal N. crassa media and screening for those that rescued the growth of mutant strains, Beadle and Tatum identified metabolites whose biosynthesis had been affected by genetic mutation. In doing so they were the first to directly connect genotype to phenotype at the molecular level. From their results they purported that a single gene serves as the primary control of a single function, in this case a specific chemical reaction.
In many ways, modern day metabolomic experiments seek to similarly connect genotype and phenotype by metabolite screening. The experimental screening methods used today, however, are much advanced and allow us to study many more compounds simultaneously. Additionally, contemporary metabolic profiling experiments have the advantage of being complemented by genomic sequencing and proteomic screening37–40. From the combination of these global analyses, the field of systems biology has emerged and shown us that the effects of a single nonlethal gene mutation can be dauntingly large41. Indeed, single gene mutations can affect a significant number of metabolic pathways, thereby complicating the hypothesis that a single gene controls a single function (Figure 1). Moreover, mutations in some unique genes have unexpected phenotypic effects. As an example, consider the daf-2 gene which encodes an insulin-like receptor in the nematode worm Caenorhabditis elegans. Mutations in daf-2 cause C. elegans to live more than twice as long as its wild type counterpart and result in alterations in the abundance of at least 86 identified proteins42, 43. Or, as another example, consider genes that encode for enzymes of the phosphatidyl-inositol 3-kinase family. The protein products of these genes function in cell growth, proliferation, differentiation, motility, signal transduction, and mutations in these genes are thought to have an oncogenic role in some cancers44.
Figure 1. The central dogma of biology and the ‘omic’ cascade.

While genes and proteins are subject to regulatory epigenetic processes and post-translational modifications respectively, metabolites represent downstream biochemical end products that are closer to the phenotype. Alterations in a single gene (illustrated by blue dots) or a single protein can lead to a cascade of metabolite alterations. In the theoretical schematic shown, up- and down-regulated metabolites are shown in red and unaltered metabolites are shown in grey. Untargeted metabolomics aims at comprehensively profiling metabolites without bias to identify changes that correlate with cellular function or phenotype. By performing meta-analysis, metabolic alterations shared between multiple animal models or multiple genetic modifications may be identified as shown by the superimposed Venn diagram.
As these examples highlight, one gene can influence a multitude of metabolic pathways and thereby have a functional role in many cellular processes. Even knowledge of encoded protein structure is often insufficient to infer function at the whole-organism level. Such functions can have intricate regulatory mechanisms involving epigenetic control, post-translational modifications, and feedback loops that enable context-dependent activation or deactivation. Thus, investigations to detangle the role of any one specific gene benefit from systems-level analyses. While these types of global studies were once limited to genes, transcripts, and proteins, technological developments over the last decade now allow for the untargeted profiling of metabolites and provide opportunities to comprehensively track metabolic reactions directly for the first time.
Untargeted metabolomic workflow
Although untargeted metabolomic experiments are often hypothesis generating rather than hypothesis driven, it is important to carefully construct an experimental design that maximizes the number of metabolites detected and their quantitative reproducibility. With the workflow that is described below, metabolite identification is a manual and time-intensive process. Thus, the choice of sample type, preparation, chromatographic separation, and analytical instrumentation should be considered and the choice that is most likely to yield high-quality data used for analysis. Here we focus on an LC/MS-based workflow because this technique enables the detection of the highest number of metabolites and requires only minimal amounts of sample (for example, typically less than 25 mg of tissue, around 1 million cells, or approximately 50 µL of biofluids such as plasma and urine).
Sample preparation and data acquisition
The first step in the untargeted metabolomic workflow is to isolate metabolites from biological samples (Figure 3a). Several approaches involving sample homogenization and protein precipitation have been utilized, which are described in detail elsewhere14, 15, 45, 46. Prior to MS analysis, isolated metabolites are separated chromatographically by using relatively short solvent gradients (on the order of minutes) that allow for high-throughput analysis of large numbers of samples. Given the heterogeneous physiochemical landscape of the metabolome, multiplexing extraction and separation methods maximizes the number of metabolites detected47. For example, extracting the same cells with both organic and aqueous solvents increases the number of hydrophobic and hydrophilic compounds observed, respectively. Similarly, reversed-phase chromatography is better suited for the separation of hydrophobic metabolites, whereas hydrophilic-interaction chromatography generally separates hydrophilic compounds more effectively. Most frequently data is collected on a quadruopole time-of-flight (QTOF) mass spectrometer or an Orbitrap mass spectometer, but other time-of-flight and ion trap instruments can also be used28, 29, 48. Given the challenge of predicting tandem MS (MS/MS) fragmentation patterns for most metabolites, unlike in shotgun ‘omic approaches, untargeted metabolomic profiling data is typically acquired in MS1 mode (that is, only the mass-to-charge ratio (m/z) of the intact metabolite is measured) 49, 50.
Figure 3. Metabolite characterization in the untargeted metabolomic workflow.

In LC/MS-based untargeted metabolomics, metabolites are identified on the basis of accurate mass, retention time, and MS/MS data. Experimental and standard data are shown here for the metabolite A2E (A2-ethanolamine) as an example of the identification process. The accurate mass as measured from the mass spectrometer (obs.) is less than 3 ppm different than that theoretically expected (theo.) on the basis of the compound’s molecular formula. This mass error is within the range expected from most modern mass spectrometers. The retention time of the research sample (38.9 min, black) is then compared to that of a standard (39.0, red). Finally, to confirm an assignment, a follow-up targeted MS/MS analysis is performed. The MS/MS data from the research sample are shown in black and the MS/MS data from the standard are shown in red. As illustrated, all three experimental data parameters are consistent with those obtained from the standard, thereby supporting the identification of A2E in the research sample.
Data analysis
With recent developments in bioinformatic tools, identification of metabolite features that are differentially altered between sample groups has become a relatively automated process. Several metabolomic software programs that provide a method for peak picking, non-linear retention time alignment, visualization, relative quantitation, and statistics are available1, 51. The most widely used metabolomic software is XCMS, which is freely available online where users can upload data, perform data processing, and browse results within a web-based interface1 (https://xcmsonline.scripps.edu/).
Metabolite identification
It is important to note that the metabolomic software currently available does not output metabolite identifications. Rather, it provides a table of features with p-values and fold changes related to their difference in relative intensity between samples. To determine the identity of a feature of interest, the accurate mass of the compound is first searched in metabolite databases such as the Human Metabolome Database and METLIN52–54 (http://www.hmdb.ca/ and http://metlin.scripps.edu/). A database match represents only a putative metabolite assignment that must be confirmed by comparing the retention time and MS/MS data of a model compound to that from the feature of interest in the research sample (Figure 3b). Currently, MS/MS data for features selected from the profiling results are obtained from additional experiments and matching of MS/MS fragmentation patterns is performed manually by inspection. These additional analyses are time intensive and represent the rate-limiting step of the untargeted metabolomic workflow. Additionally, although metabolite databases have grown considerably over the last decade, a substantial number of metabolite features detected from biological samples do not return any matches. Identification of these unknown features requires de novo characterization with traditional methods. Taken together, it should be recognized that comprehensive identification of all metabolite features detected by LC/MS is currently impractical for most samples analyzed.
Addressing the challenges
Untargeted metabolomics has revealed that the number of endogenous metabolites in biological systems is larger than anticipated and cannot be accounted for merely by canonical biochemical pathways. That is, the masses of a significant fraction of compounds detected in global analyses do not match any of the masses included in metabolite databases. Therefore, given that the metabolome is not encoded in the genome like proteins and transcripts, systems-level studies of metabolites are complicated by attempting to analyze an undefined set of molecules. In response to this challenge, metabolite databases have expanded rapidly over the last decade. Although database expansion has facilitated untargeted studies, there are still many metabolites for which the chemical structure, cellular function, biochemical pathway, and anatomical location remain uncharacterized. Here, innovative technologies and experimental strategies that can be coupled with untargeted profiling are driving progress in the field.
Improving metabolite databases
Over the last decade, the information catalogued in metabolite databases has evolved beyond lists of one-dimensional data that is traditionally acquired by mass spectrometry- and NMR-based screens. The Human Metabolome Database, for example, includes a “MetaboCard” for each of its included metabolites (~8550).52, 53 In addition to having molecular weights and experimental NMR spectra, the MetaboCards list information on each compound’s biochemical pathway, concentration, anatomical location, metabolizing enzymes, and related disorders when available. Currently, the Human Metabolome Database and METLIN are among the most widely used metabolite databases publicly available.54–56 Similar to the Human Metabolome database, METLIN contains experimental data for a subset of the total number of compounds included (~45000). In METLIN, MS/MS data is available for more than 10000 metabolites. For each of these metabolites, MS/MS data were experimentally generated from model compounds analyzed at four different collision energies in both positive and negative mode. When used together with other publicly available tools, the Human Metabolome and METLIN databases can facilitate both metabolite identification as well as data interpretation.
Meta-analysis: prioritizing unknowns
Alterations in a single enzyme can lead to a cascade of metabolic perturbations that are functionally unrelated to the phenotype of interest. Untargeted metabolomic profiling of a particular disease or mutant can therefore reveal hundreds of alterations that are unlikely to have mechanistic implications. Given the resources needed to identify both known and unknown compounds, strategies to reduce lists of potentially interesting features prior to the time commitment of identification are of great utility. One such strategy is meta-analysis, by which untargeted profiling data from multiple studies are compared (Figure 1). By comparing multiple models of a disease, for example, features that are not similarly altered in each of the comparisons may be de-prioritized as being less likely to be related to the shared phenotypic pathology. To automate the comparison of untargeted metabolomic data, freely available software called metaXCMS has been recently developed57. As proof of concept, metaXCMS was applied to investigate three pain models of different pathogenic etiologies: inflammation, acute heat, and spontaneous arthritis58. While hundreds of metabolite features were found to be altered in each model, only three were similarly dysregulated among all the groups. One of the shared metabolites was identified as histamine, a well-characterized mediator of pain that works by several mechanisms. The application of similar data-reduction strategies to other biological systems may justify aggressive analytical investigations of unknown features likely to be physiologically relevant.
Imaging approaches to localize metabolites
One of the first steps in the untargeted metabolomic workflow applied to biological tissue is metabolite isolation by sample homogenization. Thus, standard metabolic profiling techniques do not permit high-resolution spatial localization of metabolites within samples. Investigations of heterogeneous tissues such as the brain are therefore complicated by the averaging of various cell types, each with a potentially unique metabolome. Given these limitations, correlating a dysregulated metabolite with a specific region of tissue or cell type can be challenging.
NMR-based imaging technologies have been applied to spatially localize metabolites in intact samples, but these methods have limited chemical specificity and sensitivity59–61. By contrast, MS-based approaches relying on matrix-assisted laser desorption ionization (MALDI) offer improved chemical specificity and sensitivity but they are limited in their application to metabolites due to background interference caused by the matrix in the low-mass region characteristic of metabolites62. As an alternative, a matrix-free technique called nanostructure-initiator mass spectrometry (NIMS) has been developed for the analysis of metabolites with high sensitivity and spatial resolution (Figure 4)63, 64. By using NIMS to analyze 3 µm sections of brain tissue from mice with impaired cholesterol biosynthesis, metabolic precursors of cholesterol were found to localize to the cerebellum and brainstem2. These types of NIMS imaging applications coupled with histology will allow metabolite localization patterns to be correlated with tissue pathology and drive developments in our understanding of chemical physiology.
Figure 4. Spatial localization of metabolites in tissue by mass spectrometry-based imaging.

An example of a surface-based image of cholesterol from mouse brain by using nanostructure-initiator mass spectrometry (NIMS, reference 2). NIMS is well suited for metabolite imaging because it is highly sensitive and does not suffer from matrix interference in the low-mass range. Sections of frozen tissue are first transferred to a NIMS chip that is subsequently analyzed by using a laser-induced desorption/ionization approach (bottom). By systematically rastering the laser across the tissue, a mass spectrum is generated from each point. The mass spectral intensity of the metabolite of interest is plotted spatially to generate images as shown for cholesterol here (top, m/z 493.26).
Untargeted metabolomics applied
Given its sensitivity, high-throughput and minimal sample requirements, untargeted metabolomics has wide applicability across a myriad of biological questions. Despite its relatively recent emergence as a global profiling technology, untargeted metabolomics has already increased our understanding of comprehensive cellular metabolism and been utilized to address a number of biomedical issues. Among the biomedical applications in which untargeted metabolomics has provided unique insight is in identifying altered metabolic pathways in disease that represent novel drug targets, an evolving application referred to as “therapeutic metabolomics”.65, 66 An example of this application is the discovery of increased levels of the metabolite 2-hydroxyglutarate in cancer cells with isocitrate dehydrogenase 1 mutations, which are a common feature of a major subset of primary human brain cancers.67 These results suggest that inhibition of 2-hydroxyglutarate production may be an effective therapeutic approach to slow or halt conversion of a low-grade glioma into lethal secondary glioblastoma. In another example, levels of the sphingolipid dimethylsphingosine were found to be increased in the spinal cords of rats suffering from neuropathic pain.68 Increased levels of dimethylsphingosine were determined to induce pain-like behavior in vivo and point to the inhibition of methyltransferase or ceramidase as potential therapeutic approaches for treating chronic pain by blocking dimethylsphingosine production.
Another area in which untargeted metabolomics has been successfully applied is in characterizing gene and protein function. In addition to successfully identifying the function of unknown genes and proteins, untargeted profiling has been applied to discover new functions for known genes and proteins. By screening for metabolites that accumulate after gene mutation or enzyme inhibition, unanticipated connections between the proteome and metabolome have been established that were not accurately predicted from in vitro activity measurements.69 As a demonstration of characterizing a yeast gene of unknown function (YKL215C), untargeted methods were applied to organisms harboring a mutation in YKL215C. Increased levels of 5-oxoproline were detected in these organisms, allowing the assignment of YKL215C as an oxoprolinase.48 In an independent study, an untargeted screen identified a previously unidentified activity for the yeast enzyme sedoheptulose-1,7-bisphosphatase. The finding that sedoheptulose-1,7-biosphosphatase hydrolyzes sedoheptulose-1,7-bisphosphate to sedoheptulose-7-phosphate identified a thermodynamically driven route from trioses produced by glycolysis to the synthesis of ribose.70 A similar type of enzyme-activity characterization was also accomplished for Mycobacterium tuberculosis by incubating a purified recombinant enzyme with a mycobacterial small molecule extract. The small molecule extract was analyzed by LC/MS for altered substrate and product, leading the incompletely characterized protein Rv1248c to be assigned as a 2-hydroxy-3-oxoadipate synthase71. As these examples highlight, untargeted metabolomics not only has implications for therapeutic screening, but also for providing chemical insight across a broad area of mechanistic cell biology.
Concluding remarks
While there has been a longstanding interest in metabolic profiling, only recently have technologies emerged that enable the global analysis of metabolites at a systems level comparable to its ‘omic predecessors. Unlike genomics, transcriptomics, and proteomics, however, metabolomics provides a tool to measure biochemical activity directly by monitoring the substrates and products transformed during cellular metabolism. Untargeted profiling of these chemical transformations at a global level serves as a phenotypic readout that can be used effectively in clinical diagnostics, to identify therapeutic targets of disease, and to investigate the mechanisms of fundamental biological processes.
Although untargeted metabolomics is still in its infancy, early studies have shown that the complexity of comprehensive cellular metabolism exceeds that expected based on classical biochemical pathways. In this sense, our understanding of metabolism is evolving much like our notion of physics evolved in the early twentieth century with the emergence of experimental results such as the photoelectric effect, which could not be explained by Newtonian laws72, 73. Ultimately, the ideas that emerged from this disparity resulted in a new set of principles for understanding physical phenomena known as quantum mechanics. As metabolomic technologies continue to advance and facilitate the characterization of unknown pathways, the potential of untargeted metabolomics to shape our understanding of global metabolism is yet to be fully realized.
Box 1: Glossary of Terms.
Imaging mass spectrometry; Nuclear magnetic resonance (NMR); triple quadrupole (QqQ) MS; liquid chromatography (LC)/MS; MathDAMP, MetAlign, MZMine, XCMS: bioinformatic software for analyzing untargeted LC/MS-based metabolomic data; quadruopole time-of-flight (QTOF) mass spectrometer; Orbitrap mass spectometer; ion trap; metaXCMS; matrix-assisted laser desorption ionization (MALDI); nanostructure-initiator mass spectrometry (NIMS).
References
- 1.Smith CA, Want EJ, O'Maille G, Abagyan R, Siuzdak G. XCMS: processing mass spectrometry data for metabolite profiling using nonlinear peak alignment, matching, and identification. Anal Chem. 2006;78:779–787. doi: 10.1021/ac051437y. [DOI] [PubMed] [Google Scholar]
- 2.Patti GJ, et al. Nanostructure-initiator mass spectrometry (NIMS) imaging of brain cholesterol metabolites in Smith-Lemli-Opitz syndrome. Neuroscience. 2010;170:858–864. doi: 10.1016/j.neuroscience.2010.07.038. [DOI] [PMC free article] [PubMed] [Google Scholar]
- 3.Koizumi S, et al. Imaging mass spectrometry revealed the production of lyso-phosphatidylcholine in the injured ischemic rat brain. Neuroscience. 2010;168:219–225. doi: 10.1016/j.neuroscience.2010.03.056. [DOI] [PubMed] [Google Scholar]
- 4.Baker M. Metabolomics: from small molecules to big ideas. Nat Meth. 2011;8:117–121. [Google Scholar]
- 5.Kind T, Scholz M, Fiehn O. How large is the metabolome? A critical analysis of data exchange practices in chemistry. PLoS One. 2009;4:e5440. doi: 10.1371/journal.pone.0005440. [DOI] [PMC free article] [PubMed] [Google Scholar]
- 6.Dudley E, Yousef M, Wang Y, Griffiths WJ. Targeted metabolomics and mass spectrometry. Adv Protein Chem Struct Biol. 2010;80:45–83. doi: 10.1016/B978-0-12-381264-3.00002-3. [DOI] [PubMed] [Google Scholar]
- 7.Nicholson JK, Connelly J, Lindon JC, Holmes E. Metabonomics: a platform for studying drug toxicity and gene function. Nat Rev Drug Discov. 2002;1:153–161. doi: 10.1038/nrd728. [DOI] [PubMed] [Google Scholar]
- 8.Dirren H, Robinson AB, Pauling L. Sex-related patterns in the profiles of human urinary amino acids. Clin Chem. 1975;21:1970–1975. [PubMed] [Google Scholar]
- 9.Davison JM, Cheyne GA. History of the measurement of glucose in urine: a cautionary tale. Med Hist. 1974;18:194–197. doi: 10.1017/s002572730001944x. [DOI] [PMC free article] [PubMed] [Google Scholar]
- 10.Robinson AB, Robinson NE. Origins of metabolic profiling. Methods Mol Biol. 2011;708:1–23. doi: 10.1007/978-1-61737-985-7_1. [DOI] [PubMed] [Google Scholar]
- 11.Dalgliesh CE, Horning EC, Horning MG, Knox KL, Yarger K. A gas-liquid-chromatographic procedure for separating a wide range of metabolites occuring in urine or tissue extracts. Biochem J. 1966;101:792–810. doi: 10.1042/bj1010792. [DOI] [PMC free article] [PubMed] [Google Scholar]
- 12.Eknoyan G. Santorio Sanctorius (1561–1636) - founding father of metabolic balance studies. Am J Nephrol. 1999;19:226–233. doi: 10.1159/000013455. [DOI] [PubMed] [Google Scholar]
- 13.Astarita G, Ahmed F, Piomelli D. Lipidomic analysis of biological samples by liquid chromatography coupled to mass spectrometry. Methods Mol Biol. 2009;579:201–219. doi: 10.1007/978-1-60761-322-0_10. [DOI] [PubMed] [Google Scholar]
- 14.Want EJ, et al. Solvent-dependent metabolite distribution, clustering, and protein extraction for serum profiling with mass spectrometry. Anal Chem. 2006;78:743–752. doi: 10.1021/ac051312t. [DOI] [PubMed] [Google Scholar]
- 15.Yanes O, Tautenhahn R, Patti GJ, Siuzdak G. Expanding coverage of the metabolome for global metabolite profiling. Anal Chem. 2011;83:2152–2161. doi: 10.1021/ac102981k. [DOI] [PMC free article] [PubMed] [Google Scholar]
- 16.Pike LS, Smift AL, Croteau NJ, Ferrick DA, Wu M. Inhibition of fatty acid oxidation by etomoxir impairs NADPH production and increases reactive oxygen species resulting in ATP depletion and cell death in human glioblastoma cells. Biochim Biophys Acta. 2011;1807:726–734. doi: 10.1016/j.bbabio.2010.10.022. [DOI] [PubMed] [Google Scholar]
- 17.Buxton DB, Schwaiger M, Nguyen A, Phelps ME, Schelbert HR. Radiolabeled acetate as a tracer of myocardial tricarboxylic acid cycle flux. Circ Res. 1988;63:628–634. doi: 10.1161/01.res.63.3.628. [DOI] [PubMed] [Google Scholar]
- 18.Bajad SU, et al. Separation and quantitation of water soluble cellular metabolites by hydrophilic interaction chromatography-tandem mass spectrometry. J Chromatogr A. 2006;1125:76–88. doi: 10.1016/j.chroma.2006.05.019. [DOI] [PubMed] [Google Scholar]
- 19.Bennett BD, et al. Absolute metabolite concentrations and implied enzyme active site occupancy in Escherichia coli. Nat Chem Biol. 2009;5:593–599. doi: 10.1038/nchembio.186. [DOI] [PMC free article] [PubMed] [Google Scholar]
- 20.Buescher JM, Moco S, Sauer U, Zamboni N. Ultrahigh performance liquid chromatography-tandem mass spectrometry method for fast and robust quantification of anionic and aromatic metabolites. Anal Chem. 2010;82:4403–4412. doi: 10.1021/ac100101d. [DOI] [PubMed] [Google Scholar]
- 21.Sabatine MS, et al. Metabolomic identification of novel biomarkers of myocardial ischemia. Circulation. 2005;112:3868–3875. doi: 10.1161/CIRCULATIONAHA.105.569137. [DOI] [PubMed] [Google Scholar]
- 22.Wang TJ, et al. Metabolite profiles and the risk of developing diabetes. Nat Med. 2011;17:448–453. doi: 10.1038/nm.2307. [DOI] [PMC free article] [PubMed] [Google Scholar]
- 23.Shaham O, et al. Metabolic profiling of the human response to a glucose challenge reveals distinct axes of insulin sensitivity. Mol Syst Biol. 2008;4:214. doi: 10.1038/msb.2008.50. [DOI] [PMC free article] [PubMed] [Google Scholar]
- 24.Barton RH, Nicholson JK, Elliott P, Holmes E. High-throughput 1H NMR-based metabolic analysis of human serum and urine for large-scale epidemiological studies: validation study. Int J Epidemiol. 2008;37(Suppl 1):i31–i40. doi: 10.1093/ije/dym284. [DOI] [PubMed] [Google Scholar]
- 25.Buscher JM, Czernik D, Ewald JC, Sauer U, Zamboni N. Cross-platform comparison of methods for quantitative metabolomics of primary metabolism. Anal Chem. 2009;81:2135–2143. doi: 10.1021/ac8022857. [DOI] [PubMed] [Google Scholar]
- 26.Jonsson P, et al. Extraction, interpretation and validation of information for comparing samples in metabolic LC/MS data sets. Analyst. 2005;130:701–707. doi: 10.1039/b501890k. [DOI] [PMC free article] [PubMed] [Google Scholar]
- 27.Nordstrom A, Want E, Northen T, Lehtio J, Siuzdak G. Multiple ionization mass spectrometry strategy used to reveal the complexity of metabolomics. Anal Chem. 2008;80:421–429. doi: 10.1021/ac701982e. [DOI] [PubMed] [Google Scholar]
- 28.Wikoff WR, et al. Metabolomics analysis reveals large effects of gut microflora on mammalian blood metabolites. Proc Natl Acad Sci U S A. 2009;106:3698–3703. doi: 10.1073/pnas.0812874106. [DOI] [PMC free article] [PubMed] [Google Scholar]
- 29.Yanes O, et al. Metabolic oxidation regulates embryonic stem cell differentiation. Nat Chem Biol. 2010;6:411–417. doi: 10.1038/nchembio.364. [DOI] [PMC free article] [PubMed] [Google Scholar]
- 30.Baran R, et al. MathDAMP: a package for differential analysis of metabolite profiles. BMC Bioinformatics. 2006;7:530. doi: 10.1186/1471-2105-7-530. [DOI] [PMC free article] [PubMed] [Google Scholar]
- 31.Lommen A. MetAlign: interface-driven, versatile metabolomics tool for hyphenated full-scan mass spectrometry data preprocessing. Anal Chem. 2009;81:3079–3086. doi: 10.1021/ac900036d. [DOI] [PubMed] [Google Scholar]
- 32.Katajamaa M, Miettinen J, Oresic M. MZmine: toolbox for processing and visualization of mass spectrometry based molecular profile data. Bioinformatics. 2006;22:634–636. doi: 10.1093/bioinformatics/btk039. [DOI] [PubMed] [Google Scholar]
- 33.Katajamaa M, Oresic M. Processing methods for differential analysis of LC/MS profile data. BMC Bioinformatics. 2005;6:179. doi: 10.1186/1471-2105-6-179. [DOI] [PMC free article] [PubMed] [Google Scholar]
- 34.Tautenhahn R, Bottcher C, Neumann S. Highly sensitive feature detection for high resolution LC/MS. BMC Bioinformatics. 2008;9:504. doi: 10.1186/1471-2105-9-504. [DOI] [PMC free article] [PubMed] [Google Scholar]
- 35.Beadle GW, Tatum EL. Genetic Control of Biochemical Reactions in Neurospora. Proc Natl Acad Sci U S A. 1941;27:499–506. doi: 10.1073/pnas.27.11.499. [DOI] [PMC free article] [PubMed] [Google Scholar]
- 36.Tatum EL, Beadle GW. Genetic Control of Biochemical Reactions in Neurospora: An "Aminobenzoicless" Mutant. Proc Natl Acad Sci U S A. 1942;28:234–243. doi: 10.1073/pnas.28.6.234. [DOI] [PMC free article] [PubMed] [Google Scholar]
- 37.Suhre K, et al. Human metabolic individuality in biomedical and pharmaceutical research. Nature. 2011;477:54–60. doi: 10.1038/nature10354. [DOI] [PMC free article] [PubMed] [Google Scholar]
- 38.Nicholson G, et al. Human metabolic profiles are stably controlled by genetic and environmental variation. Mol Syst Biol. 2011;7:525. doi: 10.1038/msb.2011.57. [DOI] [PMC free article] [PubMed] [Google Scholar]
- 39.Fiehn O. Combining genomics, metabolome analysis, and biochemical modelling to understand metabolic networks. Comp Funct Genomics. 2001;2:155–168. doi: 10.1002/cfg.82. [DOI] [PMC free article] [PubMed] [Google Scholar]
- 40.Trauger SA, et al. Correlating the transcriptome, proteome, and metabolome in the environmental adaptation of a hyperthermophile. J Proteome Res. 2008;7:1027–1035. doi: 10.1021/pr700609j. [DOI] [PubMed] [Google Scholar]
- 41.Kirschner MW. The meaning of systems biology. Cell. 2005;121:503–504. doi: 10.1016/j.cell.2005.05.005. [DOI] [PubMed] [Google Scholar]
- 42.Kenyon C, Chang J, Gensch E, Rudner A, Tabtiang R. A C. elegans mutant that lives twice as long as wild type. Nature. 1993;366:461–464. doi: 10.1038/366461a0. [DOI] [PubMed] [Google Scholar]
- 43.Dong MQ, et al. Quantitative mass spectrometry identifies insulin signaling targets in C. elegans. Science. 2007;317:660–663. doi: 10.1126/science.1139952. [DOI] [PubMed] [Google Scholar]
- 44.Kang S, Bader AG, Vogt PK. Phosphatidylinositol 3-kinase mutations identified in human cancer are oncogenic. Proc Natl Acad Sci U S A. 2005;102:802–807. doi: 10.1073/pnas.0408864102. [DOI] [PMC free article] [PubMed] [Google Scholar]
- 45.Villas-Boas SG, Hojer-Pedersen J, Akesson M, Smedsgaard J, Nielsen J. Global metabolite analysis of yeast: evaluation of sample preparation methods. Yeast. 2005;22:1155–1169. doi: 10.1002/yea.1308. [DOI] [PubMed] [Google Scholar]
- 46.Wittmann C, Kromer JO, Kiefer P, Binz T, Heinzle E. Impact of the cold shock phenomenon on quantification of intracellular metabolites in bacteria. Anal Biochem. 2004;327:135–139. doi: 10.1016/j.ab.2004.01.002. [DOI] [PubMed] [Google Scholar]
- 47.Patti GJ. Separation strategies for untargeted metabolomics. J Sep Sci. 2011 doi: 10.1002/jssc.201100532. [DOI] [PubMed] [Google Scholar]
- 48.Lu W, et al. Metabolomic analysis via reversed-phase ion-pairing liquid chromatography coupled to a stand alone orbitrap mass spectrometer. Anal Chem. 2010;82:3212–3221. doi: 10.1021/ac902837x. [DOI] [PMC free article] [PubMed] [Google Scholar]
- 49.Han X, Gross RW. Shotgun lipidomics: electrospray ionization mass spectrometric analysis and quantitation of cellular lipidomes directly from crude extracts of biological samples. Mass Spectrom Rev. 2005;24:367–412. doi: 10.1002/mas.20023. [DOI] [PubMed] [Google Scholar]
- 50.Wolters DA, Washburn MP, Yates JR., 3rd An automated multidimensional protein identification technology for shotgun proteomics. Anal Chem. 2001;73:5683–5690. doi: 10.1021/ac010617e. [DOI] [PubMed] [Google Scholar]
- 51.Melamud E, Vastag L, Rabinowitz JD. Metabolomic analysis and visualization engine for LC-MS data. Anal Chem. 2010;82:9818–9826. doi: 10.1021/ac1021166. [DOI] [PMC free article] [PubMed] [Google Scholar]
- 52.Wishart DS, et al. HMDB: a knowledgebase for the human metabolome. Nucleic Acids Res. 2009;37:D603–D610. doi: 10.1093/nar/gkn810. [DOI] [PMC free article] [PubMed] [Google Scholar]
- 53.Forsythe IJ, Wishart DS. Exploring human metabolites using the human metabolome database. Curr Protoc Bioinformatics. 2009;82 doi: 10.1002/0471250953.bi1408s25. Chapter 14, Unit14 8. [DOI] [PubMed] [Google Scholar]
- 54.Smith CA, et al. METLIN: a metabolite mass spectral database. Ther Drug Monit. 2005;27:747–751. doi: 10.1097/01.ftd.0000179845.53213.39. [DOI] [PubMed] [Google Scholar]
- 55. http://www.hmdb.ca/
- 56. http://metlin.scripps.edu/
- 57.Patti GJ, Tautenhahn R, Siuzdak G. Meta-analysis of untargeted metabolomic data from multiple profiling experiments. Nature Protocols. doi: 10.1038/nprot.2011.454. (in press) [DOI] [PMC free article] [PubMed] [Google Scholar]
- 58.Tautenhahn R, et al. metaXCMS: second-order analysis of untargeted metabolomics data. Analytical chemistry. 2011;83:696–700. doi: 10.1021/ac102980g. [DOI] [PMC free article] [PubMed] [Google Scholar]
- 59.Bottomley PA, Hardy CJ, Roemer PB. Phosphate metabolite imaging and concentration measurements in human heart by nuclear magnetic resonance. Magn Reson Med. 1990;14:425–434. doi: 10.1002/mrm.1910140302. [DOI] [PubMed] [Google Scholar]
- 60.Golman K, Zandt RI, Lerche M, Pehrson R, Ardenkjaer-Larsen JH. Metabolic imaging by hyperpolarized 13C magnetic resonance imaging for in vivo tumor diagnosis. Cancer Res. 2006;66:10855–10860. doi: 10.1158/0008-5472.CAN-06-2564. [DOI] [PubMed] [Google Scholar]
- 61.Cakmakci H, Pekcevik Y, Yis U, Unalp A, Kurul S. Diagnostic value of proton MR spectroscopy and diffusion-weighted MR imaging in childhood inherited neurometabolic brain diseases and review of the literature. Eur J Radiol. 2010;74:e161–e171. doi: 10.1016/j.ejrad.2009.05.048. [DOI] [PubMed] [Google Scholar]
- 62.Greving MP, Patti GJ, Siuzdak G. Nanostructure-initiator mass spectrometry metabolite analysis and imaging. Analytical chemistry. 2011;83:2–7. doi: 10.1021/ac101565f. [DOI] [PMC free article] [PubMed] [Google Scholar]
- 63.Northen TR, et al. Clathrate nanostructures for mass spectrometry. Nature. 2007;449:1033–1036. doi: 10.1038/nature06195. [DOI] [PubMed] [Google Scholar]
- 64.Woo HK, Northen TR, Yanes O, Siuzdak G. Nanostructure-initiator mass spectrometry: a protocol for preparing and applying NIMS surfaces for high-sensitivity mass analysis. Nat Protoc. 2008;3:1341–1349. doi: 10.1038/nprot.2008.110. [DOI] [PubMed] [Google Scholar]
- 65.Siuzdak G. State of metabolomics technologies in translational research 6. Bethesda, Maryland: National Insittues of Health; 2010. [Google Scholar]
- 66.Rabinowitz JD, Purdy JG, Vastag L, Shenk T, Koyuncu E. Metabolomics in Drug Target Discovery. Cold Spring Harb Symp Quant Biol. 2011 doi: 10.1101/sqb.2011.76.010694. [DOI] [PMC free article] [PubMed] [Google Scholar]
- 67.Dang L, et al. Cancer-associated IDH1 mutations produce 2-hydroxyglutarate. Nature. 2009;462:739–744. doi: 10.1038/nature08617. [DOI] [PMC free article] [PubMed] [Google Scholar]
- 68.Patti GJ, et al. Metabolomics Implicates Altered Sphingolipid Metabolites in Chronic Pain of Neuropathic Origin. Nature Chemical Biology. doi: 10.1038/nchembio.767. (in press) [DOI] [PMC free article] [PubMed] [Google Scholar]
- 69.Saghatelian A, et al. Assignment of endogenous substrates to enzymes by global metabolite profiling. Biochemistry. 2004;43:14332–14339. doi: 10.1021/bi0480335. [DOI] [PubMed] [Google Scholar]
- 70.Clasquin MF, et al. Riboneogenesis in yeast. Cell. 2011;145:969–980. doi: 10.1016/j.cell.2011.05.022. [DOI] [PMC free article] [PubMed] [Google Scholar]
- 71.de Carvalho LP, et al. Activity-based metabolomic profiling of enzymatic function: identification of Rv1248c as a mycobacterial 2-hydroxy-3-oxoadipate synthase. Chem Biol. 2010;17:323–332. doi: 10.1016/j.chembiol.2010.03.009. [DOI] [PMC free article] [PubMed] [Google Scholar]
- 72.Feynman RP, Leighton RB, Sands ML. The Feynman lectures on physics. Addison-Wesley Pub., Co.; Boston: 1963. [Google Scholar]
- 73.Segre E. From x-rays to quarks: modern physicists and their discoveries. Dover Publications; New York: 2007. [Google Scholar]