

Abstract
Background and Purpose
We have previously shown that arginase inhibition alleviates hypertension associated with in a diabetic animal model. Here, we investigated the protective effect of arginase inhibition on hypertension in metabolic syndrome.
Experimental Approach
Metabolic syndrome was induced in rats by administration of fructose (10% in drinking water) for 12 weeks to induce vascular dysfunction. Three arginase inhibitors (citrulline, norvaline and ornithine) were administered daily in the last 6 weeks of study before and tail BP was recorded in conscious animals. Concentration response curves for phenylephrine (PE), KCl and ACh in addition to ACh-induced NO generation were obtained in thoracic aorta rings. Serum glucose, insulin, uric acid and lipid profile were determined as well as reactive oxygen species (ROS) and arginase activity.
Key Results
Arginase activity was elevated in metabolic syndrome while significantly inhibited by citrulline, norvaline or ornithine treatment. Metabolic syndrome was associated with elevations in systolic and diastolic BP, while arginase inhibition significantly reduced elevations in diastolic and systolic BP. Metabolic syndrome increased vasoconstriction responses of aorta to PE and KCl and decreased vasorelaxation to ACh, while arginase inhibition completely prevented impaired responses to ACh. In addition, arginase inhibition prevented impaired NO generation and exaggerated ROS formation in metabolic syndrome. Furthermore, arginase inhibition significantly reduced hyperinsulinaemia and hypertriglyceridaemia without affecting hyperuricaemia or hypercholesterolaemia associated with metabolic syndrome.
Conclusions and Implications
Arginase inhibition alleviates hypertension in metabolic syndrome directly through endothelial-dependent relaxation/NO signalling protection and indirectly through inhibition of insulin resistance and hypertriglyceridaemia.
Keywords: metabolic syndrome, aorta, hypertension, arginase, citrulline, norvaline
Introduction
Using the World Health Organization definition and data from the National Health and Nutrition Examination Survey, the age-adjusted prevalence of the metabolic syndrome in the United States is estimated at 24% and increases to 44% in adults who are over 60 years (Ford et al., 2002). The metabolic syndrome is characterized by the variable coexistence of hyperinsulinaemia, obesity, dyslipidaemia and hypertension. The pathogenesis of the syndrome has multiple origins. Obesity and sedentary lifestyle coupled with diet as well as still largely unknown genetic factors clearly interact to produce the syndrome (Kolovou et al., 2005). Insulin resistance, which is a hallmark of metabolic disorders, including type 2 diabetes mellitus, is also characterized by endothelial dysfunction (Kim et al., 2006). Insulin, beside its essential metabolic action, it has also important vascular action which includes NO production from endothelium leading to vasodilatation and augmentation of glucose disposal in skeletal muscle (Kim et al., 2006). Accordingly, insulin resistance is at most a modest determinant of hypertension and blood pressure (Saad et al., 2004).
Reduced availability of L-arginine to endothelial NOS (eNOS) has been implicated in vascular dysfunction in diabetes and a variety of other disease conditions. Arginase, which metabolizes L-arginine to urea and ornithine, competes directly with NOS for L-arginine. Hence, increases in arginase activity can decrease tissue and cellular arginine levels, reducing its availability to eNOS (Romero et al., 2008). This may lead to decreased NO production and increased production of superoxide by eNOS (Berkowitz et al., 2003). Enhanced arginase activity has been implicated in a number of conditions characterized by vascular dysfunction, including diabetic erectile dysfunction (Bivalacqua et al., 2001), pulmonary hypertension (Morris et al., 2003) and coronary artery dysfunction (Zhang et al., 2004). During diabetes, impaired vascular function is closely associated with oxidative stress and vascular inflammation (Romero et al., 2008; El-Bassossy et al., 2011a), both of which have been associated with increases in arginase activity and expression (Bivalacqua et al., 2001). In addition, increased arginase activity has been reported in diabetic patients and can be reduced by insulin treatment (Kashyap et al., 2008). Furthermore, arginase inhibition restores in vivo coronary microvascular function in type 2 diabetic Goto Kakizaki rats (Gronros et al., 2011) and protects from renal injury in a streptozotocin model of diabetes (Morris et al., 2011).
In addition to the production of urea, arginase is also involved in the biosynthesis of polyamines and the amino acids, ornithine, proline and glutamate (Cederbaum et al., 2004). As such, it is not surprising that amino acids such as ornithine, norvaline and citrulline inhibit arginase (Hunter and Downs, 1945).
Therefore, the aim of the present work was to examine the potentially protective effect of the arginase inhibition in the metabolic syndrome and illustrate the mechanism of this protective effect.
Materials and methods
Animals
Studies are reported in accordance with the ARRIVE guidelines for reporting experiments involving animals (Kilkenny et al., 2010; McGrath et al., 2010), and carried out in strict accordance with institutional animal care and use guidelines consistent with UK standards of care. Seventy-two male Wistar rats (6 weeks age; Zagazig University, Zagazig, Egypt) were used in the present study and housed in standard light/dark cycles with access to standard rat diet ad libitum.
Study protocol
Animals were randomly divided into five experimental groups (eight animals each): control, metabolic syndrome (M), citrulline-treated metabolic syndrome (M-citrulline), norvaline-treated metabolic syndrome (M-norvaline) and ornithine-treated metabolic syndrome (M-ornithine). In addition, the effect of arginase inhibitors on control was studies in three groups: citrulline-treated control, norvaline-treated control and ornithine-treated control. Metabolic syndrome was maintained by giving fructose 10% in drinking water ad libitum daily for 12 weeks. After 6 weeks, treated rats were received citrulline (50 mg·kg−1), norvaline (50 mg·kg−1) and ornithine (200 mg·kg−1) treatment as solution (0.8–1 mL) in distilled water by orogastric gavage for 6 weeks of study while control and resistant groups receive water as a vehicle instead. The doses of citrulline, norvaline and ornithine were chosen based upon their reported arginase inhibiting activity (Kang et al., 2000; Romero et al., 2008) and confirmed by arginase activity measurement.
At the end of the study and 12 h after the last gavage, blood pressure was measured. Rats were then terminally anaesthetized with diethyl ether and blood was collected from the retro-orbital plexus and centrifuged (3000× g, 4°C, 20 min) to separate serum that was analysed for glucose, uric acid, lipid profile and arginase activity. Then, through opening the abdomen, descending thoracic aorta was carefully excised and placed in a Petri dish filled with cold Krebs–Henseleit buffer containing (in mM): NaCl 118.1, KCl 4.69, KH2PO4 1.2, NaHCO3 25.0, glucose 11.7, MgSO4 0.5 and CaCl2 2.5. The aorta was cleaned of excess connective tissue and fat and cut into rings of approximately 3 mm in length. For each animal, one aortic ring was suspended in an organ bath for studying vascular reactivity while the second was used to study ACh-induced NO generation and the third for measuring the reactive oxygen species (ROS) content. In order to study the acute effect on vascular reactivity, aorta from resistant animals were incubated in organ bath with arginase inhibitors; citrulline, norvaline or ornithine (all at 1 mM) for 1 h before studying vascular reactivity. These concentrations and time were chosen based upon those used in previous reports (Fuentes et al., 1994; Huynh et al., 2009) plus our preliminary data. In order to investigate the effect of hyperuricaemia on vascular reactivity, aortae or kidney isolated from normal animals were incubated with uric acid (200 μM), arginase inhibitors or L-arginine for 1 h before studying the effect on vascular reactivity or arginase activity. The uric acid incubation concentration was chosen based upon the serum level of uric acid in animals with metabolic syndrome observed in our study.
Arginase activity
Arginase activity was measured in serum of chronically treated animals and in the incubation buffer of isolated aorta after in vitro treatment by the colorimetric determination of the arginase enzyme product, urea (Mendez et al., 2002). Briefly, 100 μL serum or the incubation buffer was incubated for 1 h with reaction mixture containing the activator (manganese sulphate) and substrate (arginine) in carbonate buffer (pH 9.5). The produced urea was condensed with diacetylmonoxime in an acid medium in the presence of ferric chloride (oxidant) and carbazide (accelerator). Then, the absorbance was measured at 525 nm by 6105 UV/Vis spectrophotometer (Jenway®, Essex, UK). For the in vitro experiments, the measured activities were normalized to the wet weight of the aortic rings.
Serum analysis
Serum glucose was determined colorimetrically using a Randox reagent kit (Antrim, UK). Triglycerides (TGs) and total cholesterol were estimated enzymatically using Boehringer Mannheim® colorimetric kit (Mannheim, Germany). Uric acid was measured colorimetrically by uricase method; uric acid is converted into hydrogen peroxide, which forms a red-coloured quinoneimine dye measured at 520 nm. (Fossati et al., 1980).
Serum insulin level was assayed by sandwich elisa (Millipore, Cairo, Egypt) that uses microtiter plate coated with mouse monoclonal anti-rat insulin antibodies. The estimated insulin resistance index (HOMA-IR) was calculated using the serum fasting glucose and insulin levels according to the following equation (Matthews et al., 1985): HOMA-IR = glucose concentration (mmol·L−1) × insulin (μU·L−1)/22.5.
BP measurement
BP was measured indirectly in a conscious and slightly restrained rat by the tail cuff method (El-Bassossy et al., 2012b) using non-invasive blood pressure system attached to a computerized data acquisition system (ADI Instruments, Cairo, Egypt). For these measurements, rats were conditioned to the restraint and the warming chamber for 10–20 min·day−1 for at least 3 days before measurements. BP measurements were performed from 7:00 a.m. to 12:00 p.m. by the same investigator. After 5–10 min of stabilization in a warming chamber (35°C), a typical run involved 10 repetitions of the automated inflation–deflation cycle. The mean of six readings within a 5–10 mmHg range was taken as the BP.
Vascular reactivity
Vascular reactivity was studied using the isolated artery technique (El-Bassossy et al., 2009). Thoracic aorta rings were suspended under 8 mN resting tension in individual 30 mL organ chambers containing Krebs–Henseleit buffer at 37°C and aerated with 95% oxygen, 5% carbon dioxide. Ring tension was determined by use of an isometric force transducer (ADI Instruments, Cairo, Egypt). Force displacement was recorded with a PowerLab Data Interface Module connected to a PC running Chart software v7 (ADI Instruments). Rings were equilibrated for 60 min during which time the bath solution was changed every 30 min. Before beginning the experiment, vessel viability was assessed by exposing arteries to KCl (80 mM). This was repeated until stable responses were achieved (usually two exposures). For studying the vasoconstrictor responsiveness of aorta, cumulative concentrations of phenylephrine (PE, 10−9 to 10−5 M) or KCl (10 to 100 mM) were added to the organ bath and the response was recorded. For studying the vasodilator responsiveness of aorta, rings were first pre-contracted with submaximal concentrations of PE (3 × 10⁻⁷ M in the case of the diabetic group and 10−6 M in other groups). The submaximal concentration of PE was chosen to give similar precontraction in all studied groups. The cumulative concentrations of acetylcholine (ACh, 10−9 to 10−5 M) were then added to the organ bath and the response was recorded. At the end of experiment, aortic rings were removed and weighted. The recorded responses were normalized to the wet weight of the used aortic rings.
Microvascular reactivity
In order to support our vascular reactivity findings, part of the experiments was repeated in a microvascular system using the isolated perfused kidney. The rat kidney was isolated and perfused as previously described (El-Mas et al., 2011) with slight modifications. Briefly, rats were killed by cervical dislocation followed by followed by decapitation, the abdomen was opened by a midline incision and the left kidney was exposed. The left renal artery was dissected free from the surrounding fat. Loose ties were made around the renal artery. A bevelled 18-gauge needle connected to a 5 mL syringe filled with heparinized saline (100 U·mL−1) was used for cannulation. The left renal artery was cannulated via an incision made in the aorta. The cannula was immediately secured with ligatures and the kidney was flushed with heparinized saline and rapidly excised from its surrounding tissues. The kidney was transferred into a jacketed glass chamber maintained at 37°C and continuously perfused with Krebs–Henseleit buffer aerated with 95% oxygen, 5% carbon dioxide. Kidney perfusion was adjusted at a constant flow rate of 5 mL·min−1 using a Masterflex® peristaltic pump (Cole-palmer, Jubail, Saudi Arabia) and the venous effluent was allowed to drain freely. The kidney perfusion pressure was continuously monitored by means of a Gould–Statham pressure transducer distal to the pump and recorded using a PowerLab Data Interface Module connected to a PC running Chart software v7 (ADI Instruments). As the renal flow was kept constant, changes in perfusion pressure were indicative of alterations in renal microvascular resistance. A 30 min equilibration period was allowed at the beginning of the experiment to ensure stabilization of the kidney perfusion pressure. For studying the renal microvascular relaxation, isolated kidneys were first continuously perfused with PE (10 μM). After another 30 min equilibration, vasodilatory responses of the renal vasculature to bolus doses injections of ACh (0.1, 1, 100, 500 nmol) were established. After washout, uric acid (200 μM) was added to the perfusion medium for another 1 h. Then, the renovascular dilatation to ACh was repeated. After wash out, citrulline was added to the perfusion medium for 30 min and the renovascular dilatation to ACh was investigated.
ACh-induced NO generation
The real-time generation of intracellular NO following ACh stimulation was investigated with the fluorescence probes 4-amino-5-methylamino-2′,7′-difluorofluorescein diacetate (DAF-FM) according to the method described by El-Bassossy et al. (2011b; 2012a). The aorta rings isolated from chronically treated animals were loaded for 30 min at 37°C with 5 mM of DAF-FM diacetate plus 0.1% Pluronic F-127 in Krebs–Henseleit buffer containing 25 mM HEPES. Aorta rings were washed twice and then cut and placed in a chamber designed especially for fluorescence measurement in aortic segments with the endothelial side up. 100 μL of Krebs–Henseleit buffer containing HEPES were added quickly to the chamber. DAF fluorescence was measured using a LS45 fluorescence spectrophotometer (PerkinElmer®, Cairo, Egypt) with remote fibre optic, which allows measurement of tissue fluorescence in the sample chamber. Readings (λex = 485, λem = 515 nm) were taken before and every 5 s after ACh (10−4 M) addition. The NO donor diethyl amine NONOate (100 nM) was used as a positive control for DAF.
Intracellular of ROS generation
The intracellular levels of ROS were determined by the fluorescent probe dichlorofluorescein diacetate (DCF-DA) according to the method described previously by (Ugochukwu and Cobourne, 2003) with slight modification. Frozen aortae were homogenized in 20 parts (w/v) of 0.32 M sucrose solution in ice and the centrifuged at 2000 rpm at 4°C for 15 min. Then, 100 μL of the supernatant was added to 1900 μL 18:1 40 mM·L−1 Tris (pH 7.4): HEPES buffer (10 mM HEPES, 120 mM NaCl, 2.5 mM KCl, 1.2 mM NaH2PO4, 0.1 mM MgCl2, 5 mM NaHCO3, 6 mM glucose, and 1 mM CaCl2) containing 5 μM DCF-DA plus 0.1% Pluronic F-127. The fluorescence was measured (λex = 485, λem = 515 nm) before and after 2 h of incubation at 37°C. The difference in fluorescence per hour was used as indicative for ROS formation.
Drugs and chemicals
The following drugs and chemicals were used: STZ, ACh, PE, SNP, L-Norvaline, L-Ornithine, L-citrulline (Sigma-Aldrich, Munich, Germany); uric acid (Oxford Laboratory, Mumbai, India). All the used chemicals were dissolved in double distilled water.
Statistical analysis
All data are expressed as mean ± SEM. Statistical analysis was performed by anova followed by Newman–Keuls' post hoc test using a computer-based curve fitting program (Prism 5, Graphpad, San Diego, CA, USA). Correlation was calculated using Pearson's correlation coefficient.
Results
Arginase activity
Fructose administration (10% in drinking water) was associated by a significant elevation in serum arginase activity compared to control (P < 0.001, Figure 1A) while this activation of arginase enzyme was significantly inhibited by all the arginase inhibitors used: citrulline, norvaline and ornithine (P < 0.001, Figure 1A). In vitro incubation of aortae isolated from normal animals with uric acid (200 μM, 1 h) did not significantly affected arginase activity. However, incubation with citrulline (1 mM, 1 h) significantly inhibited arginase activity in isolated aorta compared with control (P < 0.01, Figure 1B). On the other hand, incubation with L-arginine (1 mM, 1 h) led to a significant increase in arginase activity compared with control (P < 0.05, Figure 1B).
Figure 1.
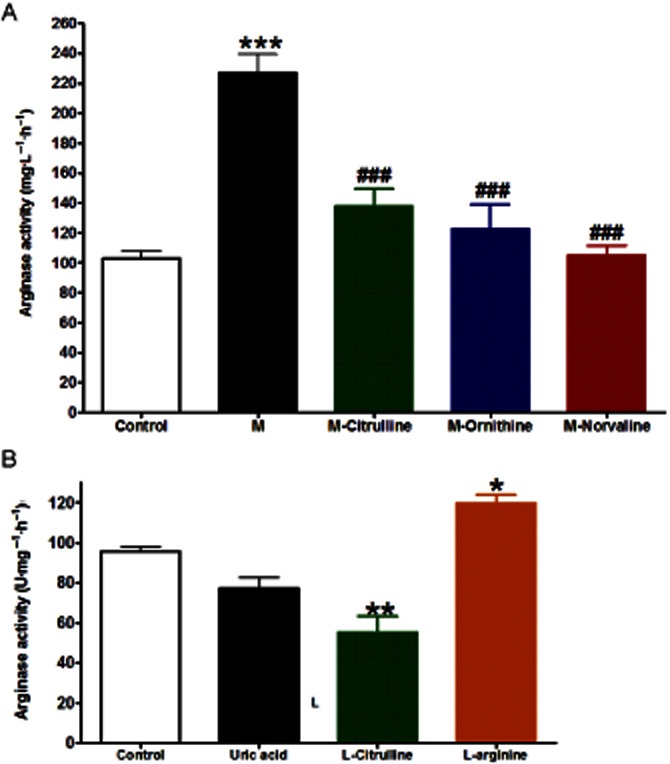
Effect of fructose-induced metabolic syndrome (M, 10% in drinking water, for 12 weeks) and daily oral administration (last 6 weeks) of citrulline (50 mg·kg−1), norvaline (50 mg·kg−1) or ornithine (200 mg·kg−1) on serum arginase activity (A) or the effect of in vitro incubation with uric acid (400 μM, 1 h), citrulline (1 mM, 1 h) or arginine (1 mM, 1 h) on aortic arginase activity (B). *P < 0.05, **P < 0.01, ***P < 0.001, compared with the corresponding control group values; #P < 0.05, ##P < 0.01, ###P < 0.001 compared with the corresponding M group values; by one-way anova and Newman–Keuls post hoc test.
Serum parameters
Fructose administration for 12 weeks led to a significant elevation in blood glucose and insulin levels and the insulin resistance index (all at P < 0.001) compared with control (Table 1). Arginase inhibition by citrulline, norvaline or ornithine significantly inhibited the developed hyperglycaemia, hyperinsulinaemia and insulin resistance associated with fructose administration (all at P < 0.001, Table 1). Fructose administration was also associated with hypertriglyceridaemia (P < 0.001), hypercholesterolaemia (P < 0.001) and hyperuricaemia (P < 0.001). While arginase inhibition by citrulline, norvaline or ornithine completely prevented the developed hypertriglyceridaemia (all at P < 0.001), it did not significantly affect the developed hypercholesterolaemia or hyperuricaemia (Table 1). In addition, there were strong statistically significant correlations between arginase activity (as shown in Figure 1) and each of the following: insulin resistance index (r = 0.71, P < 0.01) and triglycerides (r = 0.81, P < 0.001) in all experimental groups.
Table 1.
Effect of fructose-induced metabolic syndrome (M, 10% in drinking water, for 12 weeks) and daily oral administration (last 6 weeks) of citrulline (50 mg·kg−1), norvaline (50 mg·kg−1) or ornithine (200 mg·kg−1) on serum levels of glucose and insulin, insulin resistance (IR) index, triglycerides, total cholesterol and uric acid
| Treatment | Glucose (mg·ml−1) | Insulin (μg·l−1) | IR index | Triglycerides (mg·ml−1) | Total cholesterol (mg·ml−1) | Uric acid (mM) |
|---|---|---|---|---|---|---|
| Control | 6.1 ± 0.6 | 3.4 ± 0.4 | 0.5 ± 0.1 | 9.4 ± 0.8 | 5.7 ± 0.7 | 0.4 ± 0.03 |
| M | 12.0 ± 0.7*** | 13.0 ± 0.9*** | 3.9 ± 0.6*** | 16.5 ± 2.3*** | 13.8 ± 1.0*** | 3.2 ± 0.1*** |
| M-Citrulline | 6.9 ± 0.6### | 5.2 ± 0.6### | 0.9 ± 0.1### | 7.6 ± 0.5### | 13.6 ± 0.9 | 3.1 ± 0.2 |
| M-Ornithine | 6.8 ± 1.1### | 5.4 ± 1.1### | 1.0 ± 0.3### | 4.7 ± 0.4### | 13.3 ± 1.7 | 2.3 ± 0.2 |
| M-Norvaline | 8.8 ± 0.4## | 5.6 ± 1.3### | 1.2 ± 0.2### | 7.7 ± 0.8### | 11.9 ± 1.0 | 2.8 ± 0.2 |
Values are expressed as the mean ± SE of mean; n = 8 animals; *P < 0.05, **P < 0.01, ***P < 0.001, compared with the corresponding control group values; #P < 0.05, ##P < 0.01, ###P < 0.001 compared with the corresponding metabolic syndrome group values; by one-way anova and Newman–Keuls post hoc test.
Blood pressure
Fructose administration was associated with significant elevations in systolic and diastolic BP (both at P < 0.001, Figure 2). The elevation in systolic BP was significantly inhibited by citrulline (P < 0.01), ornithine (P < 0.01) and norvaline (P < 0.001) treatment while the elevated diastolic BP was significantly inhibited by all the arginase inhibitors used (all at P < 0.001, Figure 2). In addition, diastolic BP significantly correlated with arginase activity (r = 0.66, P < 0.001).
Figure 2.
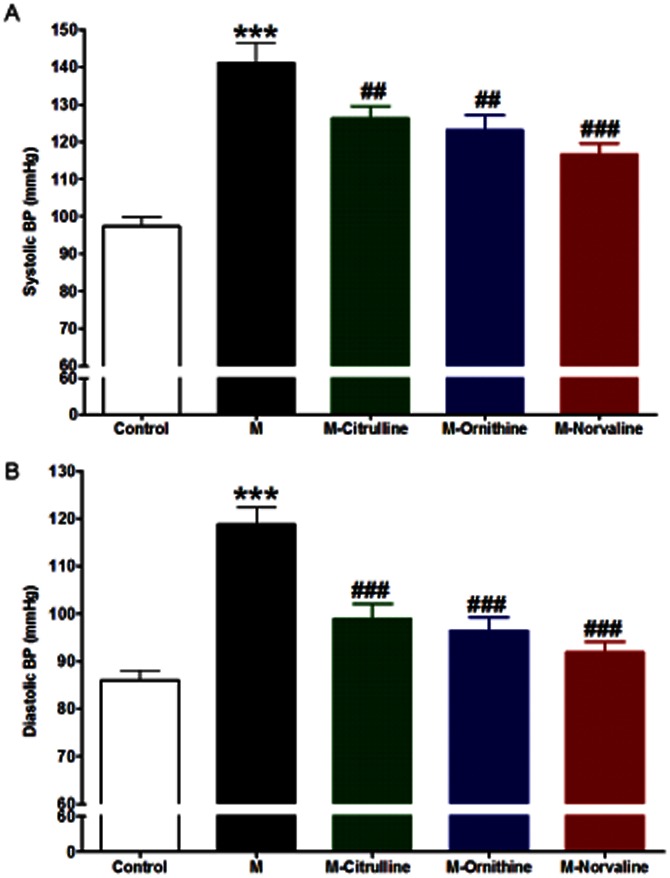
Effect of fructose- induced metabolic syndrome (M, 10% in drinking water, for 12 weeks) and daily oral administration (last 6 weeks) of citrulline (50 mg·kg−1), norvaline (50 mg·kg−1) or ornithine (200 mg·kg−1) on the systolic (A) and diastolic (B) blood pressure. *P < 0.05, **P < 0.01, ***P < 0.001, compared with the corresponding control group values; #P < 0.05, ##P < 0.01, ###P < 0.001 compared with the corresponding M group values; by one-way anova and Newman–Keuls post hoc test.
Vascular reactivity
Cumulative addition of PE (10−9 to 10−5 M) or KCl (10−2 to 10−1 M) to the organ bath resulted in concentration-dependent contractions of aorta in all the groups (Figure 3). Metabolic syndrome induced by fructose (10% in drinking water for 12 weeks) resulted in a large increase in aorta responsiveness to PE, reflected by a significant increase in apparent Emax (P < 0.001, Figure 3A, Table 2). In vivo treatment of animals with the arginase inhibitors citrulline, ornithine or norvaline had no significant effect on the response of isolated aorta to PE (Figure 3A, Table 2). Metabolic syndrome was associated with an increase in the aortic responsiveness to KCl as shown by a significant increase in the apparent Emax (P < 0.001, Figure 3B, Table 2). Similarly, in vivo arginase inhibition by citrulline, ornithine or norvaline did not significantly affect the response of isolated aorta to KCl (Figure 3B, Table 2). Cumulative addition of ACh (10−9 to 10−5 M) to the organ bath resulted in concentration-related decreases in the tension of aortic artery rings pre-contracted with PE (Figure 3C, Table 2). Metabolic syndrome was associated with a large decrease in aorta responsiveness to ACh, reflected by a significant decrease in apparent Emax (P < 0.01) compared with the control (Figure 3C, Table 2). However, this impairment in isolated aorta response to ACh was prevented by in vivo treatment with citrulline, ornithine or norvaline (all at P < 0.001, Figure 3C, Table 2).
Figure 3.
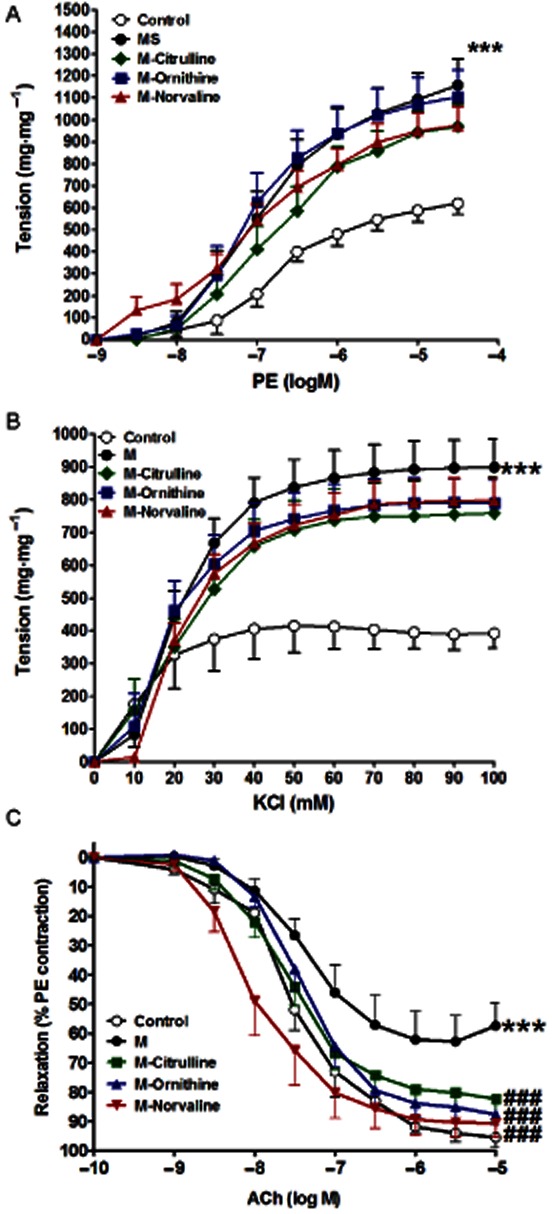
Effect of fructose- induced metabolic syndrome (M, 10% in drinking water, for 12 weeks) and daily oral administration (last 6 weeks) of citrulline (50 mg·kg−1), norvaline (50 mg·kg−1) or ornithine (200 mg·kg−1) on the isolated aorta responsiveness to PE (A), KCl (B) and ACh (C). Symbols indicate mean ± SEM for n = 6–8 animals; *P < 0.05, **P < 0.01, ***P < 0.001, compared with the corresponding control group values; #P < 0.05, ##P < 0.01, ###P < 0.001 compared with the corresponding M group values; by one-way anova and Newman–Keuls post hoc test.
Table 2.
Effect of fructose-induced metabolic syndrome (M, 10% in drinking water, for 12 weeks) and daily oral administration (last 6 weeks) of citrulline (50 mg·kg−1), norvaline (50 mg·kg−1) or ornithine (200 mg·kg−1) on the maximal response (Emax) and pD2 (-Log EC50) or EC50 values of PE, KCl and ACh dose response curves
| Treatment | KCl | PE | ACh | |||
|---|---|---|---|---|---|---|
| Emax | EC50 | Emax | pD2 | Emax | pD2 | |
| Control | 401.8 ± 29.0 | 8.3 ± 13.7 | 598.2 ± 25.8 | 6.7 ± 0.1 | 94.3 ± 2.6 | 7.5 ± 0.1 |
| M | 882.7 ± 32.4*** | 19.4 ± 3.7 | 1091.0 ± 53.0*** | 7.0 ± 0.1 | 61.3 ± 4.1*** | 7.4 ± 0.2 |
| M-Citrulline | 757.1 ± 45.1 | 17.4 ± 10.1 | 933.9 ± 46.7 | 6.8 ± 0.1 | 81.2 ± 3.2### | 7.6 ± 0.1 |
| M-Ornithine | 779.2 ± 33.3 | 16.7 ± 5.4 | 1063.0 ± 54.7 | 7.1 ± 0.2 | 86.3 ± 2.7### | 7.4 ± 0.1 |
| M-Norvaline | 777.5 ± 25.4 | 20.6 ± 3.1 | 925.9 ± 38.4 | 7.1 ± 0.1 | 89.5 ± 3.9### | 8.0 ± 0.1## |
Values are expressed as the mean ± SE of mean; n = 6–8 animals; *P < 0.05, **P < 0.01, ***P < 0.001, compared with the corresponding control group values; #P < 0.05, ##P < 0.01, ###P < 0.001 compared with the corresponding MS group values; by one-way anova and Newman–Keuls post hoc test.
Incubation of isolated aorta from metabolic syndrome animals with any of the arginase inhibitors (citrulline, norvaline or ornithine, all at 1 mM for 1 h) did not affect the aortic hyperresponsiveness to PE (Figure 4A, Table 3). Similarly, none of the arginase inhibitors used affected the metabolic syndrome-induced aortic hyperresponsiveness to KCl (Figure 4B). In contrast, the impairment in response to ACh in aorta isolated from animals with metabolic syndrome (P < 0.01, Figure 4C, Table 3) was corrected by arginase inhibition with citrulline (P < 0.05) or ornithine (P < 0.05, Figure 4C, Table 3).
Figure 4.
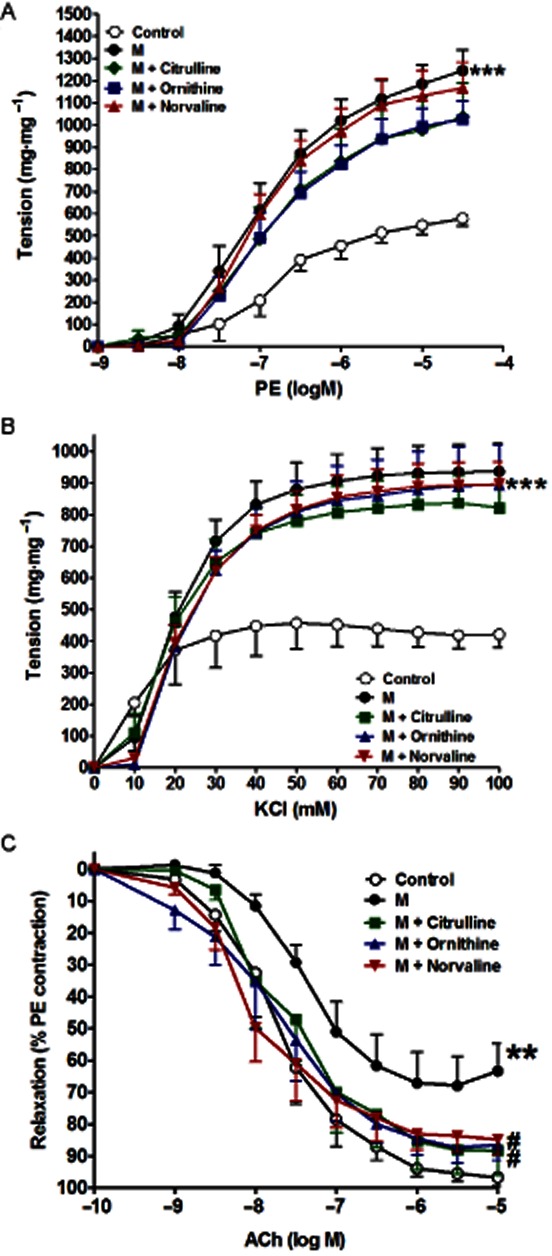
Effect of in vitro incubation with citrulline (1 mM, 1 h), norvaline (1 mM, 1 h) or ornithine (1 mM, 1 h) on the isolated metabolic syndrome (M) aorta responsiveness to PE (A), KCl (B) and ACh (C). Symbols indicate mean ± SEM for n = 6–8 animals; *P < 0.05, **P < 0.01, ***P < 0.001, compared with the corresponding control group values; #P < 0.05, ##P < 0.01, ###P < 0.001 compared with the corresponding M group values; by one-way anova and Newman–Keuls post hoc test.
Table 3.
Effect of in vitro incubation with cirulline (1 mM, 1 h), norvaline (1 mM, 1 h) or ornithine (1 mM, 1 h) on the maximal response (Emax) and pD2 (-Log EC50) or EC50 values of PE, KCl and ACh dose response curves of the isolated metabolic syndrome (M) aorta
| Treatment | KCl | PE | ACh | |||
|---|---|---|---|---|---|---|
| Emax | EC50 | Emax | pD2 | Emax | pD2 | |
| Control | 437.2 ± 29.4 | 8.3 ± 11.0 | 567.4 ± 37.3 | 6.8 ± 0.1 | 95.8 ± 3.9 | 7.7 ± 0.1 |
| M | 920.6 ± 32.0*** | 19.1 ± 3.4 | 1225.0 ± 70.9*** | 7.0 ± 0.1 | 66.5 ± 4.1** | 7.4 ± 0.1 |
| M + Citrulline | 818.1 ± 31.4 | 17.6 ± 4.2 | 1016.0 ± 97.9 | 7.0 ± 0.2 | 88.4 ± 6.2# | 7.7 ± 0.2 |
| M + Ornithine | 868.0 ± 39.4 | 21.5 ± 4.1 | 1014.0 ± 60.7 | 7.0 ± 0.1 | 89.1 ± 6.3# | 7.8 ± 0.2 |
| M + Norvaline | 877.0 ± 25.8 | 21.1 ± 2.9 | 1142.0 ± 58.7 | 7.0 ± 0.1 | 83.1 ± 3.9 | 8.1 ± 0.1 |
Values are expressed as the mean ± SE of mean; n = 6–8 animals; *P < 0.05, **P < 0.01, ***P < 0.001, compared with the corresponding control group values; #P < 0.05,##P < 0.01, ###P < 0.001 compared with the corresponding MS group values; by One Way anova and Newman Keuls post hoc test.
In experiments designed to assess the effect of uric acid on tissue responsiveness, incubation of isolated aorta from a normal animal for 1 h with uric acid (200 μM) had no significant effect on the aortic response to PE (Figure 5A, Table 4) or to KCl (Figure 5B, Table 4) compared to control. However, it significantly impaired the relaxation response to ACh (P < 0.001, Figure 5C, Table 4) compared to control. This impaired response to ACh due to incubation with uric acid was significantly prevented by co-incubation with any of the arginase inhibitors used (citrulline, ornithine and norvaline all at 1 mM and P < 0.05, Figure 5C, Table 4).
Figure 5.
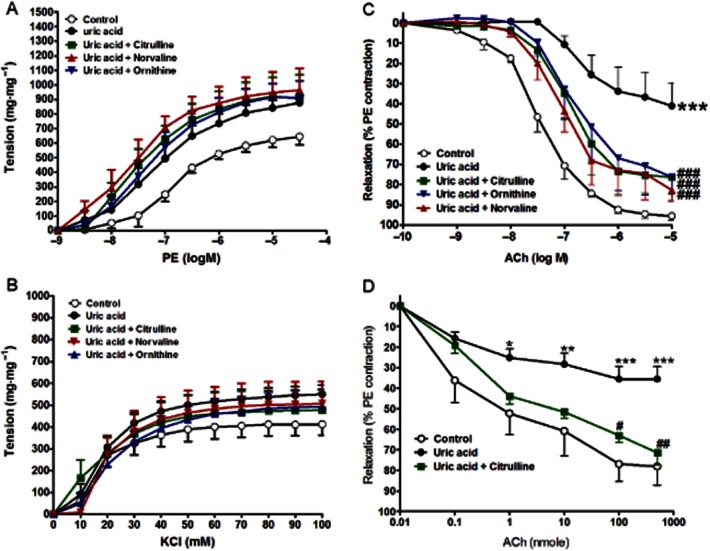
Effect of in vitro incubation with uric acid (200 μM, 1 h) with or without cirulline (1 mM, 1 h), norvaline (1 mM, 1 h) or ornithine (1 mM, 1 h) on the isolated normal aorta responsiveness to PE (A), KCl (B) and ACh (C) or on the isolated perfused kidney relaxation to ACh (D). Symbols indicate mean ± SEM for n = 6–8 animals; *P < 0.05, **P < 0.01, ***P < 0.001, compared with the corresponding control group values; #P < 0.05, ##P < 0.01, ###P < 0.001 compared with the corresponding uric acid values; by one-way anova and Newman–Keuls post hoc test.
Table 4.
Effect of in vitro incubation with uric acid (400 μM, 1 h) with or without cirulline (1 mM, 1 h), norvaline (1 mM, 1 h) or ornithine (1 mM, 1 h) on the maximal response (Emax) and pD2 (-Log EC50) or EC50 values of PE, KCl and ACh dose response curves of the isolated normal aorta
| Treatment | KCl | PE | ACh | |||
|---|---|---|---|---|---|---|
| Emax | EC50 | Emax | pD2 | Emax | pD2 | |
| Control | 437.2 ± 29.4 | 15.5 ± 5.5 | 609.3 ± 36.4 | −6.8 ± 0.1 | 95.3 ± 2.2 | 7.4 ± 0.1 |
| Uric acid | 534.2 ± 19.3 | 15.4 ± 5.8 | 879.8 ± 66.4** | −7.2 ± 0.2 | 38.9 ± 5.4*** | 6.7 ± 0.2* |
| Uric acid + citrulline | 478.6 ± 46.6 | −2.2 ± 65.3 | 915.4 ± 72.1 | −7.6 ± 0.3 | 76.9 ± 5.7### | 6.9 ± 0.1 |
| Uric acid + ornithine | 484.3 ± 30.0 | 17.9 ± 10.4 | 920.1 ± 65.5 | −7.3 ± 0.2 | 74.9 ± 8.5### | 6.9 ± 0.2 |
| Uric acid + norvaline | 490.3 ± 33.7 | 19.2 ± 5.9 | 962.8 ± 79.3 | −7.7 ± 0.4 | 78.8 ± 5.3### | 7.1 ± 0.1 |
Values are expressed as the mean ± SE of mean; n = 6–8 animals; *P < 0.05, **P < 0.01, ***P < 0.001, compared with the corresponding control group values; #P < 0.05, ##P < 0.01, ###P < 0.001 compared with the corresponding uric acid group values; by one-way anova and Newman–Keuls post hoc test.
Microvascular reactivity
Cumulative injection of ACh, in doses of 0.1 to 500 nmol, resulted in dose-related decreases in the perfusion pressure of isolated kidney pre-contracted with PE (Figure 5D). Perfusion of isolated normal kidney with buffer containing uric acid (200 μM) for 1 h led to a significant reduction in the renovascular relaxation response to ACh (P < 0.001, Figure 5D). This impaired response to ACh due to incubation with uric acid was significantly inhibited by 30 min perfusion with buffer containing 1 mM citrulline (P < 0.01, Figure 5D).
ACh-induced NO generation
Addition of ACh (10−4 M) to DAF-loaded aorta from normal animals induced a strong increase in NO production, as assessed by increased fluorescence. However, metabolic syndrome significantly inhibited the Ach-stimulated NO release compared to control animals, reflected by a significantly reduced apparent Emax (P < 0.001, Figure 6A). Interestingly, this impaired aortic NO generation was completely prevented by arginase inhibition by citrulline (P < 0.001), ornithine (P < 0.05) or norvaline (P < 0.01, 6A).
Figure 6.
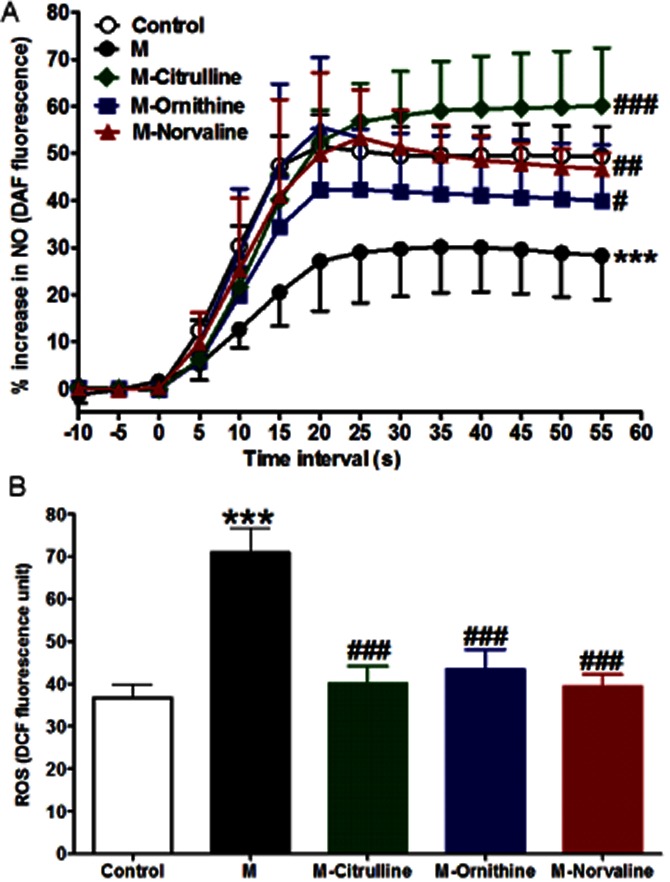
Effect of fructose- induced metabolic syndrome (M, 10% in drinking water, for 12 weeks) and chronic daily oral administration (last 6 weeks) of citrulline (50 mg·kg−1), norvaline (50 mg·kg−1) or ornithine (200 mg·kg−1) on ACh-stimulated NO generation (A) and basal ROS formation (B). Symbols indicate mean ± SEM for n = 6–8 animals; *P < 0.05, **P < 0.01, ***P < 0.001, compared with the corresponding control group values; #P < 0.05, ##P < 0.01, ###P < 0.001 compared with the corresponding M group values; by one-way anova and Newman–Keuls post hoc test.
Intracellular ROS generation
Aorta isolated from animals with metabolic syndrome had a significantly increased ROS generation (P < 0.001, Figure 6B) compared to control. Interestingly all the arginase inhibitors (citrulline, norvaline and ornithine) significantly decreased ROS generation (all at P < 0.001, Figure 6B). Moreover, we found strong correlations between ROS generation and arginase activity (r = 0.75, P < 0.001) and between the ROS generation and the insulin level (r = 0.67, P < 0.01).
Control experiments
None of the used arginase inhibitors citrulline, norvaline or ornithine affected the previously mentioned parameters compared to control when given to normal animals for the same periods of time (data not shown).
Discussion and conclusions
The current study is the first to report on the potential protective effect of arginase inhibition against the hypertension associated with metabolic syndrome. The arginase inhibitors citrulline, ornithine or norvaline virtually inhibited the development of hypertension in fructose-induced metabolic syndrome in rats. The following findings can explain the ability of arginase inhibition to counteract hypertension accompanying metabolic syndrome: (i) arginase inhibition ameliorated the impaired ACh-induced relaxations associated with metabolic syndrome; (ii) the impaired NO and increased ROS generation in metabolic syndrome were abrogated by arginase inhibition; and (iii) arginase inhibition prevented the development of insulin resistance and hypertriglyceridaemia in metabolic syndrome. These findings provide convincing evidence that arginase offsets the hypertension accompanying the metabolic syndrome through endothelial-dependent relaxation NO signalling protection.
We reasoned that arginase inhibition would mitigate or at least minimize the hypertension components of the metabolic syndrome. The validity of this assumption was ascertained in this work because all the arginase inhibitors used significantly inhibited the elevations in diastolic and systolic BP seen in animals with metabolic syndrome. The elevated systolic (after load) BP in diabetic animals could be due to cardiac complication and/or aortic stiffness while the elevated diastolic (pre-load) BP is attributed to the impaired vascular reactivity observed in diabetic animals. Aortic stiffness has been reported to be responsible for augmented pressure in late systole (O'Rourke and Nichols, 2005).
We focused on the impairment in vascular reactivity because of its importance in the development of hypertension (Mansour et al., 2011) and in metabolic syndrome-evoked hypertension in particular (Schinzari et al., 2010). The findings of the present study highlight a pivotal role for vascular reactivity in the amelioration of metabolic syndrome-evoked hypertension by arginase inhibition. We have found increased contraction of isolated aorta to PE and KCl and decreased relaxation to ACh in animals with metabolic syndrome, while arginase inhibitors prevented the impaired relaxation to ACh in aorta isolated from animals with metabolic syndrome without affecting the response to PE or KCl. These findings are supported by previous reports from us and other laboratories, which showed increased response to different vasoconstrictors (El-Bassossy et al., 2011a; Mahmoud et al., 2012) and impaired endothelium-dependent dilatation (Verma et al., 1996; Takagawa et al., 2001) due to insulin resistance. In addition, we have previously shown that arginase inhibition alleviates hypertension and impaired endothelial-dependent relaxation associated with insulin deficiency (El-Bassossy et al., 2012b).
We used three inhibitors that are known to inhibit arginase enzyme by different ways in order to confirm that the observed protection is most likely due to arginase enzyme inhibition and not due to a direct effect of the inhibitors. Ornithine inhibits arginase enzyme by competing with its substrate L-arginine on the active sites of the enzyme. Norvaline is a non-competitive inhibitor of the arginase enzyme (Hunter and Downs, 1945). L-citrulline is an allosteric inhibitor of arginase (Shearer et al., 1997).
In the present work, we found increased arginase activity in animals with metabolic syndrome while all the inhibitors showed a significant inhibition of arginase activity at the doses and durations used. The protective effect of arginase inhibition on elevated diastolic BP in animals with metabolic syndrome seems to be through direct and indirect mechanisms. The direct protective effect is via improving relaxation. This is because acute in vitro arginase inhibition significantly increased endothelial-dependent relaxation in aorta isolated from animals with metabolic syndrome in this study. The indirect protective effect of arginase inhibition is through amelioration of the developed insulin resistance. In the present work, arginase inhibition was statistically correlated with the reduction in the developed insulin resistance. This points to the role of arginase enzyme activity in the metabolic syndrome. Hyperuricaemia is one of the important components of the metabolic syndrome and is a true risk factor for cardiovascular disease in metabolic syndrome. The proposed mechanism is through inhibiting endothelial-dependent relaxation and NO production (Heinig and Johnson, 2006). In this study, in vitro incubation with uric acid at the concentration seen in animals with metabolic syndrome significantly impairs endothelial-dependent relaxation in aorta isolated from normal animals. To test if the observed hyperuricaemia is responsible for arginase activation in metabolic syndrome, we found that in vitro incubation with uric acid did not significantly affect the arginase activity in isolated vessels. On the other hand, the observed uric acid-induced impairment in relaxation was prevented by co-incubation with any of the arginase inhibitors while none of them affected the serum level of uric acid in animals with metabolic syndrome. This suggests an indirect relationship between hyperuricaemia and arginase enzyme in metabolic syndrome.
The mechanism(s) by which arginase inhibition protects against the impairment in endothelium-dependent relaxation could be mediated, at least in part, by modulation of NO production. In this work, treatment with any of the arginase inhibitors prevented the impairment in Ach-stimulated NO generation in aorta isolated from animals with metabolic syndrome. Reducing arginase activity via dietary manganese deficiency has been previously reported to enhance endothelium-dependent vasorelaxation of rat aorta (Ensunsa et al., 2004). The observed protection of ACh-stimulated NO generation due to arginase inhibition in metabolic syndrome could be due to inhibition of eNOS uncoupling and NO quenching by ROS. Arginase inhibition restores the availability of L-arginine for eNOS and limits NO inactivation by superoxide anion produced by eNOS as a result of arginine depletion (Santhanam et al., 2008). In support of this, we have found a significant reduction in ROS generation in vessels isolated from animals with metabolic syndrome due to arginase inhibition. The decrease in ROS generation seems to be due to inhibition of eNOS uncoupling that follow arginase inhibition in this study. Modulation of eNOS co-factors like BH4 is another possibility of restored ACh-induced NO generation by arginase inhibition in metabolic syndrome as BH4 can be easily oxidized by ROS. In a previous report from our group, we found that external addition of BH4 blocks the attenuation in ACh-stimulated NO generation (El-Bassossy et al., 2009).
The possibility that alterations in circulating lipid profile contributed to the metabolic syndrome–arginase hemodynamic interaction was also investigated. Dyslipidemia is associated with increased cardiovascular morbidity and mortality (Robins et al., 2003). Our findings showed that the metabolic syndrome was characterized by hypertriglyceridaemia and hypercholesterolaemia. While arginase inhibition did not affect the developed hypercholesterolaemia, it completely prevented hypertriglyceridaemia associated with metabolic syndrome. In addition, serum triglyceride levels were strongly correlated with arginase activity in all groups. These observations strongly suggest a role of arginase enzyme in the hypertriglyceridaemia associated with metabolic syndrome. A possible explanation to this novel finding is that increased arginase activity limits L-arginine for eNOS and hence reduces NO production. NO plays an important role in reducing triglycerides level. It was found that diets rich in nitrite promote NO production and reduce triglycerides in humans (Zand et al., 2011), while the NO synthase inhibitor L-N{omega}nitroarginine (L-NNA) elevates serum triglyceride (Goto et al., 1999). The effect of NO on serum triglyceride levels might be due to reduced fatty acid oxidation as it has been shown that inhibiting NO synthase by L-NNA lowered the activity of hepatic carnitine palmitoyl transferase, the rate-limiting enzyme of fatty acid oxidation (Goto et al., 1999).
In conclusion, arginase inhibition by citrulline, norvaline or ornithine alleviates hypertension associated with metabolic syndrome by direct and indirect protective mechanisms. The direct protective mechanism is through maintenance of endothelial-dependent relaxation and NO generation, while the indirect mechanism is through inhibition of insulin resistance and hypertriglyceridaemia.
Acknowledgments
This work is funded by a research grant (ID: 1024) provided by the Science and Technology Development Fund, Egypt.
Glossary
- PE
phenylephrine
- ROS
reactive oxygen species
Conflict of interest
The authors state no conflict of interest.
References
- Berkowitz DE, White R, Li D, Minhas KM, Cernetich A, Kim S, et al. Arginase reciprocally regulates nitric oxide synthase activity and contributes to endothelial dysfunction in aging blood vessels. Circulation. 2003;108:2000–2006. doi: 10.1161/01.CIR.0000092948.04444.C7. [DOI] [PubMed] [Google Scholar]
- Bivalacqua TJ, Hellstrom WJ, Kadowitz PJ, Champion HC. Increased expression of arginase II in human diabetic corpus cavernosum: in diabetic-associated erectile dysfunction. Biochem Biophys Res Commun. 2001;283:923–927. doi: 10.1006/bbrc.2001.4874. [DOI] [PubMed] [Google Scholar]
- Cederbaum SD, Yu H, Grody WW, Kern RM, Yoo P, Iyer RK. Arginases I and II: do their functions overlap? Mol Genet Metab. 2004;81(Suppl. 1):S38–S44. doi: 10.1016/j.ymgme.2003.10.012. [DOI] [PubMed] [Google Scholar]
- El-Bassossy HM, El-Maraghy NN, El-Fayoumi HM, Watson ML. Haem oxygenase-1 induction protects against tumour necrosis factor alpha impairment of endothelial-dependent relaxation in rat isolated pulmonary artery. Br J Pharmacol. 2009;158:1527–1535. doi: 10.1111/j.1476-5381.2009.00419.x. [DOI] [PMC free article] [PubMed] [Google Scholar]
- El-Bassossy HM, El-Moselhy MA, Mahmoud MF. Pentoxifylline alleviates vascular impairment in insulin resistance via TNF-α inhibition. Naunyn Schmiedebergs Arch Pharmacol. 2011a;384:277–285. doi: 10.1007/s00210-011-0669-z. [DOI] [PubMed] [Google Scholar]
- El-Bassossy HM, Fahmy A, Badawy D. Cinnamaldehyde protects from the hypertension associated with diabetes. Food Chem Toxicol. 2011b;49:3007–3012. doi: 10.1016/j.fct.2011.07.060. [DOI] [PubMed] [Google Scholar]
- El-Bassossy HM, Abo-Warda SM, Fahmy A. Rosiglitazone, a PPARγ stimulant, abrogates diabetes-evoked hypertension via rectifying abnormalities in vascular reactivity. Clin Exp Pharmacol Physiol. 2012a;39:643–649. doi: 10.1111/j.1440-1681.2012.05724.x. [DOI] [PubMed] [Google Scholar]
- El-Bassossy HM, Fahmy A, El-Fawal R. Arginase inhibition alleviates hypertension associated with diabetes: effect on endothelial dependent relaxation and NO production. Vascul Pharmacol. 2012b;57:194–200. doi: 10.1016/j.vph.2012.01.001. [DOI] [PubMed] [Google Scholar]
- El-Mas MM, El-Gowilly SM, Gohar EY, Ghazal AR, Abdel-Rahman AA. Estrogen dependence of the renal vasodilatory effect of nicotine in rats: role of α7 nicotinic cholinergic receptor/eNOS signaling. Life Sci. 2011;88:187–193. doi: 10.1016/j.lfs.2010.11.009. [DOI] [PMC free article] [PubMed] [Google Scholar]
- Ensunsa JL, Symons JD, Lanoue L, Schrader HR, Keen CL. Reducing arginase activity via dietary manganese deficiency enhances endothelium-dependent vasorelaxation of rat aorta. Exp Biol Med. 2004;229:1143–1153. doi: 10.1177/153537020422901109. [DOI] [PubMed] [Google Scholar]
- Ford ES, Giles WH, Dietz WH. Prevalence of the metabolic syndrome among US adults: findings from the third national health and nutrition examination survey. JAMA. 2002;287:356–359. doi: 10.1001/jama.287.3.356. [DOI] [PubMed] [Google Scholar]
- Fossati P, Prencipe L, Berti G. Use of 3,5-dichloro-2-hydroxybenzenesulfonic acid/4-aminophenazone chromogenic system in direct enzymic assay of uric acid in serum and urine. Clin Chem. 1980;26:227–231. [PubMed] [Google Scholar]
- Fuentes JM, Campo ML, Soler G. Kinetics and inhibition by some aminoacids of lactating rat mammary gland arginase. Arch Int Physiol Biochim Biophys. 1994;102:255–258. doi: 10.3109/13813459409003940. [DOI] [PubMed] [Google Scholar]
- Goto T, Ohnomi S, Khedara A, Kato N, Ogawa H, Yanagita T. Feeding the nitric oxide synthase inhibitor L-N(omega)nitroarginine elevates serum very low density lipoprotein and hepatic triglyceride synthesis in rats. J Nutr Biochem. 1999;10:274–278. doi: 10.1016/s0955-2863(99)00008-x. [DOI] [PubMed] [Google Scholar]
- Gronros J, Jung C, Lundberg JO, Cerrato R, Ostenson CG, Pernow J. Arginase inhibition restores in vivo coronary microvascular function in type 2 diabetic rats. Am J Physiol Heart Circ Physiol. 2011;300:H1174–H1181. doi: 10.1152/ajpheart.00560.2010. [DOI] [PubMed] [Google Scholar]
- Heinig M, Johnson RJ. Role of uric acid in hypertension, renal disease, and metabolic syndrome. Cleve Clin J Med. 2006;73:1059–1064. doi: 10.3949/ccjm.73.12.1059. [DOI] [PubMed] [Google Scholar]
- Hunter A, Downs CE. The inhibition of arginase by amino acids. J Biol Chem. 1945;157:427–446. [Google Scholar]
- Huynh NN, Harris EE, Chin-Dusting JF, Andrews KL. The vascular effects of different arginase inhibitors in rat isolated aorta and mesenteric arteries. Br J Pharmacol. 2009;156:84–93. doi: 10.1111/j.1476-5381.2008.00036.x. [DOI] [PMC free article] [PubMed] [Google Scholar]
- Kang ES, Ford K, Grokulsky G, Wang YB, Chiang TM, Acchiardo SR. Normal circulating adult human red blood cells contain inactive NOS proteins. J Lab Clin Med. 2000;135:444–451. doi: 10.1067/mlc.2000.106805. [DOI] [PubMed] [Google Scholar]
- Kashyap SR, Lara A, Zhang R, Park YM, DeFronzo RA. Insulin reduces plasma arginase activity in type 2 diabetic patients. Diabetes Care. 2008;31:134–139. doi: 10.2337/dc07-1198. [DOI] [PMC free article] [PubMed] [Google Scholar]
- Kilkenny C, Browne W, Cuthill IC, Emerson M, Altman DG. NC3Rs Reporting Guidelines Working Group. Br J Pharmacol. 2010;160:1577–1579. doi: 10.1111/j.1476-5381.2010.00872.x. [DOI] [PMC free article] [PubMed] [Google Scholar]
- Kim J, Montagnani M, Koh KK, Quon MJ. Reciprocal relationships between insulin resistance and endothelial dysfunction: molecular and pathophysiological mechanisms. Circulation. 2006;113:1888–1904. doi: 10.1161/CIRCULATIONAHA.105.563213. [DOI] [PubMed] [Google Scholar]
- Kolovou GD, Anagnostopoulou KK, Cokkinos DV. Pathophysiology of dyslipidaemia in the metabolic syndrome. Postgrad Med J. 2005;81:358–366. doi: 10.1136/pgmj.2004.025601. [DOI] [PMC free article] [PubMed] [Google Scholar]
- McGrath J, Drummond G, McLachlan E, Kilkenny C, Wainwright C. Guidelines for reporting experiments involving animals: the ARRIVE guidelines. Br J Pharmacol. 2010;160:1573–1576. doi: 10.1111/j.1476-5381.2010.00873.x. [DOI] [PMC free article] [PubMed] [Google Scholar]
- Mahmoud MF, El-Nagar M, El-Bassossy HM. Anti-inflammatory effect of atorvastatin on vascular reactivity and insulin resistance in fructose fed rats. Arch Pharm Res. 2012;35:155–162. doi: 10.1007/s12272-012-0117-8. [DOI] [PubMed] [Google Scholar]
- Mansour SM, Bahgat AK, El-Khatib AS, Khayyal MT. Ginkgo biloba extract (EGb 761) normalizes hypertension in 2K, 1C hypertensive rats: role of antioxidant mechanisms, ACE inhibiting activity and improvement of endothelial dysfunction. Phytomedicine. 2011;18:641–647. doi: 10.1016/j.phymed.2011.01.014. [DOI] [PubMed] [Google Scholar]
- Matthews DR, Hosker JP, Rudenski AS, Naylor BA, Treacher DF, Turner RC. Homeostasis model assessment: insulin resistance and beta-cell function from fasting plasma glucose and insulin concentrations in man. Diabetologia. 1985;28:412–419. doi: 10.1007/BF00280883. [DOI] [PubMed] [Google Scholar]
- Mendez JD, Sosa A, Palomar-Morales M. Effect of L-arginine on arginase activity in male accessory sex glands of alloxan-treated rats. Reprod Toxicol. 2002;16:809–813. doi: 10.1016/s0890-6238(02)00057-6. [DOI] [PubMed] [Google Scholar]
- Morris CR, Morris SM, Jr, Hagar W, van Warmerdam J, Claster S, Kepka-Lenhart D, et al. Arginine therapy: a new treatment for pulmonary hypertension in sickle cell disease? Am J Respir Crit Care Med. 2003;168:63–69. doi: 10.1164/rccm.200208-967OC. [DOI] [PubMed] [Google Scholar]
- Morris SM, Jr, Gao T, Cooper TK, Kepka-Lenhart D, Awad AS. Arginase-2 mediates diabetic renal injury. Diabetes. 2011;60:3015–3022. doi: 10.2337/db11-0901. [DOI] [PMC free article] [PubMed] [Google Scholar]
- O'Rourke MF, Nichols WW. Aortic diameter, aortic stiffness, and wave reflection increase with age and isolated systolic hypertension. Hypertension. 2005;45:652–658. doi: 10.1161/01.HYP.0000153793.84859.b8. [DOI] [PubMed] [Google Scholar]
- Robins SJ, Rubins HB, Faas FH, Schaefer EJ, Elam MB, Anderson JW, et al. Insulin resistance and cardiovascular events with low HDL cholesterol: the veterans affairs HDL intervention trial (VA-HIT) Diabetes Care. 2003;26:1513–1517. doi: 10.2337/diacare.26.5.1513. [DOI] [PubMed] [Google Scholar]
- Romero MJ, Platt DH, Tawfik HE, Labazi M, El-Remessy AB, Bartoli M, et al. Diabetes-induced coronary vascular dysfunction involves increased arginase activity. Circ Res. 2008;102:95–102. doi: 10.1161/CIRCRESAHA.107.155028. [DOI] [PMC free article] [PubMed] [Google Scholar]
- Saad MF, Rewers M, Selby J, Howard G, Jinagouda S, Fahmi S, et al. Insulin resistance and hypertension: the insulin resistance atherosclerosis study. Hypertension. 2004;43:1324–1331. doi: 10.1161/01.HYP.0000128019.19363.f9. [DOI] [PubMed] [Google Scholar]
- Santhanam L, Christianson DW, Nyhan D, Berkowitz DE. Arginase and vascular aging. J Appl Physiol. 2008;105:1632–1642. doi: 10.1152/japplphysiol.90627.2008. [DOI] [PMC free article] [PubMed] [Google Scholar]
- Schinzari F, Tesauro M, Rovella V, Galli A, Mores N, Porzio O, et al. Generalized impairment of vasodilator reactivity during hyperinsulinemia in patients with obesity-related metabolic syndrome. Am J Physiol Endocrinol Metab. 2010;299:E947–E952. doi: 10.1152/ajpendo.00426.2010. [DOI] [PubMed] [Google Scholar]
- Shearer JD, Richards JR, Mills CD, Caldwell MD. Differential regulation of macrophage arginine metabolism: a proposed role in wound healing. Am J Physiol Endocrinol Metab. 1997;272:E181–E190. doi: 10.1152/ajpendo.1997.272.2.E181. [DOI] [PubMed] [Google Scholar]
- Takagawa Y, Berger ME, Hori MT, Tuck ML, Golub MS. Long-term fructose feeding impairs vascular relaxation in rat mesenteric arteries. Am J Hypertens. 2001;14:811–817. doi: 10.1016/s0895-7061(01)01298-5. [DOI] [PubMed] [Google Scholar]
- Ugochukwu NH, Cobourne MK. Modification of renal oxidative stress and lipid peroxidation in streptozotocin-induced diabetic rats treated with extracts from Gongronema latifolium leaves. Clin Chim Acta. 2003;336:73–81. doi: 10.1016/s0009-8981(03)00325-5. [DOI] [PubMed] [Google Scholar]
- Verma S, Bhanot S, Yao L, McNeill JH. Defective endothelium-dependent relaxation in fructose-hypertensive rats. Am J Hypertens. 1996;9:370–376. doi: 10.1016/0895-7061(95)00392-4. [DOI] [PubMed] [Google Scholar]
- Zand J, Lanza F, Garg HK, Bryan NS. All-natural nitrite and nitrate containing dietary supplement promotes nitric oxide production and reduces triglycerides in humans. Nutr Res. 2011;31:262–269. doi: 10.1016/j.nutres.2011.03.008. [DOI] [PubMed] [Google Scholar]
- Zhang C, Hein TW, Wang W, Miller MW, Fossum TW, McDonald MM, et al. Upregulation of vascular arginase in hypertension decreases nitric oxide-mediated dilation of coronary arterioles. Hypertension. 2004;44:935–943. doi: 10.1161/01.HYP.0000146907.82869.f2. [DOI] [PubMed] [Google Scholar]